As I write this post the KC outfield defense is ranked No. 1 in Defensive Runs Saved (DRS) with 43, and is No. 2 in UZR at 28.6 (first is the Cubs with 29.0). KC sports one of the best, if not the best defensive outfield in the majors this season.
Detroit on the other hand has a fairly poor one. They rank last in DRS, with -44, and last in UZR at -31.8. Though Baltimore gives them a good run for their money, Detroit is probably the worst defensive outfield in the majors so far this season.
So I wondered if we could do an analysis to show what would happen if we substituted them entirely for one another? How would that work? Well, one simple approach would be to just use the DRS metrics for each team and basically say that DET would go from -44 to +43, so that’s a swing of +77 runs. Using the 10 runs per win thumb-rule, that’d be a pretty big swing, nearly eight games. Detroit is a whole lot better. But I’m not sure this method is really the best we can do. After all, we have all this Statcast data now. Could we use that?
I set out to try to do just that. So my first step was to hypothesize that the likelihood of a ball hit to the outfield actually dropping for a base hit could be correlated to the launch angle provided by Statcast and then that this likelihood would change depending on the team. So to test this theory out I went to Baseball Savant and grabbed all the Statcast data for balls hit to the outfield for KC and for Detroit.
The KC data consisted of 1722 balls hit to the OF (when removing the few points that had NULL data for launch angle). I took these 1722 points and bucketed them by launch angle in buckets that were 2 degrees each. I then calculated the percentage of hits to total (hits + outs) for each bucket. This percentage was the likelihood that a ball hit to the outfield at a certain launch angle would end up being a base hit. This led me to my first realization, which was that anything that was basically < 8 degrees on launch angle (so including all negative angles), and made it to the OF, was a guaranteed hit.
The results of this analysis for the 1722 KC points made a lot of sense intuitively. As the launch angle increased, so did the likelihood that it was an out, so my hit percentage trend went down. Using a simple linear regression projecting the likelihood of a hit by angle had a 92.5% R^2. This equation was going to work nicely.
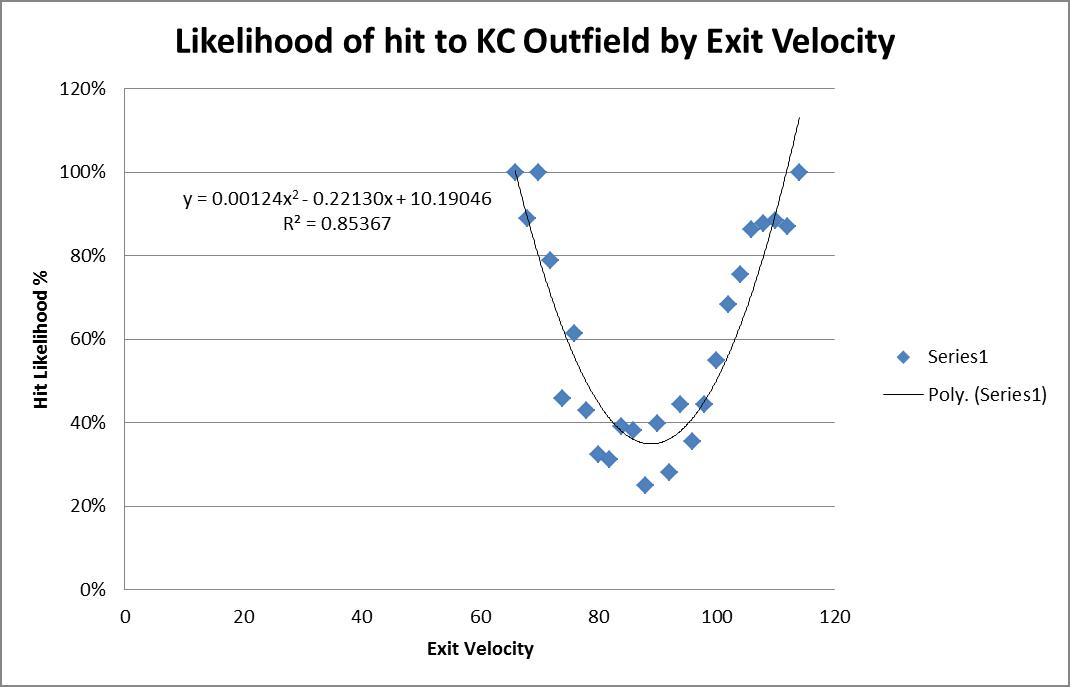
I then considered running the same drill but this time using exit velocity of the hit to see how that impacted the likelihood of a ball being a hit. There have been at least a couple article written on this topic, and the results I got matched up with the projections I had seen in other articles on the topic. That’s to say the trend isn’t linear, but more parabolic. Using a simple second-order polynomial trend, a very reasonable projection could again be made of a hit likelihood based on the exit velocity of a ball hit to the OF.
Using these two points of data for any ball put in play to the outfield (exit velocity and launch angle) it seems as though OF defense could be projected fairly reasonably.
I proceeded to re-run those same drills using Baseball Savant’s Detroit outfield data. Launch angle provided another great fit, 95% R^2 and a slightly higher overall trendline than KCs (notice the higher y-intercept or “b” value). KC’s OF was almost 4% more likely to catch a ball just from the “b” value.
Using a simple second-order poly trend for Detroit’s exit velocity also resulted again in an 85% R^2, very similar to that of KC. It also showed the expected parabolic action.
What I now had was a way to project the likelihood of the KC outfield or the DET outfield making a play on any ball hit to the outfield. All I needed to know was what the angle and exit velocity was. Lucky for us, Statcast gives us all that information.
My next step was to take all the OF plays made by Detroit and, using my newfound Detroit projection system, project the number of real hits based on the hit events to the OF. My Detroit projection system projected 1089 hits, in reality there were 986 hits. Not perfect, and something that could undergo some more tweaking, but reasonable. My projection system was overly simplistic — I took the likelihood from the angle * the likelihood from the exit velocity. If the multiplication was > 25% (i.e. 50% for each as the minimum threshold) then I projected a hit; else, an out.
So my Detroit projecting Detroit resulted in 1089 hits. When I substituted the KC projection equations in, the Detroit projected hit to the OF dropped to 903. This was a reduction of 186 expected hits! Wow. That’s some serious work the KC outfielders would’ve done.
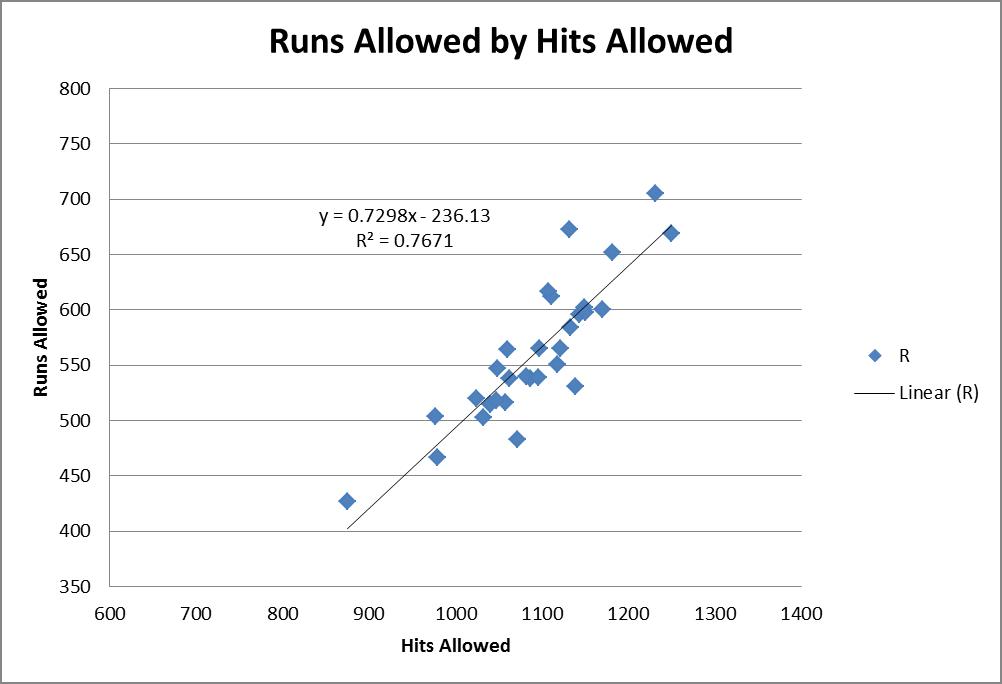
The last step here was then to attempt to convert this reduction in hits to a reduction in runs. I grabbed FanGraphs’ year-to-date pitching stats by team and used that to do a simple regression on hits allowed to runs allowed.
This showed strong correlation with a ~77% R^2. Using the slope of this equation it shows that each hit allowed correlates to 0.7298 runs. This means that a reduction of 186 hits would correlate to a reduction of 136 runs! Again, using the 10-run thumb-rule, that’s a nearly 14-win move. That’s amazing improvement. Now of course we are expecting drastic improvement; we’re talking about replacing the worst OF defense in the league with the best!
Conclusions
Are there some bold assumptions made here? Yes. However, I do think it’s a fairly reasonable approach. It’s fun to see all the different ways this new Statcast data can be used. This same drill could be run on all sorts of “swap” evaluations and could be a whole lot of fun for a variety of what-if scenarios. I enjoyed attempting to answer this question using the new data and hopefully you found this entertaining as well!


Just out of curiosity, anyone have the difference in run output between Detroit’s outfield and KC? That’s only counting run output as outfielders, not as DH or 1 PA pinch hitters.
Per fangraphs, the WRC+ for the tigers OF is a 99 while KC is only a 91. rank 14th and 24 overall.
http://www.fangraphs.com/leaders.aspx?pos=of&stats=bat&lg=all&qual=0&type=8&season=2016&month=0&season1=2016&ind=0&team=0,ts&rost=0&age=0&filter=&players=0&sort=16,d
My posts title probably wasn’t specifically clear that i was really focused on just substituting out their defense. This analysis speaks nothing of how the hitting would suffer. Though a simple regression of WRC+ to Runs, which i’m sure has a high correlation, could quickly ballpark that run production loss.
Going back and looking at the data really quickly, it actually appears that WOBA has the best correlation to overall runs scored. This makes sense. From 2010 – 2015 it had an R2 of 87.2% and the 2016 data so far has a 87.7% R2. So if we use that on the 2016 data so far the regression eqn associated with WOBA to Runs is –> Runs= 4158.5*(WOBA) – 753.66.
KC’s WOBA is 0.312, Detroit’s is 0.321. Doing the math with the 4158.5 slope shows that it’s a projected 37.4 run difference between the OFs due to offense.
Given my article above showing the KC defense would’ve resulted in ~136 Runs saved, that’s still a net 100 run improvement.
There are obviously some assumptions here that certainly could be challenged, but bottom line as a quick and dirty approach, shows Det’s OF offense worth about 37 more runs on offense and KCs worth about 136 more on defense.