Archive for Chicago Cubs

Who Obtains the Most Assistance in Pitcher Welfare?

Nobody’s perfect, especially umpires. This is the case at any level of the game. Be it softball, tee ball, or baseball, from Little League to the Big Leagues, you will have undeniably disagreed with a call that an ump has made.

Given the movement, velocity, and the newly anointed skill of pitch framing, it’s becoming more difficult for umpires to get the calls right. The robo ump has been discussed quite a bit but I’m not sure how I feel about a machine making decisions in lieu of accepting the concept of human error. We did it for decades before instant replay was instituted.

Umpires get balls and strikes wrong a lot. It’s the way it goes. Given that understanding, I wanted to know which pitcher has in recent years been the beneficiary of favorable calls.

And, like the umpires, not all (strike zone) charts are 100% accurate; leave a little room for error here.

I’ve parsed data on which pitchers have had the most declared strikes that were actually out of the zone. I decided to stop at 2014 because I felt that four years of information was sufficient for the study.

First, the accumulated data.

From 2014 to 2017, the amount of pitchers with phantom strikes has been increasing at fairly high rate; the biggest leap was from 2014 to 2015 (36 pitchers).

chart (4)

Interestingly, the pitchers with at least 100 ‘phantom strike’ calls has actually decreased.

chart (6)

And, despite the jump in total pitchers involved from ’14 to ’15, the pitchers with <=100 strikes called decreased at the highest rate.

Should we go tin foil hat and infer that umps are no longer favoring certain pitchers as much as they used to? Doubtful, but I’m not investigating integrity here.

So who is getting the most benefit from the perceptively visually impaired? First, I took the last four years of pitching data for our parameters. Then, I cut final the list down to a minimum of 10,000 pitches thrown. Lastly, I included only the top 20 pitchers in the group.

20PhantomStrikes

As we can see, Jon Lester of the Chicago Cubs has been the most aided overall; 562 non-strikes in four years.

For the optically minded, here is the pitch chart of Lester’s data.

Jon Lester
That’s A LOT of Trix!

Now, lets see if the percent of pitches has any impact on our leader(s).

20PhantomStrikesPercent

Not a whole lot of variance, at least near the top. Lester clearly wins The MLB Umpires’ “Benefit of the Doubt Award”.

OK, so now we’ve got our man. Case closed, right?

Oh…that little caveat of ‘pitch framing’. Perhaps its that Lester has had great framing from his catchers. Let’s look into that.

For the moment, we are going to focus on Lester and his primary catcher from 2014-2016, David Ross.

dRossLester

Clearly 2014 was Lester’s most favorable year with Ross. That year, Lester ranked third in total pitches called favorably out of the zone (156) and 11th in ratio of calls (4.47).

The subsequent years with Ross are as follows:

2015- 6th (141), 10th (4.43)
2016- 5th (125), 7th (3.95)

Here’s where things get a bit intriguing. Recapping 2017, things appear to fall apart completely for the Cubs in the context of pitch framing.

2017CubsFraming

The only catcher who was able to garner a positive framing rating was Kyle Schwarber, who caught just seven innings that year. But even his stats are far from impressive.

And how did Lester fair in terms of ‘phantom strikes’ that year? He ranked first in overall strikes called out of the zone (150) and fourth in total call ratio to pitches thrown (4.46).

He wasn’t all that far from the top under Ross, but was basically the frontman of the metrics in 2017.

Some things are hopelessly lost in the sphere of the unexplained. But, the research didn’t set out to find reasoning. In this case its more fun to be left with subjective theories. However, it’s a bit silly to think that there is actually an umpire conspiracy allowing Lester to succeed when he apparently shouldn’t.

My best guess is maybe they feel sorry for him since he can’t accurately throw the ball in the infield anywhere other than to the catcher (which did changed a bit in 2017)?

Regardless, Lester is our guy, here; receiving a sizable edge in terms of missed calls. It will be interesting to see if this trend continues this season.


On Jake Arrieta, Aaron Slegers, and Extreme Release Points

Jake Arrieta turning himself from a Baltimore castoff to a Chicago Cy Young Award winner was a fascinating thing to watch, especially considering how it happened. This wasn’t just a guy who benefited from a change of scenery. When Arrieta adopted a new look, it was much more than his jersey color that changed.

The alterations were covered in a great 2014 Jeff Sullivan article titled Building Jake Arrieta. Among the things noted in that piece was his new release point that was primarily the result of pitching from the third-base side of the rubber.

Sullivan noted changes in Arrieta’s delivery yet again this May, pointing out an even more extreme horizontal release point in a piece titled Jake Arrieta Has Not Been Good. How extreme? Well, he’s throwing like a giant. No, not the kind that play in San Francisco. Arrieta has achieved nearly the exact same release point as Minnesota Twins pitcher Aaron Slegers, who at 6-foot-10 is one of the tallest hurlers to ever grace the mound.

Among the 562 right-handed pitchers Baseball Savant has data on from 2017, only three of them averaged a release point of at least 6.2 feet vertically and 3.3 feet horizontally: Arrieta, Slegers, and Brewers reliever Taylor Jungmann. Jungmann only thew 0.2 innings for Milwaukee last season, so there’s not much to unpack there. Below is the release point chart for Arrieta, courtesy of Baseball Savant:

And here is the chart for Slegers:

And finally, below is a graph showing how Arrieta’s horizontal release point has evolved over his career. You can see the dramatic dip to his first full season with Chicago in 2014. Things leveled out somewhat from there to 2016, but then there’s another noticeable dive last season.

Arrieta’s horizontal release point was farther toward third base than 98.6 percent of right-handed pitchers last year. It’s easy to see why a pitcher would want to create a unique look, as hitters aren’t accustomed to picking up a ball from that point, but how much does that really matter? Well, by the sound of this Francisco Cervelli quote from an MLB.com article in October 2015, I’m guessing it matters a lot.

“What makes him so tough is he throws the ball from the shortstop,” Cervelli said. “He’s supposed to throw straight. It should be illegal.”

Given Arrieta’s struggles, however, you can’t help but wonder if maybe he has taken this too far. He hit a career-high 10 batters and led the league in wild pitches for the second-straight season. Coming into 2017, Arrieta had averaged up just 6.2 H/9 and 0.5 HR/9 as a Cub. Last year, those numbers ballooned to 8.0 H/9 and 1.2 HR/9. His quality of pitch average also dipped from a score of 5.31 over his first three seasons with the Cubs to 4.98 last year.

The free agent market has been slow to get moving, but you’d have to figure things will start to pick up once the calendar turns over to 2018. It’ll be interesting to see if Arrieta’s new team tries to tweak some things with his mechanics. If nothing else, he’s shown a great openness to experiment.

Arrieta used his feet to get his arm into an angle that only a much taller pitcher should be able to achieve. Is it possible another set of eyes could get him pointed back in the right direction in 2018?

Tom Froemming is a contributor at Twins Daily and co-author of the 2018 Minnesota Twins Prospect Handbook.


Alex Cobb Will Be One of the Gems of This Free Agent Class

Of the pitchers hitting the free-agent market this winter, Alex Cobb is not likely to receive the most fanfare.

Aces Yu Darvish and Jake Arrieta will command contracts north of $100 million. Closers Wade Davis and Greg Holland will do their best to secure four-year deals with big price tags. The whole world is watching every development in the Shohei Ohtani saga. Hell, among midmarket starting pitchers, MLB Trade Rumors predicts Lance Lynn to receive a more lucrative contract than Alex Cobb.

Cobb, who broke in as a full-time starter with Tampa Bay in 2012, has historically shown great promise and good-but-not-great results. He averaged 2.5 fWAR from 2012-2014, lost the next two seasons to Tommy John surgery, then came back with a 2.4 fWAR season in 2017. Cobb has never started 30 games in a season, nor has he ever thrown 200 innings. These facts are concerning to some, but I would argue that he is one of the wisest investments one can make this offseason.

Alex Cobb has evolved as a pitcher through pitch selection. Cobb has a great curveball. You either already know that, or you’re about to find out. He also mixes in a four-seam fastball, a splitter, and a sinker. Right now, curveballs are all the rage in baseball, resulting in tremendous success for pitchers like Rich Hill, Trevor Bauer, and Lance McCullers. They throw their curveballs so often that we can consider the breaking ball, not the fastball, to be their primary pitch. Like Hill, Bauer, and McCullers, Cobb has a quality breaking ball, so it stands to reason he should throw it more often and perhaps eschew his mediocre offerings. With Brooks Baseball, we can track the usage rate on each of his pitches throughout the season.

Look at the first couple data points for the usage rates on his pitches, and then compare them to his points at the end of the season. It’s clear that Cobb began to realize he works best by using the fastball and the curveball exclusively, so he increased his usage rate on those pitches and gradually phased out the splitter and sinker.

The question for Cobb is whether this was a good idea. In Cobb’s career, he’s only posted a strikeout-to-walk percentage (K-BB%) above 15% twice, and only ever so slightly so. He’s not bad in that regard, but it’s not where he makes his bread and butter. Fortunately for Cobb, he is one of the better pitchers in the league at inducing ground balls, which we know is favorable contact. The more grounders Cobb induces, the better he gets, and his curveball is a ground-ball machine. Consider the correlation between the rate at which Cobb increased his curveball usage and his ground-ball rate (GB%) throughout the season:

That’s a pretty strong correlation. It seems that Cobb is ready to join the Hills, Bauers, and McCullerses of the world and ride a high breaking-ball-usage rate to breakout success. Of course, it’s never going to be that easy for Cobb or anybody, but let’s go through one of his starts and parse what we can from the good and bad.

On September 4, Cobb pitched against a red-hot Minnesota Twins lineup and had one of his better starts of the season. His first batter of the game was second-half monster and fly-ball connoisseur Brian Dozier, and he managed to get him out on the first pitch.

It’s been proven that batters from the “fly-ball revolution” can be neutralized if you throw them high fastballs. These hitters are swinging up to lift the ball, but it’s difficult to put much lift on a high pitch coming in fast.

We’re going to focus on the curveball throughout this piece, but here is a fun fact about his fastball. Cobb’s heater sits at 92 MPH and had a spin rate of 2101 RPM this season, which seems pretty pedestrian. However, among starting pitchers with at least 100 batted-ball events involving fastballs, Alex Cobb’s has the 31st lowest exit velocity (87.1 MPH). To put this in perspective, that’s a better mark than James Paxton, Chris Sale, Max Scherzer, Jon Gray, Justin Verlander, and Luis Severino.

Cobb was smart to bait Dozier here, and he reaped the benefits with a first-pitch out to begin the ballgame.

In the second inning, we see Cobb pitching out of the stretch and unleashing a curveball that Ehire Adrianza buries into the ground. This will be the common theme today.

I mentioned earlier that Cobb doesn’t have the K-BB% of Chris Sale or Corey Kluber, so every once in awhile he walks batters. The common thought is that Cobb, who throws so many breaking balls, might end up behind in the count thanks to misplaced curves. Then, to get back in the count, he throws his 93 MPH fastball in the zone, which gets crushed by every hitter expecting it.

This would be a bad habit for Cobb to fall into, but he certainly didn’t in 2017. Consider the list of pitchers who threw the most curveballs while behind in the count this season (via Baseball Savant):There’s Cobb, in fifth place, not far behind Rich Hill himself. All five of these guys have great curveballs, so it makes sense for them to Trust the Process™ and continue dropping the hammer rather than submitting to doom and throwing a predictable fastball in the zone.

After walking the leadoff batter to start the third inning, Cobb knew Joe Mauer could make him pay. So rather than giving Mauer the fastball he wanted, Cobb began the at-bat by dropping a curveball for a strike that even froze the great Mauer.

This changed the whole at-bat, because now Mauer didn’t know whether Cobb would be coming at him with the curve or the fastball. Cobb took advantage of his opportunity, used the fastball to get him in an ideal 1-2 count, and then he went back the curveball and got Mauer to ground into a double play.

Cobb is comfortable throwing the curveball both behind in the count and with runners on base, so he can reap the rewards and induce quite a few double plays. That is an asset. Additionally, Cobb is comfortable throwing his curve from both the stretch (as we saw against Adrianza and Mauer) and from his big windup, as you can see here.

Eddie Rosario is a good hitter who made great strides late in the season, but even he found himself to be another ground-ball victim of Cobb’s curveball.

By the fifth inning, Cobb was almost through his second time against the Twins’ batting order. At this point, they weren’t sure whether to expect the curveball or the fastball, so Cobb was often ahead in the count. Here, he has Eduardo Escobar in a 1-2 count and throws a high fastball that Escobar swings right through.

Everyone in the park was expecting Cobb to throw the curveball to finish Escobar off. From a look at Escobar’s swing, it’s safe to say he was expecting a curveball himself. Cobb’s fastball isn’t necessarily anything special, but the way he uses it to pitch off the curveball can be.

With two outs in the inning, Cobb faced his 18th batter (which would complete his second time through against the opposing batting order). He quickly got Ehire Adrianza into an 0-2 count and then unleashed his best curveball of the night, which Adrianza pounded into the ground for another easy out.

At this point, Cobb had gone through the opposing order twice, pitched five innings, and only given up one run. Teams around the league are beginning to realize that most of their starters simply shouldn’t go out for the third time through the order, even if they are rolling. The Houston Astros just rode using Lance McCullers, Brad Peacock, and Charlie Morton in tandems all the way to the World Series. Those three guys are valuable pieces, and if Cobb is utilized liked this, so is he.

Unfortunately for Cobb, his pitch count was at 85, so his manager decided to bring him out for another inning. The Twins got their third look at Cobb, and I don’t need to cite the statistics to you about what happens at this point. Hitters are smart, so they can pick up on the tendencies of a pitcher if they see him so many times. Alex Cobb, as great at he was through five innings and two times through the order, is no exception to this rule.

Here is Joe Mauer taking an 0-2 curveball from Cobb and driving it into the gap in center for a double.

The important question here is, “was that Cobb’s fault or just a good piece of hitting from Joe Mauer?” Of course, the answer in baseball is always going to be both, but you can see in the embedded GIF that Cobb doesn’t necessarily leave the pitch up. In fact, if you compare it to the curveball that Cobb threw earlier in the game to get Mauer to ground into a double play, it doesn’t look much different — maybe an inch or two higher, at worst. The bigger change is Mauer, who swings like a guy fighting to stay alive in the first GIF, then like he knew exactly what was coming and how to handle it in the second.

This is the “third time through the order” effect in a microcosm. Pitches that fool batters earlier in the game become cookies, so the key is to relieve your pitcher while his pitches still fool the batters. Cobb should not be penalized by us for giving up a double to Mauer there; in 2018, analytical teams will be bringing in a new pitcher in these situations.

In this sense, Cobb is the first free-agent test case for the newest pitching trend in the industry — the tandem starter — one who pitches twice through the order, hopefully gets 15-18 outs, and then gives way to someone else. The Mets, who hired progressive Indians pitching coach Mickey Callaway to be their new manager, have made it clear that all starters not named deGrom or Syndergaard will be shielded from facing lineups more than twice in a game. Baseball has never experienced a shortage of five-inning pitchers in its history, but these changes in pitcher usage are leading to new premiums for these specialists.

It’s as simple as this: every team wants to stock their pitching staff with Alex Cobbs. To be clear, every team wants a Justin Verlander, but there is only one Justin Verlander; even horses Chris Sale and Corey Kluber showed significant wear and tear in October. To combat this dilemma, the Houston Astros deployed Lance McCullers, Brad Peacock, and Charlie Morton in five-inning tandems and rode them all the way to the last out of Game 7.

I expect Alex Cobb will fit into this role quite nicely for whichever team he signs with.


Anthony Rizzo Has Changed, Man

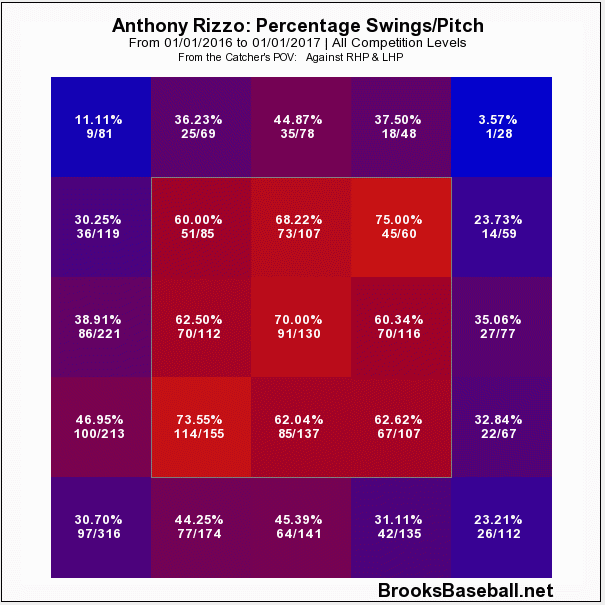
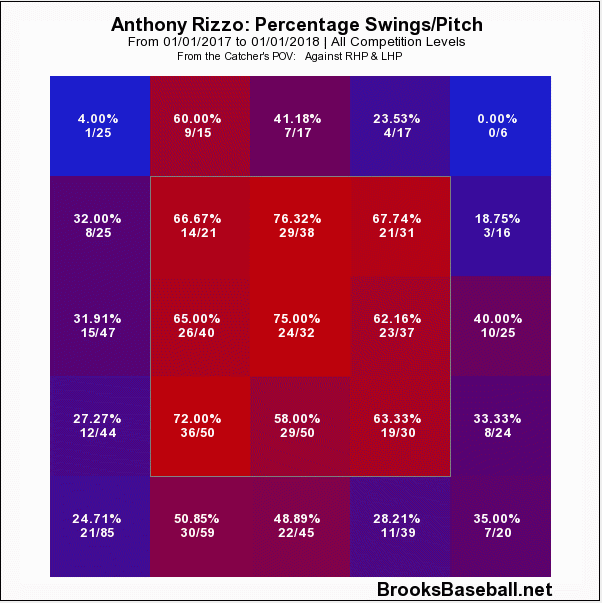
For the last three years, Anthony Rizzo has been one of the most consistent hitters in baseball. His wRC+ from 2014-2016: 155, 145, 145. His wOBA: .397, .384, .391. He consistently draws a walk in about 11% of his plate appearances and strikes out in less than 20% of his plate appearances. So far this year? It has been a much slower start, as he’s slashing .231/.371/.448. Though the OBP and SLG aren’t bad, the batting average is tougher to stomach. He’s been just above average with a wRC+ of 114, hardly the numbers the Cubs were expecting from their perennial All-Star. Still, there’s some explanation for all this. For comparison’s sake, we will only be looking at 2016 and 2017. Here’s some charts from Brooks Baseball:

There isn’t an obvious change in approach. He’s swinging at about the same amount of pitches and really is staying inside the zone. In 2017 it seems like he’s swinging more at the low and in pitches but otherwise, same approach. The stats from Baseball Info Solutions and PITCHf/x back this up. He’s in line with his career swing% by both metrics; the difference is in the contact he’s making. By Baseball Info, his O-Contact% is 71.1% up from 68.1%. PITCHf/x also has him at 71.1% up from 66.1%.

This makes me think the quality of the contact is the issue. Here are two videos showing at bats in 2017 and 2016. The focus here is what Rizzo is doing with outside pitches. First 2016, then 2017:

https://baseballsavant.mlb.com/videos?video_id=730449083

https://baseballsavant.mlb.com/videos?video_id=1383639883

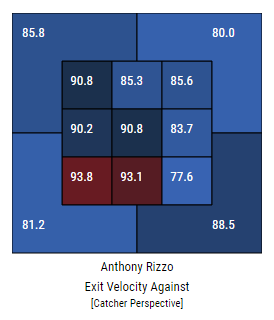
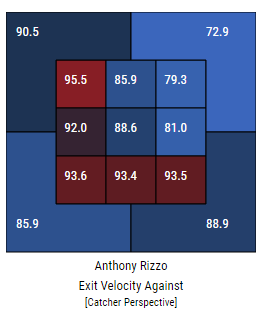
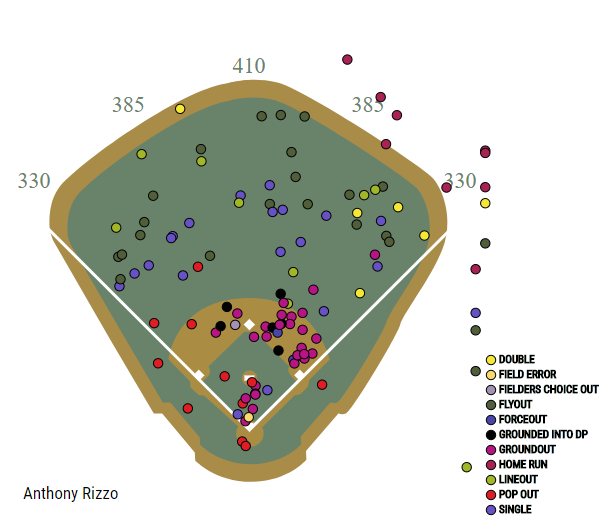
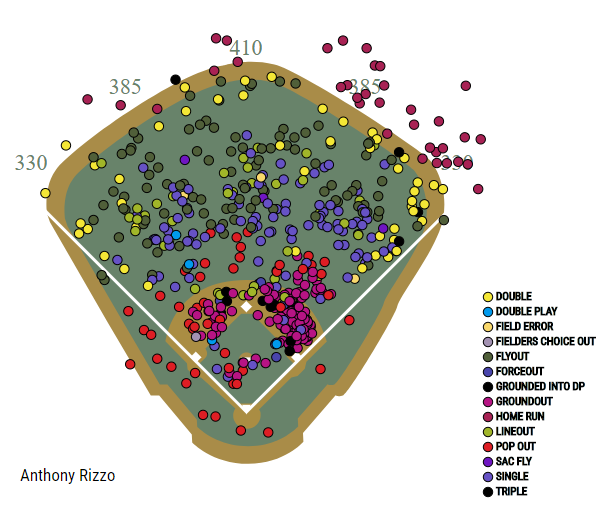
In 2016, Rizzo lets that outside pitch get deep to poke it to left field. The 2017 version is early and rolls it over into a shift. Baseball Savant has limited video for 2017 but I’ve seen the same thing and the numbers back it up. Here are two charts showing his exit velocities, 2016 is on the bottom, 2017 is on the top.


It would be easy to say Rizzo needs to do a better job going the other way with the outside pitch, but that’s the main difference I’m seeing this year. Overall, Rizzo’s hard contact is down to 30.4% from last year’s 34.3%, and from his career rate. His pull rate is also the highest in his career, at 53%, vs. 43.9%. Rizzo has been pulling a decent amount of grounders, specifically at a rate of 68.1% with about 78.2% being characterized as soft or medium contact, higher than in 2016. Rizzo faces a shift quite a bit, so pulling grounders isn’t going to help him. He’s hitting line drives at the lowest rate since he was first called up, and down to 15% from his career 20% rate. Take a look at the spray charts below. The first chart is 2017 and the second is 2016. It’s the classic small sample vs. large sample but you can definitely see that Rizzo is not using all fields like he has in the past.


This what confounds me. Despite all this, he still is producing better than average, because his walk rate and strikeout rate are the best rates of his career. So just imagine if his BABIP currently wasn’t .212? I don’t want to say that’s going to raise for sure, but I believe it will get closer to his career rate of .285. This is probably a long-winded way of saying small sample size, so here’s one last thing. This has happened with Rizzo before. In 2016 he had a similar start in March through May, but turned it on for the rest of the year.

Still, this isn’t a simple “It’s been 50 games and he’s been unlucky” that would imply that he’s the same player doing the same things but getting different results. The concern I have is that Rizzo’s doing things differently this year. He’s not using all fields, and he’s hurting his performance by trying to pull pitches and generating weaker contact (his EV is down this year). Using all fields might lead to more line drives and would drive his batting average up to his career norms. Maybe he’s putting pressure on himself after last year’s championship? He’s had success before and I believe he can get back to where he was.


Measuring Offensive Efficiency

Runs Created was one the first sabermetric statistics I took it upon myself to learn about.  After all, it was one of the first statistics developed by Bill James himself.  I am also pretty sure RC is the formula written on a whiteboard in Moneyball (the most influential Brad Pitt movie I have ever seen).  Anyways, Runs Created is not discussed much because there are other, more sophisticated alternatives – wRC, wRC+, etc.  I still appreciate RC because of its simplicity, and it is can still be used as an effective tool for measuring the efficiency of offensive production.

That is precisely what I set out to do.  The question I sought to answer with this study is, “which teams were the most efficient in scoring runs?”  A pretty basic question — which I decided to complicate.  Using team statistics from last year, I calculated the Runs Created for each team’s offense.  The largest separation between Runs Created and actual runs scored came from the San Diego Padres, who scored 686 times, despite “creating” only 621.38 runs.

While ranking in 19th in total runs, the Padres were actually incredibly efficient. I discovered this after trying to develop a way to measure offensive efficiency.  To do so, I created the Runs Conversion Rate (RCR).  While relatively rudimentary, this ratio between runs scored and Runs Created provides, in my mind, a good measurement for the efficiency of offenses.

Run Conversion Rate = Runs Scored / Runs Created

The purpose of this, again, is to gauge the overall efficiency of offenses.  All I really did was give a fancy name to the margin of error of Runs Created.  However, what I sought to do was use this statistic in a different way — to examine which teams made the most of what they produced (efficiency), and which did not.  Think of this article as a new way of looking at an old statistic, not me trying “discover” a new stat.  Below is a table, sorted by runs scored (i.e. from most productive offenses to least productive).  Green values represent teams in the top 10 of a category, and red the bottom 10.

2016 Run Conversion Rates
TEAM Runs Created Runs Scored Run Conversion Rate
Red Sox 905.26 878 0.970
Rockies 856.84 845 0.986
Cubs 790.93 808 1.022
Cardinals 784.92 779 0.992
Indians 770.06 777 1.009
Mariners 769.39 768 0.998
Rangers 755.83 765 1.012
Nationals 752.18 763 1.014
Blue Jays 759.72 759 0.999
D-Backs 775.15 752 0.970
Tigers 791.98 750 0.947
Orioles 768.79 744 0.968
Pirates 724.74 729 1.006
Dodgers 709.32 725 1.022
Astros 727.58 724 0.995
Angels 700.20 717 1.024
Giants 725.10 715 0.986
Twins 742.03 690 0.930
Padres 621.38 686 1.104
White Sox 713.38 686 0.962
Reds 699.02 678 0.970
Royals 685.69 675 0.984
Rays 701.08 672 0.959
Brewers 694.02 671 0.967
Mets 707.39 671 0.949
Marlins 695.80 655 0.941
Athletics 655.47 653 0.996
Braves 671.35 649 0.967
Yankees 690.17 647 0.937
Phillies 617.22 610 0.988

After looking at the table, I noted a few observations to be made: teams ranked top 10 in scoring and top 10 RCR last year were, for the most part, the best teams in the league, the two highest-scoring teams did not score as many runs as they could have, and some teams capped out their production, albeit not a high level of scoring.

First, let’s look at the teams who ranked top 10 in scoring and top 10 in RCR in 2016: the World Champion Chicago Cubs, the American League Champion Cleveland Indians, the Seattle Mariners (second in AL West), the Texas Rangers (AL West Champs), the Washington Nationals (NL East Champs), and the Toronto Blue Jays (AL Wild Card).  All these teams were both productive and efficient.  Both are key indicators of good ball clubs.  They created an equal balance of the two, and, outside of the Mariners, played postseason baseball.

While the last paragraph was basically a no-brainer, this is where the study got interesting.  The Boston Red Sox scored 878 runs last year — short of their roughly 905 “created” runs.  According to their RCR, they were only 97% efficient.  So, what does this mean? The Red Sox, while more productive than anyone else, did not hit their ceiling.  They came close (RCR of 0.970), but still only ranked in the middle third of offensive efficiency.  What if the post-Ortiz Red Sox put up around the same numbers they did last year, but became more efficient in doing so?  In my opinion, the AL East should be scared.  Other teams falling into the top 10 scoring, middle 10 RCR category are the Colorado Rockies, St. Louis Cardinals, and Arizona Diamondbacks.  The Rockies certainly receive a boost in production because they played 81 games in Coors Field.  The Cardinals and Diamondbacks, like the Red Sox, scored often, but not as often as they could have.  So maybe their problem is not a low ceiling, but rather getting away from their floor troubles them.

Our third group of relatively important teams in this study are those who ranked in the middle 10 in scoring and top 10 in RCR: the Pittsburgh Pirates, Los Angeles Dodgers, the Los Angeles Angels, and the San Diego Padres.  Essentially, these offenses were middle of the road in terms of productivity, but scored as many runs as possible given their level of production.  The Angels, ranked in the bottom 10 in Runs Created by their offense in 2016, but were second in RCR, scoring 2.4% more runs than they “created.”  The only team ahead them were the lowly San Diego Padres, who turned in 10.4% more runs.  The Dodgers, who won 91 games in a comparatively weak NL West division, were middle-of-the-road in terms of offensive production, and came in third in terms of RCR.  These teams were ruthlessly efficient, milking the most out of what their offense provided.

I do not know what qualities are common in high-RCR teams.  Maybe a high average with runners in position, a low number of runners left on base, or maybe just plain luck.  That could be the topic of an entirely different study, perhaps.

To sum things up, a high RCR was a common denominator in the teams who saw great success in 2016, and I would like to think it is useful in measuring the efficiency of teams’ offenses.  It will be exciting to see who will rise in 2017 as the most potent offense.  For me, it will be just as exciting to see who is the most efficient.


FanGraphs and Baseball-Reference.com were instrumental in the production of this article.  Theodore Hooper is an undergraduate student at the University of Tennessee in Knoxville.  He can be found on LinkedIn at https://www.linkedin.com/in/theodore-hooper/ or on Twitter at @_superhooper_


Should the Best Team Win Each Year?

The Cubs won the 2016 World Series. Though that hopefully isn’t news to anyone, it is still interesting for a variety of reasons. Notably, it was the Cubs’ first World Championship since 1908. I have nothing new or interesting to add to the conversation about the Cubs’ accomplishment. The reason I want to talk about the Cubs now is because not only are they World Champions, they were also clearly the best team in the MLB this year.

Most fans recognize that those two statements are saying vastly different things. The Cubs won more games in 2016 than any other team, had the greatest run differential and had the highest team WAR total, so it is fairly safe to say that they were, in fact, the best team in 2016. But in 21 seasons from 1995-2015 (wild-card era) the team with the best regular-season record (or tied) has only won the World Series four times: the Red Sox in 2007 and 2013 and the Yankees in 1998 and 2009. That’s a 19% success rate. Also since 1995 only three teams that have led the major leagues in team WAR have won the World Series: again the 2007 Red Sox and 2009 Yankees, and also the 2010 Giants. That’s 14%. So that raises the question: is this a problem? Should the World Series champion more frequently be the best regular-season team? Should MLB change things to fix this problem?

Read the rest of this entry »


Did the Cubs and Giants Have the Best Pitcher-Hitting Series Ever?

With a wild comeback in Game 4 on Tuesday night, the Cubs secured their spot in the NLCS for the second straight season. Considering where the team was just five years ago, this is obviously an impressive achievement. But maybe more impressive is how they reached that second consecutive NLCS. The Cubs scored 17 runs against the Giants in their NLDS showdown, and six of those were driven in by their pitchers! That’s an absurd 35% of the Cubs’ run output coming from the guys who usually do the run prevention.

When Travis Wood hit his incredible home run as a relief pitcher in Game 2, it was the first postseason home run from a pitcher since Joe Blanton took Edwin Jackson deep in Game 4 of the 2008 World Series, and the first postseason home run from a reliever since 1924.

When Jake Arrieta left the yard in the first inning of the very next game, it became the first postseason series with multiple home runs off the bats of pitchers since the 1968 World Series, when Mickey Lolich and Bob Gibson each went deep in a seven-game series. Of course, Lolich and Gibson were rivals, not teammates, making the Wood-Arrieta accomplishment even more impressive — and rare. In fact, it was only the second time in the history of baseball (per Baseball-Reference Play Index) that two pitchers, on the same team, hit home runs in the same series. The only other time with in the 1924 World Series, when New York Giant teammates, and pitchers, Jack Bentley and Rosy Ryan homered in Games 3 and 5 of the epic seven-game series. Wood and Arrieta were the only ones to do so in back-to-back games.

* * *

Now, it wasn’t just the Cubs pitchers getting in on the fun. For a while Tuesday night, it looked as though Giants starter, Matt Moore, was going to be a two-fold hero. Shutting down the Cubs offense from the mound, and knocking in the first run of the game for the Giants in the bottom of the fourth. While that was the only hit from Giants pitchers in the series, it was still enough to set the combined hitting totals for the two teams to: .250 batting average, with a .625 slugging percentage, while knocking in 23 percent of the total runs scored.

Those are some pretty crazy totals, but are they the best ever?

Using the aforementioned Play Index search of all-time postseason home runs from pitchers, there are 18 different series (including the 2016 NLDS) in which a pitcher homered. In those series, on three occasions, the pitcher who hit the home run was the only pitcher to get a hit in the entire series (1984 Rick Sutcliffe, 1978 Steve Carlton, 1975 Don Gullet). Only twice did pitchers combine for more than the 10 total bases from the Giants and Cubs, and only once did they drive in more than the seven runs (and they never topped the percent of runs driven in). Let’s go to the chart:

Top Team Pitcher Performances in the Playoffs

Year Hits AB BA TB SLG RBI Series runs % of RBI
2016 NLDS 4 16 0.250 10 0.625 7 30 23.33
2008 WS 2 13 0.154 5 0.385 1 39 2.56
2006 NLCS 2 25 0.080 5 0.200 1 55 1.82
2003 NLCS 3 28 0.107 6 0.214 3 82 3.66
1984 NLCS 4 17 0.235 7 0.412 1 48 2.08
1978 NLCS 2 17 0.118 5 0.294 4 38 10.53
1975 NLCS 2 12 0.167 5 0.417 3 26 11.54
1974 WS 4 20 0.200 8 0.400 1 27 3.70
1970 WS 2 25 0.080 5 0.200 4 53 7.55
1970 ALCS 5 18 0.278 10 0.556 6 37 16.22
1969 WS 5 26 0.192 10 0.385 5 24 20.83
1968 WS 5 36 0.139 11 0.306 4 63 6.35
1967 WS 2 30 0.067 8 0.267 2 46 4.35
1965 WS 5 32 0.156 9 0.281 6 44 13.64
1958 WS 7 37 0.189 10 0.270 8 54 14.81
1940 WS 3 39 0.077 7 0.179 2 50 4.00
1926 WS 4 39 0.103 8 0.205 2 52 3.85
1924 WS 8 42 0.190 14 0.333 5 53 9.43
1920 WS 6 39 0.154 9 0.231 3 29 10.34

After a brief peruse, it’s clear that there are only a few cases in which the pitchers in a series can even come close to what we just saw. Let’s take a look at the five best, in ascending order:

1968 World Series

This was one of the three series before the 2016 NLDS in which multiple pitchers hit home runs. In 1968, it was, as noted above, Bob Gibson and Mickey Lolich who homered in the series, one each for the Cardinals and Tigers. The reason this series is in fifth in the challengers to Cubs-Giants is because those two pitchers were really it. They drove in the only four runs from pitchers in the series (three of the four RBI coming on the two home-run swings), and there was only hit to hit come from a non-Gibson/Lolich pitcher.

1969 World Series

Just a year after our first entry into this challenge, the Mets and Orioles played in the first World Series to be led off with a League Championship Series. The extra-long season didn’t stop the Mets and Orioles pitchers from contributing all over the diamond, however, as they crammed five hits, 10 total bases, and five RBI into just a five-game series. Because of the abbreviated length of the series, this is one of the few series that can challenge the 2016 NLDS in terms of percentages. That being said, the Cubs-Giants pitchers take all three percentage categories, leaving there no real room for debate on this one.

1958 World Series

The 1958 series stands out in that it was the highest RBI total for pitchers in any postseason series to date. That was thanks in large part to top two pitchers for the Braves, Warren Spahn and Lew Burdette, tallying three RBI apiece. Burdette did it with the long ball, while Spahn preferred the death-by-a-thousand-cuts method, tallying his three RBI on four hits in the series. The Yankees got two RBI of their own from Bob Turley, but I’m not quite willing to give these guys the edge over the Cubs-Giants pitchers. The easiest argument for this year’s NLDS is that the Cubs-Giants pitchers tallied as many total bases and only one less RBI in three fewer games, as the 1958 World Series went to seven games, while this year’s NLDS went just four games.

1924 World Series

Here’s where the challenge gets real stiff. The 1924 World Series is the other series in which we have two home runs from pitchers, the aforementioned Bentley and Ryan teammates for the Giants. This series tops our charts in hits (8) and total bases (14), and is a reasonable choice for best-hitting series from a group of pitchers. I’m still giving the edge to Cubs-Giants in this showdown, though, and for a couple of reasons. Actually, really one reason with a couple different explanations: opportunity. Similar to the 1958 World Series, the 1924 World Series went to seven games, meaning that pitchers had far more games to rack up those hits and total bases. Pitchers were also left in games far longer in the 1920s, and as such, tallied almost three times as many at bats as the 2016 NLDS pitchers. When comparing batting average (.250 to .190) and, even more so, slugging percentage (.625 to .333) it becomes clear that this year’s Cubs-Giants pitchers still reign supreme.

1970 ALCS

Here’s our winner. The only series that I believe tops the recently concluded Cubs-Giants NLDS in terms of output from pitchers at the plate. This was an even shorter series than Cubs-Giants, as the Orioles only needed three games to dispatch the Twins. And their pitchers were a good chunk of the reason why. The Orioles used just four pitchers in the series, but all four got hits, combining for all of the offense you see above. (Twins pitchers were 0-for-5 in the series.) Not only did all four get hits, but all three starters got extra-base hits, as Dave McNally, Jim Palmer, and Mike Cuellar (Dick Hall was the reliever) all showed what they were capable of on the other side of the ball. Of course, the very next season, these three starters, along with Pat Dobson, would form just the second-ever set of four 20-game winners on the same team, proving just how awesome the late `60s and early `70s Orioles really were. They reign supreme for now, but let’s see how those Cubs starting pitchers do for the rest of the 2016 playoffs.


Kris Bryant Continues to Hit

Ever since he was taken with the second pick in the 2013 draft, the spotlight has continually followed Kris Bryant. After mashing his way through the minors in less than two years, Bryant had a spectacular rookie season with a slash line of .275/.369/.488 with 26 homers and a 136 wRC+. Deservedly, he was rewarded with the NL Rookie of the Year award. Although he did strike out over 30 percent of the time, he showed great plate discipline along with immense power. His 6.5 WAR ranked 10th among major league hitters. However, this year he has taken his production a step further.

With his league-leading 25 home runs to go along with his slash line of .278/.370/.578, one major change sticks out. Although his average and on-base percentage remain around the same as his 2015 totals, his slugging percentage has taken a huge jump. Halfway through the season, he is one home run shy of last year’s total and around half of his hits have gone for extra bases (44 out of 87). He’s also cut down on his strikeouts while making even more hard contact than he did last year — shown by his 42% hard-hit rate which will allow him to continue to tap into his power.

One noticeable change sticks out in his batted-ball profile. Although his ground-ball, line-drive, and fly-ball rates remain relatively constant, Bryant has pulled the ball more in his second big-league season. This has caused more of his fly balls to leave the park. Taking a look at his 2016 home-run spray chart, you can see that all of his home runs have been pulled.

bryant-2016

Source: FanGraphs
Next take a look at his 2015 home-run spray chart.

bryant-2015

Source: FanGraphs
Most of his home runs have been in the same general area with the exception of a few opposite-field home runs to right. Since he has been pulling the ball with more authority in 2016, the balls that he pulls in this sweet spot to left will allow him to continue to leave the yard at a ridiculous rate. With his picturesque swing to go along with his strong hands and 6-foot-5, 230-pound frame, swings like this

Kris Bryant Homer

…will continue to be common for Cubs fans to see from Kris Bryant.

However, it would be foolish to simply call Bryant a home-run hitter when in fact what makes him so special is his all-around hitting ability to go with this insane power. He walks, hits the ball hard, and his only flaw is his propensity to strike out — and even that he has improved upon this year. A two-time All Star already with 4.3 WAR this season, he ranks fourth among major-league hitters and first among NL hitters in WAR while also possessing a 149 wRC+. At this point, if the NL MVP is going to go to a player not named Clayton Kershaw, Kris Bryant deserves to be the one holding up the trophy. But the trophy most important to him is the one won at the end of October. With the Cubs holding a comfortable lead atop the NL Central, Bryant looks destined to lead them on a deep playoff run with the hope of finally shattering their 108-year-old curse.


What Can We Expect From Kris Bryant Next Year?

We’ve come to the end of the 2015 regular season and it’s time to start looking towards the playoffs. As with every year there have been surprises and disappointments. One of the most anticipated events of each season is the debut of rookies and how they will perform throughout the year. Big things were expected from Kris Bryant this year and he definitely did not disappoint. Originally drafted by the Blue Jays in 2010 in the 18th round (546th overall), he was committed to the University of San Diego and the Jays didn’t offer enough to sway him. In 2013, the Cubs drafted him 2nd overall and he did nothing but climb the ranks until he made his MLB debut on April 17, 2015. His first game didn’t go as well as he hoped, going 0-4 with 3 K’s, but debuts mean nothing except for a little extra media hoopla. He cruised the rest of the way through the season on his way to one of the most impressive rookie seasons in recent memory, posting the 3rd highest WAR of any rookie since 2001. Only Mike Trout (10.3 WAR in 2012) and Albert Pujols (7.2 WAR in 2001) posted higher better WARs in their rookie campaigns.

I was looking over Bryant’s stats and his K% really jumped out at me. Although Bryant hit 26 home runs on the year, I began to wonder if there were any comparable seasons. Now the only criteria I used for comparison was: (1) as many or more home runs (26) and (2) equal or greater K%. Only 13 other players met this criteria since 2001 and they are listed in the table below.

Name Year G PA HR RBI AVG OBP K% BB% WAR
Kris Bryant 2015 151 650 26 99 0.275 0.369 30.6 11.8 6.5
Chris Davis 2015 157 656 45 112 0.258 0.355 31.4 12.3 4.9
Chris Carter 2014 145 572 37 88 0.227 0.308 31.8 9.8 1.8
Chris Davis 2014 127 525 26 72 0.196 0.300 33.0 11.4 0.8
Chris Carter 2013 148 585 29 82 0.223 0.320 36.2 12.0 0.5
Adam Dunn 2013 149 607 34 86 0.219 0.320 31.1 12.5 0.3
Pedro Alvarez 2012 149 586 30 85 0.244 0.317 30.7 9.7 2.2
Adam Dunn 2012 151 649 41 96 0.204 0.333 34.2 16.2 2.0
Mark Reynolds 2011 155 620 37 86 0.221 0.323 31.6 12.1 0.1
Adam Dunn 2010 158 648 38 103 0.260 0.356 30.7 11.9 3.0
Mark Reynolds 2010 145 596 32 85 0.198 0.320 35.4 13.9 1.7
Mark Reynolds 2009 155 662 44 102 0.260 0.349 33.7 11.5 3.3
Mark Reynolds 2008 152 613 28 97 0.239 0.320 33.3 10.4 1.3
Ryan Howard 2007 144 648 47 136 0.268 0.392 30.7 16.5 3.1

Besides an awfully high K%, for which he ranks 23rd overall since 2001, out of all the players on this list, he posted the most impressive WAR. He’s also in some pretty elite company with respect to power hitters. There are four 40+ home run seasons on that list and many 30+ homer seasons. In addition to providing value with his bat, he also provided a positive UZR rating at a highly demanding defensive position. This combination is what made Kris Bryant so attractive to teams since the 2010 draft.

Using the same player list as above, I looked at their seasonal BABIPs, and I found one particular season of interest. Bryant’s 2015 season. Bryant posted a 0.381 BABIP this year, and the next-closest player on the list was Mark Reynold’s 2009 season at 0.338 which is still quite a difference. Looking at Mark Reynold’s seasonal stats from 2008 to 2011, his batting average follows the same pattern as his BABIP.

Name Year BABIP
Kris Bryant 2015 0.381
Chris Davis 2015 0.315
Chris Carter 2014 0.267
Chris Davis 2014 0.242
Chris Carter 2013 0.311
Adam Dunn 2013 0.266
Pedro Alvarez 2012 0.308
Adam Dunn 2012 0.246
Mark Reynolds 2011 0.266
Adam Dunn 2010 0.329
Mark Reynolds 2010 0.257
Mark Reynolds 2009 0.338
Mark Reynolds 2008 0.323
Ryan Howard 2007 0.328

And a plot showing the relationship between AVG and BABIP (data from 2001 to 2015). There is an increasing relationship between the two, but there is some pretty wide variation. Nonetheless, I’ve highlighted Bryant’s data point from the 2015 season in red and it’s pretty clear that it represents an outlier for his batting average.

If we consider that the players listed in the tables above are from the same pedigree, their career BABIPs average out to around 0.298. Now I’m not saying Kris Bryant is going to follow the same trend, but based on the strikeout rate he posted this year he’s very aggressive at the plate and I know we are going to expect that inflated BABIP to come back down to Earth so I think we can expect some regression next year. As a reference Danny Santana posted a BABIP of 0.405 in 2014 only to drop down to 0.290 this year which saw his WAR plummet from 3.3 to -1.4. I looked at the relationship between HR, SB and a few other stats and batting average showed the highest correlation with BABIP from the stats I looked at. Based on this I expect his batting average will be the most likely to be affected with a downfall of BABIP. I really don’t think the home runs are going to go anywhere, but I think we can likely expect to watch that batting average fall. It remains to be seen how this will affect his peripheral stats, but as long as he continues providing solid defense at the hot corner he is going to provide lots of value on a major-league roster. I’m sorry to say Cubs fans I think you should expect some offensive woes next year.


A Quick and Dirty Attempt to Find Justin Upton’s Trade Value

Players like Justin Upton aren’t usually available at the trade deadline. Upton ranks 35th in wOBA (.353) and 47th in WAR (8.9) between 2013 to the present.  Also of note, Upton is in his walk year.

So, how many players like Justin Upton have been traded in the past 10 years? I did a quick scan of deals made in June and July since 2005 and I found four similar players who were traded in their walk years.

1. Hunter Pence PHI->SF, 2012 (68th wOBA (.347) and 68th WAR (8.7), 2010-2012)

2. Carlos Beltran NYM->SF, 2011 (19th wOBA (.379) and 74th WAR (8.1), 2009-2011)

3. Matt Holiday OAK->STL, 2009 (4th wOBA (.410) and 6th WAR (18.2), 2007-2009)

4. Mark Teixiera ATL -> LAA (15th wOBA (.396), 17th WAR (14.8), 2006-2008)

The Mets received Zack Wheeler in return for Beltran and the Athletics received Brett Wallace in return for Holliday. Baseball America ranked Wheeler the 55th best prospect pre-2011 and Wallace was ranked 40th pre-2009. In the following years, pre-2012 and pre-2010, respectively, Wheeler was ranked 35th and Wallace was ranked 27th.

The Mets and Athletics did well in each trade. They received top prospects and non-deteriorating prospects (they were not losing value as prospects during the year they were traded for). This is evidenced by the ranking of Wheeler and Wallace in the season following the trade.

The Pence and Teixiera trades did not net the Phillies or Braves prospects. Each team received a major league asset, using “asset” in the loosest of ways.

The Phillies received Nate Schierholtz, who had totaled .9 WAR up to that point in 2012. They also received Seth Rosin, an A Ball pitcher, and Tommy Joseph, a AA catcher. Essentially, they received a replacement level player and organizational depth. 

The Braves received Casey Kotchman. Kotchman had totaled 2.1 WAR in 2008 with the Angels before the trade. He managed 3.7 WAR the year before. The Braves could not expect Kotchman to live up to his past billing (he was Baseball America’s 6th ranked prospect pre-2005), however, from the most optimistic perspective, they may have expected him to be worth 2 WAR per year over the remaining four years of team control. At least this is my best attempt to get in the head of the Braves’ front office seven years after the fact.

Now, I’ll attempt to determine Justin Upton’s trade value based upon these past trades.

Kevin Creagh and Steve DiMiceli published a study on Point of Pittsburgh that analyzed the value and future performance of prospects based on their ranking in the Baseball America’s Top 100 (the ranking was determined by the final appearance of the prospect in the rankings).  The article has a lot of information you should read regarding the dollar value of prospects and their potential to bust, but for purposes of this article, I am concerned with a prospect’s projected WAR over the six years of team control.

Hitters that rank between #26-50, which is Brett Wallace, project to have an average of 6.8 WAR. Pitchers ranked between #51-75 project to have 3.8 WAR. However, based on Wheeler’s fast rise up Baseball America’s list, I’ll factor in that pitchers ranked between #26-50 project to have 6.3 WAR. The average of the two is 5 WAR, which is the value I’ll place on Wheeler at the time the Mets traded for him.

Justin Upton is not Matt Holliday, circa 2009, and he is not quite Carlos Beltran, circa 2011, although he is much less of an injury risk than 2011 Beltran (who would go on to spend time on the DL for the Giants in 2011). Therefore, I project that the Padres should receive between 3.8-5.0 WAR in return for Upton. The return should scale up towards the higher side of that projection based upon an active and interested market for Upton.

Below is a list of potential Upton suitors and their prospects that appeared in Baseball America’s Top-100 rankings before the season began. The rank of the prospect is in parenthesis, followed by their Creagh and DiMiceli projected WAR. The prospects in bold represent the most likely return for Upton, however I included some prospects that are possibilities, but project to have more WAR value than should be expected in return for Upton.

Mets – Brandon Nimmo (45, 6.3), Dilson Herrera (46, 6.3), Amed Rosario (98, 4.1). I excluded Kevin Plawecki (63) and Michael Conforto (80) due to their major league role and rise to prominence, respectively. 

Pirates – Jameson Taillon (29, 6.3); Austin Meadows (41, 6.8); Josh Bell (64, 5); Reese McGuire (97, 4.1)

Cubs – C. J. Edwards (38, 6.3); Billy McKinney (83, 4.1)

Giants – Andrew Susac (88, 4.1)

Orioles – Dylan Bundy (48, 6.3); Hunter Harvey (68, 3.4)

Rays – Daniel Robertson (66, 5); Willy Adames (84, 4.1)

Royals – Raul Mondesi (28, 6.8), Brandon Finnegan (55, 3.4), Kyle Zimmer (75, 3.4), Sean Manaea (81, 3.5)

Twins – Jose Berrios (36, 6.3); Nick Gordon (61, 5); Alex Meyer (62, 3.4)

Astros – Mark Appel (31, 6.3)

A.J. Preller should feel (somewhat) vindicated regarding the Justin Upton portion of his winter experiment if he can get a player he likes that resembles the players on this list. However, it remains to be seen if he will chase after something safer, like the Braves in 2008, or squander an asset like the Phillies in 2012. In that case, he’s probably better off going all-in on the Padres he built for 2015.