Archive for Chicago Cubs

Different Aging Curves For Different Strikeout Profiles

What follows will look at aging curves as they relate to players with specific strikeout profiles. Specifically, we will look at how wOBA ages for players that strikeout more than the league-average strikeout rate and less than the league-average strikeout rate.

Through the research that is presented in this post, two points will be proven:

  1. Players of different strikeout profiles age—their wOBAs change—at different rates.
  2. The aging curve for players of different strikeout profiles has changed over time.

Before I present the methodology, the research that was conducted, and their conclusions, I want to give a big thank you to Jeff Zimmerman, who has not only done a lot of research around aging curves, but has also helped me throughout this process and pushed me in the right direction several times when I was stuck. Thank you.

Population

In order to give a non insignificant amount of time for a player’s wOBA to stabilize, but not place the playing time threshold for plate appearances so high that we artificially limit the population even more than it naturally is at the ends of the age spectrum, I looked at all player season from 1950 to 2014 where a player had a minimum of 600 plate appearances for the first aging curve in this post. The second aging curve in this post looks at all player seasons from 1990 to 2014 with a minimum of 600 plate appearances.

Now that we have our population, we need to split our population into two groups: players that strikeout more than league average and players that strikeout less than league average.

Because the league average strikeout rate of today is very different than it was 65 years ago, we can’t look at a player’s strikeout rate from 1950 and compare it to the league average strikeout rate of today.

In order to divide the population into two groups, I created a stat that weighs a player’s strikeout rate against the league average strikeout rate for the years that they played. For example, if a player played from 1970 to 1975, their adjusted strikeout rate would reflect how their strikeout rate compares to the league average strikeout rate from 1970 to 1975.

Players were then placed into two buckets based on their adjusted strikeout rate: players that struck out more than league average and players that struck out less than league average.

Methodology

There has been a lot of discussion over the years about the correct methodology to use for aging curves. This conversation has had altruistic intentions in the sense that it’s aim has been to minimize the survivorship bias that is inherent in the process, and, through the progress that has been made over the years, this study uses what the author has found to his knowledge to be the best technique to date. This article by Mitchell Lichtman summarizes a lot of the opinions.

While there is a survivorship bias inherent in any aging curve, the purpose of the different techniques used to create aging curves is to minimize the survivorship bias wherever possible.

What We Don’t Want In an Aging Curve 

An aging curve is not the average of all performances by players of specific ages. For example, say you have a group of 30-year-old players that have an average of a .320 wOBA and group of 29-year-old players that have an average of a .300 wOBA.

The point of an aging curve is to see how a player aged, not how they played. The group of 30-year-old players has a high wOBA because they are a talented group of players; they lasted long enough to play until they are 30. As they aged from the previous year, when they were 29 to their current age 30 season, they lost the bottom portion of players from their player pool. These are the players that couldn’t hang on any longer, whether it be because of a decline in defense, offense, or a combination of both. This bottom portion of players lower the wOBA of the current 29-year-old population through their presence and raise the wOBA of the 30-year-old population through their absence.

At the same time, the current 30-year-olds aged from their age-29 season to their age-30 season. Sure, there may be players who had a better age-30 season than age-29 season, but the current group of 30-year-olds, as a whole, still played worse at 30 than they did at 29.

When you look at the average of a particular age group, in this case 30-year-olds, you only see the players that survived, and, because they no longer play, you leave behind the players that are hidden from you sample. The method that follows resolves this issue to an extent.

What We Do Want In an Aging Curve

This study uses the delta method which looks at the differences of player seasons (i.e. a players age 29 wOBA minus their age 28 wOBA) and weighs those differences by the harmonic mean of the plate appearances for each pair seasons in question.

I would explain this further, but Jeff Zimmerman does an excellent job of this in a post on hitter aging curves that he did several years ago. While Jeff Zimmerman looked at RAA, which is a counting state, the methodology is basically the same for our purposes and wOBA, which is a rate stat:

In a nutshell, to do accurate work on this, I needed to go through all the hitters who ever played two consecutive seasons. If a player played back-to-back seasons, the RAA values were compared. The RAA values were adjusted to the harmonic mean of that player’s plate appearances.

Consider this fictional player:

Year1: RAA = 40 in 600 PA age 25
Year2: RAA = 30 in 300 PA age 26

Adjusting to harmonic mean: 2/((1/PA_y1)+(1/PA_y2)) = PA_hm
/((1/600)+(1/300)) = 400

Adjust RAA to PA_hm: (PA_hm/PA_y1)*RAA_y1 = RAA_y1_hm
(400/600)*40 = 26.7 RAA for Year1
(400/300)*30 = 40 RAA for Year2

This player would have gained 13.3 RAR (40 RAA – 26.7 RAA) in 400 PA from ages 25 to 26. From then, I then would add all the changes in RAA and PA together and adjust the values to 600 PA to see how much a player improved as he aged.

Findings

Below is an aging curve by strikeout profile for all player seasons with over 600 plate appearances in a season from 1950 until 2015.

Screen Shot 2015-04-18 at 1.23.52 PM

We can see several findings immediately:

  1. Players do age differently based on their strikeout profile.
  2. Players that strikeout more than league average peak at 23.
  3. Players that strikeout less than league average take longer to hit their peak—their age 26 season.
  4. Players that strikeout more than league average age better than players that strikeout less than league average.

From a historical perspective, this graph is fun to look at, but the way the game was played over half a century ago is eclipsed by societal evolutions that today’s players benefit from.

To give us a more realistic idea of how today’s players age relative to their strikeout rate, I made another graph the at looks at player seasons from 1990 to 2014.

Screen Shot 2015-04-18 at 1.40.36 PM

What we find in this graph, which is more current with today’s style of play, is that players still age differently dependent on their strikeout profile, but not in the same way that they did in the previous sample.

Players that strikeout more than league average still peak earlier than players that strike out less than league average, but in this more current population of players, players that strikeout more than league average peak very early—their age 21 season. This information would reciprocate the sentiment that has been conveyed through recent work that suggests that the aging curve has changed to the point that players peak almost as soon as when they enter the league.

The peak age for players that strikeout at below league average rates is still 26, but whereas this group aged more poorly than the strikeout heavy group in our previous population, players that strikeout at below league average rates now age better than their counterparts.

Conclusions

This information can make material differences for our overall expectations and outlooks on players.

Previous knowledge would suggest that players like George Springer and Kris Bryant—players who have exorbitant strikeout rates—are still on the climb as far as their talent goes, but this information shows that these players may already be at/close to their peaks or on the decline as far a their wOBA is concerned.

This information also shows that we should be patient with prospects that have a penchant to put balls is play; while they peak more quickly than they did in the previous population, they take longer to develop than players with more swing and miss in their game, and when they do start to decline, there isn’t much need to worry, because their climb from their peaks will be gradual.

Like many other studies that have looked at new aging curves, this study confirms that players/prospects peak earlier now than at any other point throughout history, but it also shows that a player’s trajectory upward and downward is dependent on characteristics specific to their approaches at the plate.

Devon Jordan is obsessed with statistical analysis, non-fiction literature, and electronic music. If you enjoyed reading him, follow him on Twitter @devonjjordan.

Why the Chicago Cubs Should Keep Starlin Castro

Ever since the Cubs acquired top shortstop prospect Addison Russell from the Oakland Athletics in the Jeff Samardzija and Jason Hammel deal people began to speculate that Starlin Castro’s time in Chicago may be coming to a close sooner rather than later. Castro’s name began to pop up in trade rumors all the time, Castro to the Mets, Castro to Seattle etc… but Cubs President Theo Epstein and General Manager Jed Hoyer told teams that Castro wasn’t going anywhere. With all the middle infield talent the Cubs have people see Castro as the odd man out. The front office repeated their message about Castro being their guy early in the offseason by saying “ Starlin is our shortstop in 2015.” I know a lot of people expect Castro to be traded at some point, but I’ll go over why I think they should keep the three-time All-Star, and how he’s becoming a better player.

Contract

First off Castro is still young currently 24 years old (he’ll turn 25 in spring training). Castro also has a team friendly deal at 7yr/$61M with an option for the 2020 season. This contract averages out to $8.7M each year, although the contract is back loaded, but still an average of $8.7M is a bargain for a premium position in today’s MLB market.

 Year  Age  Salary
2015 25 $6,857,143
2016 26 $7,857,143
2017 27 $9,857,143
2018 28 $10,857,143
2019 29 $11,857,143
2020 30 $16,000,000 (Team Option) $1M Buyout

Lets compare Starlin’s contract to another young shortstop, Elvis Andrus of the Texas Rangers. Andrus signed an 8yr/$120M contract with the Rangers.

Year Age Salary
2015 26 $15,000,000
2016 27 $15,000,000
2017 28 $15,00,000
2018 29 $15,000,000
2019 30 $15,000,000
2020 31 $15,000,000
2021 32 $14,000,000
2022 33 $14,000,000
2023 34 $15,000,000 (Vesting Option)


As you can see Andrus is due significantly more money than Castro. Compared to Andrus’ contract Castro’s seems like a bargain. But the real question is who is the better player, and is Andrus worth $60M more than Castro? Lets look at each player’s career numbers.

Andrus has posted of career line of (.272/.335/.345) with an OPS of .680, 20 points lower than league average. He has totaled 20 home runs in 6 seasons. Castro has a career line of (.284/.325/.410) with an OPS of .735, 35 points higher than league average. Starlin has clubbed 51 career home runs in one fewer year than Andrus. By comparing these two players numbers and contracts you can clearly see that the Cubs are getting a great deal on Castro. Castro not only makes far less than Andrus he is a superior offensive player, and is also younger with more upside. I believe that Castro’s contract could become more of a steal if Castro becomes a better player, which he is starting to show signs of. Lets go over how Castro is starting to become better in all facets of the game.

Improving Power

Castro totaled 14 home runs in 2014 tying his career high set back in the 2012 season. Starlin would have easily set a new career high if not for an ankle injury that cost him most of September. Despite missing almost 30 games Castro still put up a career high SLG% of .438 besting his 2011 season SLG% of .432. Keep in mind that is the season where Castro hit .307 and had over 200 hits so therefore his slugging percentage was based more on singles and triples and fewer long balls.

One reason for Castro’s improving power is that he is starting to hit more fly balls, and those fly balls are starting to leave the ballpark. In 2010 when Starlin got called up as a 20 year old he looked like a 16 year old due to his lean frame. Castro hit only 3 home runs that year and was mainly a singles hitter when he first started his career. In 2010 Castro’s groundball percentage (GB%) was 51.3% and his fly ball percentage (FB%) was 29.2%, this equaled a groundball to fly ball ratio (GB/FB) of 1.76. Castro’s home run to fly ball ratio (HR/FB) in 2010 was only 2.6%, which ranked 19th out of 22 qualified shortstops. As you can see when Starlin first came up he was a singles hitter who mainly hit the ball on the ground, which isn’t a bad thing, and when he did elevate the ball it rarely left the yard.

Let’s look at these same numbers in 2014. His GB% dropped to 45.3% and his FB% rose to 32.3%, which equaled a GB/FB ratio of 1.40. Now where the biggest change happened is in his HR/FB ratio — it skyrocketed to 10.1%. This means 1 out of every 10 fly balls that Starlin hit traveled over the wall for a homer. His increased HR/FB ratio brought him to 4th among qualified shortstops in HR/FB ratio, which is a huge improvement over his rookie season.

With more fly balls from Castro you’ll see more of this…

and this…

and this…

Not only is Castro hitting more home runs; he is hitting more impressive home runs like these above. Watching Castro’s 2014 season I found myself saying, “wow that was far” on more of his home runs than ever before in previous seasons.

For these reasons above I believe that Castro is poised to show even more power in the coming seasons due to his increased FB% as well as his vastly improved HR/FB ratio.

Improving Defense

Lets take a look at Castro’s fielding numbers from the beginning of his career until now.

Year Errors Fielding Percentage (FP%) FP% Change
2010 27 .950 N/A
2011 29 .961 +11
2012 27 .964 +3
2013 22 .967 +3
2014 15 .973 +6

When Starlin came up in 2010, defense was the biggest weakness of his game by far. In 2010 he committed 27 errors in 123 games, which ranked as the 2nd most in the MLB that year. His FP% of .950, was 2nd to last among qualified shortstops in 2010. In 2011 Castro committed 29 errors, which was the most in the majors that year, although he still ranked last in FP% among shortstops, his FP% rose by 11 points. In 2012 Castro tied for the major league lead in errors at 27. 2013 was more of the same tying for the second most errors in the majors, but in 2014 we saw a great improvement by his committing only 15 errors. This improvement is Starlin’s fielding brought him towards the middle of the pack in FP% among shortstops. Castro even had a 38-game errorless streak in 2014 as well, showing that he has gotten over his problem of making the routine throw to first.

Although the metrics are down on Castro as a defender, I see Castro get to balls that he has no business getting to. For example Castro is one of the best shortstops at making plays on bloopers and shallow fly balls, like this for example.

Castro has great range on balls hit over his head. Not only can he make the plays in shallow left and center field, he covers a lot of ground moving laterally and is quickly able to get to his feet and unleash a strong throw, like this for example.

As you can see Castro is improving his defensive game year by year and there is no evidence to suggest that he can’t get any better in 2015 as well. This is just one of the many ways that Castro is steadily improving his overall game.

Comparing Castro to Other Shortstops

As offensive numbers are down in recent years, finding a premium offensive shortstop is a hard thing to do. Lets see how Castro stacks up compared to other shortstops around the league in 2014.

Among qualified shortstops Castro led all of them in batting average at .292, He was 2nd in OBP at .339, and 3rd in SLG at .438. I’ll take a guy any day of the week that ranks in the top three of those categories among his position. Castro also ranked sixth in line drive percentage at 22.3% (which beat his previous career high by 2%), trailing the leader by only 2%. Castro also ranked first in batting average on balls in play (BABIP); these two categories combined shows that he is putting the ball in play and hitting the ball hard all over the field, which will generate a good average as well as power. Another stat where Castro is ranked in the top three among shortstops is wRC+; his wRC+ was 115, 15 points over league average, good enough for third among shortstops.

One knock on Castro in his career is that he doesn’t walk enough, but looking at the shortstop position as a whole no one is posting a staggering OBP (Except for Troy Tulowitzki, who is in another league compared to every other shortstop, but he can’t stay healthy). Therefore Castro’s .339 OBP is extremely good for a shortstop in the game today. I think people need to compare players to others playing that same position, because if you look at Castro’s numbers compared to other shortstops Starlin is clearly a top three shortstop in the game offensively.

What Do You Do With All These Shortstops?

Some people see the Cubs’ surplus of shortstops as a problem, but I see it as a good problem to have. Normally your shortstop is your most athletic player and covers the most ground, so why not have three of them in the infield? I think if the Cubs fielded and infield of Castro, Javier Baez, and Addison Russell, that infield would gobble up every groundball. Whether Castro sticks at short or if Russell comes up and becomes the shortstop that everyone thinks he will be, the Cubs could have a huge defensive advantage by playing three shortstops in the IF.

Playing three shortstops in the IF would shift Kris Bryant, who will be an average defensive 3B at best, to the outfield where his defense wouldn’t be as much of a concern. Bryant in LF would fill the one spot where the Cubs don’t have a top prospect. This would mean you would have a top prospect at every position in the future. For example C: Kyle Schwarber (if he can stick at C), 1B: All-Star Anthony Rizzo, a combination of Baez, Castro, and Russell all fitting at 2B, 3B, and SS (future positions TBD), LF: Bryant, CF: Albert Almora or Arismendy Alcantara (Alcantara could become super utility as well, a Ben Zobrist role), RF: Jorge Soler. I don’t know about you but a lineup filled with all those top prospects and all that power excites the heck out of me.

Overall I think Starlin Castro is severely under-appreciated not only by the MLB, but also by Cubs fans. Castro has improved in many areas, and I believe that he is among the top three shortstops in the game. Castro is starting to show that he has more power in that bat with an increased FB% and in his FB/HR ratio. Keeping Starlin Castro as well as all of the other shortstops could be very beneficial for the Cubs.


The Cubs, the Red Sox and a Blank Check

The Cubs and Red Sox are doing interesting things for their ambitions. Boston overhauled their young and unpredictable club with two of the top free agents on the board while the Cubs’ rotation makeover coincides with a slew of young offensive talent already in place. Neither team is yet finished as the outcomes of Scherzer, Shields and whatever we’re calling San Diego still loom toward the New Year. Regardless, their intent for 2015 and beyond is the same: win.

But these two teams are interesting for another reason. It’s not often that clubs expected to contend in one year also happen to have top 10-selections of that year’s amateur draft, but that’s exactly what will happen this coming June. The former club of Epstein and Hoyer will select 7th overall. Their current club will select 9th and if all goes according to plan, each club’s 2016 selections figure to fall well out of protection.

But rising from this is a fascinating opportunity. It’s a very rare opportunity requiring the unique but exact convergence of factors surrounding these two teams, swinging the cost/benefit ratio to an extreme. The Red Sox intend to be at the top of the standings this season and based on what they’ve done, chances are good that they will. The Cubs are not far behind and as opined by Dave Cameron may be just a leap or two from the same goal. Whatever happens, each of the next two seasons project to be followed by two of the strongest free agent classes in history. 2015 should include Justin Upton, Jordan Zimmermann, Jason Heyward and more. The 2016 elite is likely to be headlined by Stephen Strasburg. There is going to be a hefty number of qualifying offers and little reason to care.

Focusing upon the next two years is important. The current collective bargaining agreement is in effect until December 1st, 2016, specifying the rules that govern draft bonus allotments and the penalties for their violation. Summarized below:

–        0-5% overage: 75% tax on the overage

–        5-10%: 75% tax on the overage and loss of 1st round pick in subsequent draft

–        10-15%: 100% tax on the overage and loss of 1st and 2nd round picks in subsequent draft

–        15% or higher: 100% tax on the overage and loss of 1st round picks in subsequent two drafts

o   Note: If a team lacks the selection subject to penalty due to a prior penalty levied from draft overages, the team will be penalized in the next draft in which said selection is conveyed.

To date, no team has spent beyond the 5% threshold and thus no team has been penalized a selection.

But then no team has been in this particular position before, a situation perhaps too unlikely to have been considered during CBA negotiations. Under the rules above, teams are pressured either to adhere to slot value or to strategize by shifting their allotments in favor of two or three top talents. The Cubs and Red Sox will have no such limitations this June. They can spend with complete and utter impunity.

Part of how this is possible is due to the language of the CBA and the impending sequence of events. A theoretical chronology:

1)     The 2015 draft begins

2)     Boston or Chicago picks who it wants and spends as much as it wants

3)     Boston or Chicago receives the maximum penalty, including tax and forfeiture of 2016 and 2017 1st-round selections

4)     2015 free agent class – Either team signing a QO free agent forfeits its next highest 2016 selection (2nd round)

5)     2016 free agent class – Either team signing a QO free agent forfeits its next highest 2017 selection (2nd round)

6)     Draft Penalty completed

Why would they do this? Because of who they are and because there is every incentive for doing so. Consider the maximum penalty – forfeiture of 2016 and 2017 first round picks – only for these two clubs, it’s entirely probable that none of these picks project to exist. Notice I said project, which is a critical distinction, because at the time of the 2015 draft their 2016-17 selections are officially still in place.

Implying, what if they can be sacrificed? The Cubs and Red Sox each operate at the highest levels of revenue and at their current win-curve trajectory are virtually guaranteed to be major players on the free agent market in each of the next two years. As a demonstration, both have already signed major targets this off-season. It’s easy then to imagine either team having to relinquish their top selections anyway, except either club can decide that in June as opposed to November. Given enough information by then, they’d have to ask themselves: What do they have to lose?

Lets assume each team performs toward the fringe of the playoffs and we assign them the 23rd selection in 2016 and 2017. In Boston’s case we could argue this will be even lower, or a few spots higher for the Cubs if you think they aren’t quite playoff ready, but as a middle ground the 23rd selection is a good place to start. Keep in mind by June, enough games will have been played to know this with some certainty. Let’s also assume that the first-round selections in each year will be lost to FA compensation. This isn’t an exact process since picks will be added or removed to a varying degree, but using 2014’s values will give us a rough estimate going from one year to the next:

2014 7th 9th 23rd
Round ($M) ($M) ($M)
1 3.30 3.08 1.95
2 1.19* 1.13 0.90
3 0.68 0.66 0.53
4 0.47 0.46 0.39
5 0.35 0.34 0.29
6 0.26 0.26 0.22
7 0.20 0.19 0.17
8 0.16 0.16 0.15
9 0.15 0.15 0.14
10 0.14 0.14 0.14
Total 5.71 6.57 2.93
% Decrease -48.7 -55.5

*Boston forfeits 2nd round selection (Hanley Ramirez)

In addition to forgoing the top 30 prospects, dwindling bonus pools severely damage teams’ ability to pay for any talent at all. By employing this strategy, Boston and Chicago can essentially punt drafts in which they might have expected to extract little value in the first place. In exchange, they take full reign to obtain as much talent as they wish in the coming draft – and the talent will be there. Even as restrictions pressure draftees to sign close to slot nevertheless talent falls due to signability, particularly when coming from high school. In the scenario above, a team is looking at one 7-figure talent, maybe two if slots can be shifted. Compare that to what they might obtain with 40 limit free selections.

Just as important, where these teams select has a significant influence on realistic return. Where top ten selections can result in impact talents, selecting early in each round is an opportunity to grab a falling talent well before other teams consider themselves able. Within current strategies, teams have to be cautious of the round in which they decide to risk on higher prospects as the ability to pay is tied directly to their selections in other rounds. But if money is no object, the Cubs and Red Sox can simply pick whomever they want whenever they want, in which case having the higher position becomes a huge advantage.

This isn’t foolproof. It would have to be a “calculated risk” decided upon almost the day-of. For one thing, it’s impossible to predict exactly what a free agent class will have to offer. If several projected free agents instead sign extensions, it becomes more difficult to justify devaluing your top selection. By June, teams should have a better sense of the picture ahead but it won’t be crystal clear. These teams will have to be reasonably confident not only that targets will exist, but that they’ll have a reasonable desire to sign them.

For another thing, at a certain point the cost in payable tax becomes a bit unwieldy. Perhaps the key then isn’t to sign as many top prospects as possible but rather enough to make up for impending losses in the two subsequent drafts. Because their pools are relatively large both teams will be partly insulated, but past that you’re paying double what you normally would per prospect. That requires confidence that the talent available is worth the additional costs, something not often expressed by teams prior to the current CBA.

That’s an argument to be made however, simply because the successful development of a few can exponentially result in surplus value. Should you prefer a direct measure of dollars, studies such as this one routinely demonstrate the windfalls in appropriately identifying and obtaining draft talent regardless of where they’re picked. In today’s league with today’s prices, that’s as tempting an idea as ever and if you wonder whether teams still place premiums on potential, look no further than the international market. Furthermore, the value of a prospect is predicated not on “Will he produce major-league value?” but rather “Can he?” The extractable value of potential in trades should be evident as I write this.

But the third and perhaps the most critical obstacle is the league itself and whether it takes the power to reject bonus agreements. This is suggested in the CBA document linked above, where the “uniform player contract” specifies required-approval by the Office of the Commissioner. Whether this suggests the Office would actually exercise its right of refusal isn’t clear. The only precedent as far as I know is MLB’s refusal to allow a $6M bonus to Matt Purke, a unique situation in which MLB had control of the Rangers’ finances. Particularly controversial deals have drawn little more than ire. Strict stipulation of penalties in the current CBA implies a team’s right to accept said penalties should it choose to do so. For the Commissioner to explicitly prevent a team from exercising this right is bordering on breach and may be actionable or subject to a grievance by the club or by the MLBPA. This is where the issue gets a little messy and comes down to debates beyond the scope of this article.

I won’t hesitate to call this what it is: a gambit. Strategies like this enliven the game and introduce an element of danger that can either pay off or egg face. Regardless, it highlights yet another flaw to the system in place. In one sense, this strategy is a novel way of playing within the rules, which is at the very heart of high competition. In another sense, it goes against sportsmanship in that this strategy is available only to teams who can realistically devalue their top selections, i.e. teams operating with enough capital to consistently invest at the top of the open market.

But rules are rules. The Cubs and Red Sox have the chance to align their playoff ambitions with a prospect bonanza not yet seen. They’ll have their pick among the elite and after that, should the dominoes fall along the way, they can – and should – take full advantage.

Jonathan Aicardi is a researcher with UCSF in the study of glioblastoma and the proprietor of Another Mariners Blog! Because apparently the world needed another one.


The Resurgence of Jon Lester: How a Small Mechanical Change Brought Back a Pitch that Earned Millions

Jon Lester just got paid. Early Wednesday morning, it was announced that Jon Lester accepted a 6-year $155M contract with a vesting option for a 7th year to become a member of the Chicago Cubs. This is over $20M more than the FanGraphs readers predicted in the offseason free agent crowdsourcing. This is the same pitcher that the Red Sox offered a 4-year $70M extension to prior to the season and proceed to nearly double their offer to $135M in the off-season. Before 2014, it was reasonable to think Jon Lester might be looking at a deal similar to the 5 years $90-95M that has been predicted for James Shields. What did Lester do to convince teams he is closer to a $200M pitcher than a $100M pitcher? He looked like the elite Lester we saw in 2009-2010, and not the merely very good pitcher he was in the past few years. How did he improve in his contract year? Let’s take a look.

Jon Lester fWAR/Season fWAR rank FIP FIP rank K% K% rank Contact % Contact% Rank
2009-2010 5.8 9th 3.14 10th 26.4% 2nd 76.1% 7th
2011-2013 3.6 16th 3.84 60th 20.4% 48th 80.9% 68th
2014 6.1 6th 2.80 9th 24.9% 12th 78.6% 29th


Lester was one of the top pitchers in the game during the 2009 and 2010 seasons, and even placed 4th in AL Cy Young voting in 2010. His peers were Felix Hernandez and Adam Wainwright, along with Lincecum and Sabathia (before they became husks of their former selves on the mound). While WAR still treated Lester well in 2011-2013, partially due to the sheer number of IP and park and league statistical adjustments, his FIP placed him in the leagues of Kyle Lohse, Homer Bailey, Yovani Gallardo and Ian Kennedy. During that period, Lester’s opponent contact rate and swinging-strike rate were the same as those of Clay Buchholz. So comparing a theoretical Lester deal to the Bailey extension, which was looked at as an overpay by some, didn’t seem unfair. From 2011-2013, Lester trailed Shields by over 2 WAR, so a similar contract didn’t seem unfair prior to 2014.

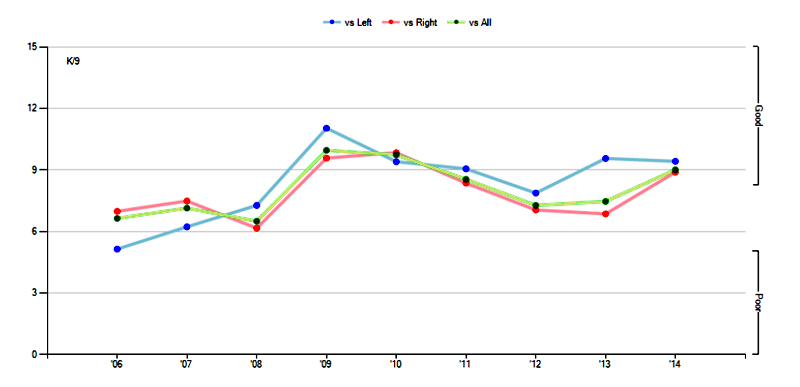
What caused Lester to fall from the ranks of the elite and become more of a number-two starter? The strikeouts disappeared.

800x387xlester-l-r.png.pagespeed.ic.p9Ej

800x394xlester-k9.png.pagespeed.ic.-Zrox
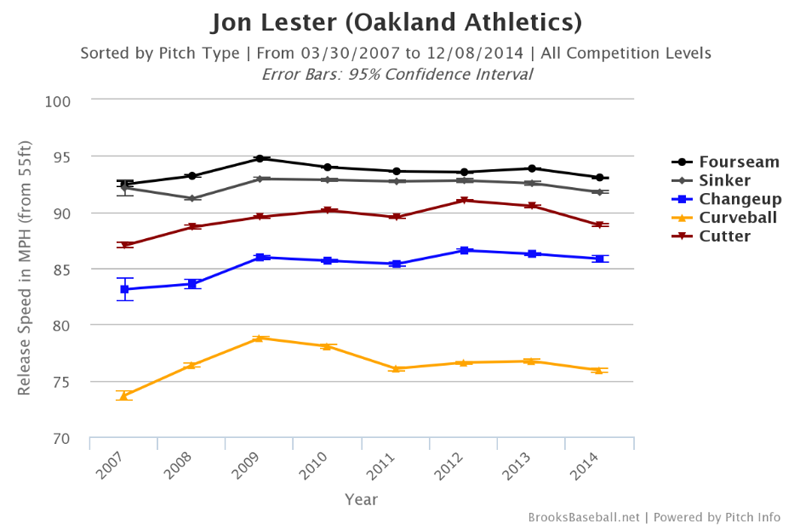
The problem was especially apparent against righties, whom he struck out at only a 17.9% clip in 2013 (compared to 26.3% in 2010). What caused this decline? Let’s take a quick look at the Pitch F/X data. A lot of people are under impression that the decline was due to velocity loss that occurs with aging. This isn’t really the case for Lester. Lester’s fastball velocity has declined by less than one mile per hour, from 94 MPH in 2010 to 93.2 MPH in 2014. While the cutter and curveball have lost velocity, they aren’t as dependent on velocity as the fastball:

800x529xlester-pitch-type.png.pagespeed.
If we take a look at his pitch usage, we notice two things: He has for the most part ditched the sinker and changeup in favor of the fastball, cutter, curveball combination that our Matt Trueblood detailed in his recent piece.

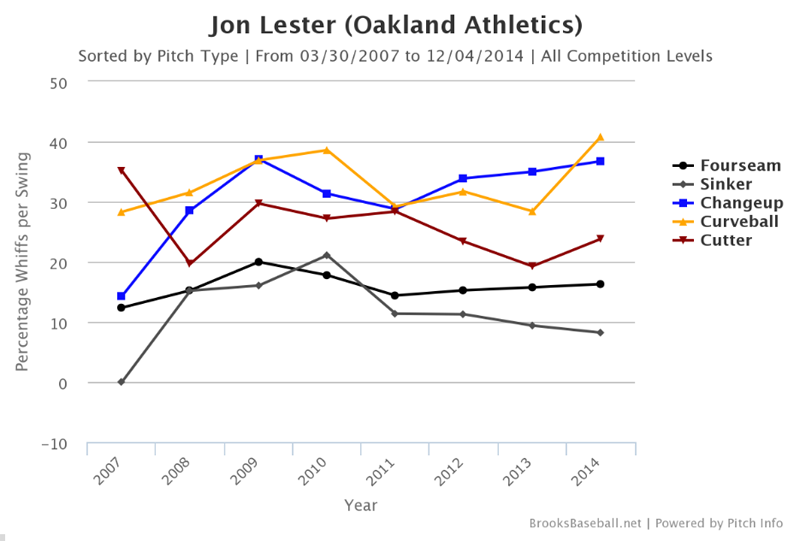
Let’s take a look for the most telling data for any pitcher: the ability to get hitters to swing and miss.

800x541xlester-whiff.png.pagespeed.ic.Br

Lester’s fastball generated whiffs on 16.3 percent of all swings in 2014, his best mark since 17.8 percent in 2010. That is around the league average of 16.4 percent, according to Eno Sarris’s benchmarks. The cutter, which he is throwing at a career-high frequency of 31.0% of all his pitches, is generating a whiff-per-swing rate of 23.8 percent (5th in MLB, minimum 500 pitches thrown), above the league average of 21.4%. The pitch isn’t as good as it used to be, when it generated whiffs on over 28 percent of swings, for reasons Sarris detailed last year. However, it’s still a very good pitch that was even better in 2014 due to improvements in the horizontal movement.

The curveball, though, is what’s special. In 2014, Lester’s curveball generated whiffs-per-swing on 40.8 percent of opponents’ swings, the highest mark of his career—and 12 percentage points more than in 2013, when his curveball was league-average in that regard. In 2014, It was the best curveball in the league in terms of whiffs per swing, with pitchers like A.J. Burnett, Adam Wainwright and Sonny Gray behind him.

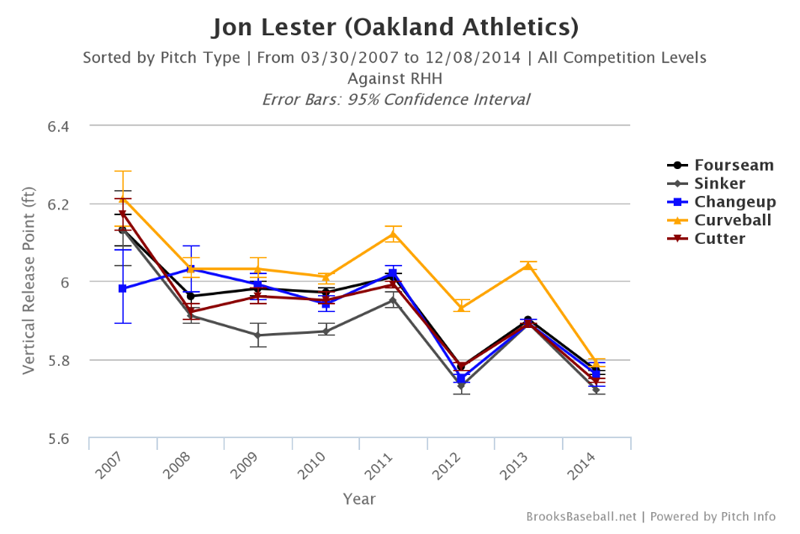
Now what happened to the curveball? It didn’t gain velocity. It didn’t gain movement. It gained a more consistent vertical release point. Look at 2014. Lester changed his release point on all pitches, but as you can see, the release points of the fastball, cutter, and curveball are tightly grouped together. Now look at 2009 and 2010, and compare it to 2011-2013. It appears that in his “peak years,” Lester maintained a better-disguised release point on the curve than he did in 2011-2013.

If the curveball was being tipped or was less deceptive, righties would have the best look at it.  Let’s check that out:

800x534xlester-release.png.pagespeed.ic.

nAa3HGr.png


NqtDfGc.png

There is something incredibly satisfying in finding the results we might expect. The curveball generated 41.4% Whiffs/Swing vs. righties compared to the 25.8% in 2013. Lester’s Curveball caused 25 Ks against righties, 6th in baseball compared to 2014 when it only caused 6. This is exceptional because he only generated 55 whiffs on the CB vs. RHH. When righties do make contact, they aren’t hitting it hard, only slugging .151 against the hook last year, compared to .338 in 2013. Righties aren’t picking up the curveball like they were before, and in 2014, that solved the platoon issues he had against them in previous years. Trueblood said, “Lester might have tapped into something that will allow him to dominate right-handed batters in the future.” That something is the curveball. It allowed him to ditch his changeup with little consequence.

The gist is that 2014 Jon Lester was more like 2009-2010 Jon Lester than 2011-2013 Jon Lester. A mechanical adjustment allowed the curveball to reemerge as an elite weapon in Lester’s arsenal, complementing a very good cutter and an above average fastball. It also allowed him to enjoy success versus righties again. The question is: How sustainable is this change? If Lester can lose his mechanics for years, is there serious risk of him losing them again? Can he continue to improve? If he can bring the curveball back to its former glory, can he regain a bit more movement on the cutter again? Can he bring back an effective sinker, giving him a deeper arsenal? These are the questions on which the Cubs will be betting $155 million on. If these changes can be sustained, it wouldn’t be surprising if Lester is worth the contract barring injury. Just one 5 WAR season can be worth $40M on this market. Lester made a slight change to his mechanics and it just might have earned him tens of millions of dollars.


The Chicago Cubs and the Terrible, Horrible, No Good, Very Bad Junior Lake Season

The future is bright on the North side of Chicago. As Rany Jazayerli pointed out this week on Grantland, that future is especially bright in the batter’s box. With an absolute stud to build around, arguably the best bat in the minor leagues right now, a 24-year old short stop who has been worth over ten wins in his career so far, and seemingly every single middle infield prospect in the world, even the biggest curmudgeon on TV seems to be enthusiastic about the Cubs future. However, if this article were written a year ago today, there would be another name that Cubs fans would be screaming at me for leaving off, Mr. Junior Lake. While Lake was not the biggest prospect in the Cubs’ system, when he burst on to the scene last July, excitement was high. It took him only five games to tie a major league record, as no player has ever had more than the 12 hits he garnered through his first five games.

After six games, Lake had an article of his own on FanGraphs, (deservedly) espousing his hot start, while (prophetically) looking at a few red flags in Lake’s game (more on that later). In those six games he slashed .519/.536/.852 with a pair of home runs and three doubles. He even continued to hit well for the remainder of the season, finishing with a wRC+ of 110 and despite below average defense in the field, was still worth over a win to the Cubs for the 64 games in which he appeared. Coming into this season, Lake was a 23-year old with a decent upside who had Cubs’ fans excited for the future.

Cut to: August 13, 2014.

Lake has lost his regular spot in the lineup, and no one has deserved to lose their spot in the lineup more this season. Now Lake may bounce back to be a decent contributor for future iterations of the Cubs (again, more on that in a little bit), but his numbers this season are incredibly poor. Check out his ranks (these will all be from the bottom ranks, as in first really means the worst in the league) in these essential statistics in 2014:

Stat Lake in 2014 League Rank (min. 300 PAs)
OBP .246 2nd
wOBA .269 11th
LD% 15.6 8th
wRC+ 66 10th
fWAR -0.7 6th

Being near the bottom of one of these statistics is hardly a death knell (check out the killer lineup that could be created with the lowest line-drive rates in the league), but if you’re at the bottom of the barrel across the board, it’s fair to say you’ve Schruted up your season in a big way.

So what has been the cause of Lake’s collapse at the plate? The answer is pretty simple. All that’s needed is a trip over to the plate discipline graphs on this very website. Once again using from the bottom ranks, check out some of Lake’s plate discipline statistics:

Stat Lake in 2014 League Rank (min. 300 PAs)
K% 33.4% 3rd
BB% 3.3% 7th
BB 10 T-1st
BB/K 0.10 1st
O-Swing% 43.0% 7th
Z-Swing% 77.2% 7th
Swing% 58.1% 4th
O-Contact% 43.3% 5th
Z-Contact% 74.5% 4th
Contact% 61.6% 3rd
F-Strike% 69.5% 1st
SwSt% 21.7% 1st

As someone who is neither here nor there on the Cubs (aside from a long-term bet in which I have them making the playoffs before the Astros), I think it’s fair to look at this man who has somehow combined a Pablo Sandoval-esque lack of patience at the plate with a Chris Carter-esque lack of contact on those reckless swings, and simply say, “I’m not even mad, that’s amazing.”

That duo isn’t easy to pull off. Of the top thirty highest swing rates among hitters with at least 300 plate appearances, only one other hitter (Mike Zunino) has a contact rate in the sixties, and Zunino’s swing rate is lower and his contact rate is higher than Lake’s. Not to mention that Zunino’s defense has actually made him worth two wins for the Mariners this season, while only George Springer has committed more errors in the outfield than Lake in 2014.

Lake’s Brooks Baseball profile is maybe the most depressing thing in Chicago since this guy.

His performance against fastballs is described as, “an exceptionally aggressive approach at the plate (-0.19 c) with a disastrously high likelihood to swing and miss (30% whiff/swing),” against breaking pitches, “an exceptionally aggressive approach at the plate (-0.32 c) with a disastrously high likelihood to swing and miss (50% whiff/swing),” and against offspeed pitches, yeah, “an exceptionally aggressive approach at the plate (-0.65 c) with a disastrously high likelihood to swing and miss (55% whiff/swing).”

The man clearly needs a private lesson with Wade Boggs, although that might not even be enough. Interestingly enough, in his aforementioned piece on Lake last year, FanGraphs’ Bradley Woodrum spotted a couple of potential flaws that Lake would have to fix. Woodrum mentions Lake’s lack of plate discipline in the minor leagues, but he also touches on two other drawbacks to Lake’s game: his extremely “loud” swing, and his struggles with low sliders.

As far as the “loud” swing, scouting player’s swings is not my specialty, but his swing actually does seem a little toned down in 2014. Check out the gif used in last year’s FanGraphs piece showing Lake’s bat going crazy as the pitch comes in. Now here’s his toned down approach taken from the middle of this season. Well, toned down until he swings and misses, at least:

While his hands are still moving, they don’t seem to be doing so with the same reckless abandon as last year. That would seem to be a good sign, one that Lake is willing to tinker with his swing to get better results. As I said though, I am far from a scout, and would be curious to hear feedback on what others think about his swing.

In terms of his struggles with sliders, those have only been exasperated in 2014, as he has derived the fourth-lowest value against sliders this season, at -7.4 runs. And considering that that pitch value is a cumulative statistic and the three men in front of him all have more than 100 more plate appearances than Lake in 2014, it’s fair to say Lake has struggled as much as any hitter in baseball against the slider in 2014.

With Arismendy Alcantara having made a far smoother transition to the outfield (believe it or not, Lake was yet another middle infield prospect originally), and Jorge Soler/Kris Bryant due to be called up in the not-too-distant future, one has to wonder whether Lake’s shot at as a member of the Cubs is through with. The best option likely would have been to send him down to Triple-A about a month ago, as sitting on the bench in the major leagues will neither help his confidence, nor give him the chance to get in regular swings every day, and begin to tinker with his swing etc.

There is some evidence that Lake far prefers to play left field instead of center field, slashing .312/.333/.561 in his 44 games in left field, but this seems a little bit more noise than signal. However, given that the Cubs really have no motivation to win at this point, their best option may well be to put Chris Coghlan, their current left fielder and a useful piece for say the Oakland A’s, on waivers, and see what they have with Lake in left field for the remainder of the season. With a month and a half of season left, the Cubs could see if those splits really are statistically significant, and if they were, the Cubs could have yet another piece of their future lineup in place. And if not, there are plenty of reinforcements on the way.


Would Charlie Root Really have Beaned Babe Ruth?

I’m speaking about one instance in general, the famous or infamous alleged “called shot” by Babe Ruth at Game 3 of the 1932 World Series.

Stimulated by ESPN Chicago NOT calling that the No. 1 moment in Wrigley Field’s 100-year history (more on that later), I got curious.

The “called shot” game from the 1932 World Series has the mythos of whether or not Ruth did point at center field while at bat in the fifth inning, after making some sort of gesture before that, it seems, at Cubs pitcher Charlie Root (sic, per Baseball-Reference, Wikipedia and elsewhere; FanGraphs’ “Charley” is much less attested) after he got 2 strikes on him.

To me, this is the No. 1 event not just because of gray-area questions about what Ruth did and did not do, but also from Root’s vociferous denial that Ruth was calling anything, claiming he would have beaned him if he was.

Really? Let’s first look at quotes from the Wikipedia link above on the “called shot.”

  • “Don’t let anybody tell you differently. Babe definitely pointed.” — Cubs public address announcer Pat Pieper (As public address announcer Pieper sat next to the wall separating the field from the stands, between home plate and third base. In 1966 he spoke with the Chicago Tribune “In the Wake of the News” sports columnist David Condon: “Pat remembers sitting on the third base side and hearing [Cubs’ pitcher] Guy Bush chide Ruth, who had taken two strikes. According to Pat, Ruth told Bush: ‘That’s strike two, all right. But watch this.’ ‘Then Ruth pointed to center field, and hit his homer,’ Pat continues. ‘You bet your life Babe Ruth called it.'”)
  • “My dad took me to see the World Series, and we were sitting behind third base, not too far back…. Ruth did point to the center-field scoreboard. And he did hit the ball out of the park after he pointed with his bat. So it really happened.” Associate Justice John Paul Stevens, United States Supreme Court
  • “What do you think of the nerve of that big monkey. Imagine the guy calling his shot and getting away with it.” – Lou Gehrig
  • The Commissioner of Baseball, Kenesaw Mountain Landis, attended the game with his young nephew, and both had a clear view of the action at home plate. Landis himself never commented on whether he believed Ruth called the shot, but his nephew believes that Ruth did not call it
  • Washington Post legendary columnist Shirley Povich, detailed in an interview with Hall of Fame catcher Bill Dickey. “Ruth was just mad about that quick pitch, Dickey explained. He was pointing at Root, not at the centerfield stands. He called him a couple of names and said, “Don’t do that to me anymore, you blankety-blank.”

So, hard to say, but it adds to the mystique, right? And, of the collected quotes, three say he called the shot, and the others are kind of ambivalent.

So, can we explore further?

Relatively recently discovered footage leans more toward the idea of Ruth pointing his bat at the Cubs dugout, Wikipedia claims. That said, even that and him reportedly holding two fingers up to Root, or pointing at him, would have been something halfway like saying “here it comes.” In other words, short of Ruth pointing to the centerfield scoreboard, Root arguably had reason to bean him anyway. Beyond the above, Ruth had already homered off him earlier in the game.

And speaking of …

Let’s look at Baseball-Reference’s play index for that game, to further question Root’s claim.

First, the game was tied 4-4 entering the top of the fifth. Root wouldn’t want to jeopardize that lead. And, beaning Ruth with 1 out would have brought up Lou Gehrig who, like Ruth, had already hit one homer in the game and by this point was a more dangerous batter than Ruth.

So, especially with two strikes on Ruth, from quick-pitching or whatever, no Root wouldn’t have beaned him. He would have tried to strike him out. Beaning him with a two-strike count to know he would face Gehrig next in a tie game would have been stupid. Root needed the out. The Cubs needed the win. A strikeout of Ruth would have given the bench-jockeying Cubs dugout more ammunition, too.

In actuality, Root didn’t and couldn’t strike out Ruth. Gehrig then hit another homer too, at which point Root got yanked.

So, Root may be right, but I kind of doubted it. He had reasons for his statement, of course. Root’s not a HOFer, but he is arguably a member of the Hall of Very Good, winning more than 200 games and posting nearly 40 career WAR. And he’d like to be remembered for that rather than for getting shown up, getting “faced,” by Babe Ruth. Who wouldn’t?

Beyond that, as I talk about in more detail at my blog, about the history of Wrigley, besides the “called shot” dethroning the Bartman game from the top spot, I’m not even sure I’d rank that game at No. 2 on Wrigley’s Top 100. That’s in large part because I’m not a Cubs fan, I know.


What the Cubs Need to Do to Be Successful

The Chicago Cubs have gotten off to a very slow start in the 2013-14 season scoring a total of 9 runs in their first 5 games and as a result of that they are 1-4. The buzz around the city of Chicago is all about the excitement of top prospects Javier Baez, Albert Almora, and Kris Bryant tearing up minor league pitching and rapidly moving up in the Cubs System. All of these players have fantastic stats but the stats don’t truly matter until these players can be productive big league players. The problem is is that these prospects have shown day in and day out that they are ready to move on to the bigs. Almora, might not be quite there yet but Baez and Bryant have proven they are by dominating minor league pitching and posting good spring training numbers. Cubs GM Theo Epstein won’t pull the trigger on sending these guys up. Bringing these players up will significantly improve the quality of the team but many more changes will need to take place in order for the Cubs to be a team to win games on a consistent basis. Here are 3 other things that need to happen for the cubs to start their path to being successful

1. The cubs need to find a reliable, all-around, everyday 2nd baseman. There are many different solutions the their problem at 2nd but first let’s establish what the problem is. Darwin Barney has proven that he is an excellent fielding 2nd baseman but he is an absolutely horrendous hitter. In 2013, Barney posted an atrocious slash line of .208/.266/.303. Not only does this show that he rarely gets hits or gets on base, but when he does it’s mostly because singles. The Cubs have many possible solutions to this problem. One possible solution is to bring up Javier Baez and play him at short and Starlin Castro at 2nd or vice versa. Doing this might slightly weaken the 2nd base spot defensively, but drastically improve it offensively. With the Cubs pitching being surprisingly good in the first few games of 2014, their offense is a glaring problem and Baez would improve it instantaneously.

Another solution would be to slide Luis Valbuena over to 2nd and make Mike Olt the everyday 3rd baseman. Currently, Olt and Valbuena are splitting time at third which is detrimental to the team because both players have shown offensive value to the cubs. Valbuena had an excellent eye and has proven to be adept at drawing walks. He also has shown solid power as he hit 12 homeruns in 108 games in 2013. Olt has also shown the ability to hit for power as he had 5 homeruns in a very good spring training that earned him a spot on the opening day roster. Either of these solutions would be a much better fit for the Cubs then having Barney as the everyday 2nd baseman.

2. If the Cubs want to be good now, their bullpen needs to be consistent, and deeper. The bullpen has been a problem for the Cubs for a very long time. However in 2014 they might show some signs of improvement. In 2013, reliever Pedro Strop Posted a solid 2.83 ERA in 35 innings with the Cubs. In his time in Chicago, he only gave up 11 earned runs, 5 of which were in one performance. Along with solid numbers Strop possesses a 97 MPH power sinker in addition to his best pitch which is his slider. Strop will be put into a much bigger role this season and if the cubs want to succeed he will need to continue to pitch at a high level. In the offseason the cubs also signed lefty Wesley Wright and Jose Veras who in recent history have proven themselves as reliable bullpen options to their clubs. Players like Brian Schlitter and Hector Rondon will also need to step up for the Cubs. If Strop can continue pitching at a high level and the rest of the pen can consistently pitch in late innings. The Cubs will improve as a team very much.

3. Lastly if the Cubs want to succeed Anthony Rizzo and Starlin Castro must have bounce back years. There are many things that I could criticize about these 2 players but there a few problems in their games that are in the most need of fixing. In 2013 Rizzo only hit .233 if Rizzo continues to hit in the heart of the cubs line up, a .233 average is unacceptable. If he was hitting 50 homeruns it might be a different story but .233 with only 23 HRs isn’t going to cut it. In order for the Cubs to succeed, Rizzo will either need to hit 10-15 more homers or improve is average by around 30 points.

Starlin Castro is a much bigger problem for the Cubs. Spending most of the season in the 3 spot, Castro posted a weak slash of .245/.284/.347. Castro’s numbers were only a bit better than Barney’s which makes him a big problem. In addition to his poor offensive play, Castro has been an extremely inconsistent defensive SS his entire career. There is optimism for Castro though. In Castro’s first 2 full big league seasons, he was voted to the All-Star Game and hit close to .300 in both of those seasons. Castro has shown in his career that he has the ability to hit, the question. is will he be able to have seasons reminiscent to his all-star years. Only time will tell for Castro but if he can bounce back along with Rizzo the Cubs might actually be a legitimate team.

Although many things need to happen for the Cubs to be a playoff contender, fans should be optimistic for the future. With a farm system fortified with elite prospects throughout and an improving bullpen, the cubs need their “key players” to perform at a higher level. If all of these things can happen, there might be October baseball played at Wrigley sometime in the near future.


Believing that Starlin Castro Will Rebound in 2014

Earlier today, I was looking at trends and projections for some Cubs prospects and looked up Starlin Castro.  A trend immediately struck me: his 2010 batted ball statistics are nearly identical to his 2013 peripherals.

Stat:      ISO         LD%        GB%       FB%      IFFB%

2010:   .108      19.5%      51.3%     29.2%     7.0%

2013:   .102      19.9%      50.7%     29.4%     7.6%

These two seasons are closer than any of his other seasons in batted ball numbers.  A key difference?  2010 BABIP was .346, 2013 BABIP was .290.  His career BABIP is .323.  So is it we assume some good luck in 2010 and bad luck in 2013?

It should be noted that his BB% in 2013 was his career low, and his K% was his career high mark.  So can we expect some regression in those numbers as well?

I think the answer is yes to both questions.  In 2012, his BABIP was .315.  Even if Castro could return to that level (right around his career average), he looks much better than the .245 hitter we saw in 2013.

Additionally, his K% in 2013 was 3.8% higher than his previous career high, so I tend to expect a slightly lower rate in 2014 (though his contact rate in 2013 was also the lowest in his career, so if that is a trend, it is possible the K% could stay).

I’m still a firm believer in the idea that the past management, while trying to teach Castro to be selective and patient, actually taught him to take pitches for the sake of, well, taking pitches.  This could also potentially explain the low contact rate.  The numbers indicate that he didn’t learn to distinguish balls from strikes any better, and that maybe for him, the best approach is to swing at whatever looks good.

Given the striking similarities between his rookie season in which he hit .300 and garnered national attention as an upcoming star and 2013, it’s easy to dream about a bounceback 2014 season.  Only time will tell if that’s a reality, but I believe that Cubs fans have reason to be optimistic.

(I posted this earlier at the-billy-goat.mlblogs.com.  For more Cubs news and analysis, feel free to check out the blog.)


Positional Versatility and an Extension of Shifting

Is positional versatility underutilized? What does it cost for a player to transition from one position to another? MLB rules state that players currently in the game may switch positions at any dead ball, so why don’t teams shift their stronger fielders around the diamond based on batted ball profiles? Would it be worth it, in terms of runs, to try to have players play multiple positions and shift around the diamond? These are the questions that the following research attempts to answer.

I. The cost of transitioning between positions

The first thing that must be evaluated is what a player gains or loses when moving from one position to another. To do this, I looked at a player’s Total Zone and Defensive Runs Saved numbers, on a per inning basis, for each position they played at least 500 innings at. I did this for every player that met this minimum during the years from 2003-2013 (2003 was chosen as the cutoff because that is the first year DRS numbers are available). After data collection, for each position I took the total per inning number, subtracted from the position they were moving to, multiplied by 1200 innings for roughly a full season. I did this for every position, but I will only list the important positions for the purposes of this research. Since teams would most likely be shifting based on handedness and pull rates (though they theoretically could shift based on other things like GB/FB ratio if they had an outfielder who played a fantastic infield position or vice versa), this makes the important transitions ones shifting between the right and left side of the diamond. Those transitions are as follows:

(Note that due to how this was calculated, the inverse transitions, like 2B-SS, are the same number, but negative. This data was all gathered from Baseball Reference.)

SS-2B: 2.32 TZ runs for a season

SS-2B: 1.82 DRS

3B-1B: 4.68 TZ

3B-1B: 4.41 DRS

LF-RF:  -1.03 TZ

LF-RF: -2.05 DRS

(Personally, I had thought left field was more difficult, though maybe that is a result of mostly watching games in PNC park. It is also worth mentioning that on an individual basis, LF and RF are where Total Zone and Defensive Runs Saved had the largest disagreements)

So, as most people would expect, shortstop came out to be the most difficult position on the field, followed by second base and center field, third base and right field, left field, and first base. So, now that we’ve established that baseline for players transitioning between positions, we can move on to how many runs they would gain or lose in the process.

II. Estimating the number of fielding opportunities

Initially, I could not find detailed batted ball information broken down by handedness. So I attempted several methods of quantifying the impact, using the Cubs fielders as an example, and continually came up with the Cubs gaining 3-6 runs over the course of a season while shifting 20-30% of the time. However, those methods will not be discussed here. This is because Tony Blengino posted this wonderful article yesterday, complete with a batted ball breakdown for left and right handed hitters. So, it was revision time.

Step one was to take the number of fielding opportunities (also from Baseball Reference) for each of the examined positions, so I could get TZ/Fld and DRS/Fld numbers. This was also done with the transitions applied, to get TZ/Fld and DRS/Fld numbers for when they were playing the alternative position. Then, Blengino’s breakdown was combined with the average GB%, FB%, LD%, and IFFB% for left and right handed hitters. This gave a more specific batted ball breakdown for each area of the field. This breakdown is as follows:

MLB LHH

LF %

LCF %

CF %

RCF %

RF %

POP

1.01%

0.68%

0.40%

0.47%

0.44%

FLY

4.45%

7.48%

5.79%

7.92%

5.70%

LD

2.58%

4.36%

3.55%

5.41%

5.98%

GB

3.68%

5.43%

5.56%

11.30%

17.83%


MLB RHH

LF %

LCF %

CF %

RCF %

RF %

POP

0.62%

0.58%

0.47%

0.83%

1.07%

FLY

5.69%

8.02%

5.99%

7.10%

3.93%

LD

5.38%

5.23%

3.50%

4.06%

2.43%

GB

18.54%

11.66%

5.72%

5.58%

3.51%


With this information, I could get to work on estimating the number of fielding opportunities for each position. The first thing to do was to find the number of balls put in play against the Cubs for their 6149 PAs. For right handed batters I took the 6149 PAs * 58% (percentage of RHH) * 68.77% (percentage of balls put in play by RHH). For left handed hitters it was 6149 * 42% * 67.76%.

Unfortunately, this is where I ran into a small problem. I don’t know which balls hit in an area are attributed to which fielding position. For example, I don’t know what proportion of line drives to right field are caught by the first baseman, and what proportion is considered a ball the right fielder should field. This information is likely available, but I do not have it, and could not find it. If someone does find it, I would love to be able to do this more accurately. As it stands, I made educated guesses. The estimated fielding opportunities for each position, broken down by handedness, are as follows for Cubs fielders:

(Percent chance a ball in play was hit into that position’s area, and actual total number of fielding opportunities from last season in parenthesis)

1B: 93.88R (3.83%), 244.35L (13.96%)

1B Total:  338.23 (333 actual)


2B: 223.67R (9.12%), 273.44L (15.63%)

2B Total: 497.11 (496 actual)


3B: 351.59R (14.34%), 69.12L (3.95%)

3B Total: 420.71 (424 actual)


SS: 415.05R (16.92%), 170.37 (9.74%)

SS Total: 585.42 (584 actual)


LF: 459.42R (18.73%), 217.04L (12.40%)

LF Total: 676.46 (676 actual)


RF: 280.80R (11.45%), 331.27 (18.93%)

RF Total: 612.07 (662 actual)

(Estimations attempted to keep close to the actual number and proportion of fielding opportunities. I could not get it to happen properly for RF. It will have to be ironed out at a later date.)

III. Estimating the number of fielding opportunities and runs when shifting

The first thing worth mentioning is the total number of additional runs saved depends entirely on how often a team chooses to run this particular shift. When estimating for the Cubs, I chose to run this shift 25% of the time against all batters (Normally, one might only shift against left handed hitters, but the data suggests that Darwin Barney may be better off playing shortstop than Starlin Castro, so the Cubs will be shifting 25% of the time against all hitters). The first thing to do is to find out a position’s number of fielding opportunities when it is shifting to cover someone else 25% of the time, and when it is covered 25% of the time.

When covering, this is done by taking the number of fielding opportunities when the ball is more likely to be hit at them (like when a 1B is facing a LHH) + 25% of the position being switched to (3B against RHH) + 75% of opportunities when the ball is less likely to be hit at them (1B against RHH). So, a 1B would be playing 1B against every LHH, 3B against 25% of RHH, and 1B against the other 75% of RHH. For being covered, it is the opposite. All fielding opportunities when it is less likely to be hit at them (1B against RHH) + 25% of the alternative position (3B against LHH) + 75% of their original opportunities (1B against LHH). The new total number of estimated fielding opportunities for covering and being covered is as follows:

1B

Original: 338.23

Covering: 402.66

Covered: 294.42

2B

Original: 497.11

Covering: 544.95

Covered: 471.34

3B

Original: 420.71

Covering: 464:52

Covered: 356.28

SS

Original: 585.42

Covering: 611.19

Covered: 537.58

LF

Original: 676.46

Covering: 705.02

Covered: 631.80

RF

Original: 612.07

Covering: 656.72

Covered: 583.51


Essentially, this would get your strongest fielders more fielding opportunities, provided they are still strong after making the transition. Converting the previous formula to runs is simple, since we took both the regular and alternative position’s TZ and DRS runs per fielding opportunity. So for covering this becomes the more likely side * TZ(or DRS)/Fld + 25% of the alternative position’s strong side * AltTZ(or AltDRS)/Fld + 75% of the original weaker side * TZ/Fld. For being covered, the runs per fielding opportunity are added into that previous formula in the same way. That gives us the total number of runs for covering and being covered as follows:

Pos

Covering TZ

Covering DRS

Covered TZ

Covered DRS

1B

7.10

17.53

5.92

13.79

2B

9.19

9.28

8.27

8.30

3B

0.86

6.48

0.33

4.59

SS

-6.08

-6.15

-5.36

-5.42

LF

6.14

-3.39

5.51

-3.03

RF

-10.70

-0.64

-9.59

-0.72


When optimizing the lineup, since one of each pairing (1B-3B, 2B-SS, LF-RF) must be covered, both Total Zone and Defensive Runs Saved agree that 1B should cover for 3B (due to a love of Rizzo’s defense. TZ would disagree if Valbuena had played the whole year) and 2B should cover for SS (both metrics love Barney and dislike Castro). They disagree on RF and LF, where TZ thinks LF should cover, and DRS thinks RF should cover.

If optimized for Total Zone runs, shifting 1B-3B, 2B-SS, and LF-RF 25% of the time results in a total TZ runs for these positions of 7.81, which is a 2.81 run improvement over the original lineup.

If optimized for Defensive Runs Saved, shifting 1B-3B, 2B-SS, and RF-LF 25% of the time results in a total DRS of 22.31, which is a 2.31 run improvement over the original lineup.

IV. Conclusions

Running this shift for the Cubs 25% of the time resulted in a gain of 2-3 runs over the course of the season. This is not an insignificant amount of runs, but there are some things that need to be mentioned.

1. This shift is run 25% of the time against the average for left and right handed hitters. If a team is really going to shift 25% of the time in this method, they will do it against the 25% most extreme pull hitters for each handedness. I do not know the batted ball profiles of the most extreme pull hitters, but it would result in more fielding opportunities when covering, and fewer when being covered. This would likely increase the total number of optimal runs gained significantly. Since I do not have those profiles, I am unsure by what specific margin, but I would love to be able to know.

2. This enables you to somewhat “hide” a poor fielder, particularly at first base. The greatest difference in the odds of a ball being hit at them is between first and third base. If one fielder was particularly poor, you could make sure the odds of a ball being hit to him were always low. The greater the difference between the positions being switched, the greater the overall runs gained are for the season.

3. The Cubs were a terrible team to choose. I initially thought of this idea as I was speaking with a member of their front office, so I did this work on their team specifically. The reason the Cubs are a poor team to choose is because the disparity between the positions being switched is relatively small, except for 2B-SS which has a smaller impact. As mentioned above, this results in a smaller amount of runs gained. A team with a large disparity between first and third would see a far greater impact, particularly with a very good third baseman and poor first baseman due to the transition between positions. I will likely do this with additional teams in the future.

4. As mentioned, this was only run 25% of the time. The more often it is run, the more total runs will be gained.

5. This could be done far more accurately. I do not have all the information I would like available to me right now. I know that an entity like Baseball Info Solutions already records batted ball data to a large number of vectors on the field, as that is how DRS is calculated. That information could be used to come up with far more accurate results in terms of the exact likelihood a batted ball will be fielded by a specific position.

6. The transitions between various positions vary widely on an individual basis. I used the average numbers over a very large sample, so it should be a decent approximation, but every player is different. For every player that went from a very poor shortstop to an excellent second baseman, there is one who performed worse in the same transition. However, due to the transition values roughly lining up well with the positions that are generally known as being difficult, I have no issue with using them.

7. I did not look into whether shifting defensive positions could come with a reduction offensively. Theoretically, a player may slide a bit if he has to focus more attention on fielding multiple positions. I have not yet looked into this. If such a reduction exists, it could possibly be neutralized by an organizational philosophy embracing positional flexibility as players develop.

Overall, the Cubs could likely gain around 3 runs by shifting 25% of the time. If a team has a greater difference between fielders, and shifts with greater frequency, I don’t think it’s unreasonable to expect that team to improve by 1-2 wins over the course of the season. Shifting has grown far more popular lately, and it has been demonstrated to improve overall defense. I believe this is an extension of shifting. It makes sense to shift your fielders to where the other team hits the ball most. It also makes sense to shift players in this manner, and give your better fielders more opportunities to field the ball while giving your poorer fielders fewer opportunities. If you’re going to put a fielder where they hit the ball most, you might as well make it the fielder that is most likely to make a play.

V. A more extreme example

When I wrote this article a few days ago (but hadn’t decided to post it yet) I mentioned that the Cubs were not the greatest choice of team. So, I ran it on a more extreme example, and with greater frequency. As far as frequency is concerned, I upped it from 25% of the time to 50% of the time. For the team, I needed a team with an excellent third baseman, and below average first baseman. The first team that I thought of was the Orioles, so that is the team I used. Considering this is just a quick example to demonstrate the top end of the spectrum rather than the bottom, and the process was not changed, I will not walk through the process in detail again and will just provide the total runs.

If optimized for Total Zone runs, shifting 3B-1B, 2B-SS, and RF-LF 50% of the time results in a total TZ runs for these positions of 49.34, which is a 15.34 run improvement over the original lineup.

If optimized for Defensive Runs Saved, shifting 3B-1B, SS-2B, and LF-RF 50% of the time results in a total DRS of 44.65, which is a 14.65 run improvement over the original lineup.

(For reference, the Orioles when run 25% of the time were approximately an 8-9 run improvement)

With the same potential improvements and diminishments as mentioned in the first example, this is more of an idea of the top end of the spectrum. The Orioles, already a strong defensive team, could potentially gain about 1.5 wins by shifting in this manner 50% of the time. There are definite caveats to consider and improvements to make, but shifting like this could have an extreme defensive impact.


Revenue Sharing Deal Cubs Struck with Rooftop Owners Holding Up Wrigley Field Renovations

During the 2013 baseball season, the City of Chicago approved a $500 million plan to renovate Wrigley Field and build an adjacent office building and hotel.  Included in the renovation plan is the proposed construction of a large video board behind the left field bleachers and signs advertising Budweiser behind the right field bleachers.  The Cubs have delayed the start of this project, however, because the owners of the rooftop businesses across from the ballpark have threatened to file a lawsuit against the Cubs because the proposed signage will obstruct the views of the field from their respective rooftop businesses.

Rooftop Litigation History

Detroit Base-Ball Club v. Deppert, 61 Mich. 63, 27 N.W. 856 (Mich., 1886)

Disputes over neighbors viewing ballgames are nothing new.  In 1885, John Deppert, Jr. constructed a rooftop stand on his barn that overlooked Recreation Park, home to the National League’s Detroit Wolverines, future Hall of Famer Sam Thompson and a rotation featuring the likes of men named Stump Wiedman, Pretzels Getzien and Lady Baldwin.  The Wolverines claimed that they had to pay $3000 per month for rent and that the 50 cent admission fees, helped to offset this cost.  They were thereby “annoyed” by Deppert charging people, between 25 to 100 per game, to watch the games from his property and asked the court to forever ban Deppert from using his property in this manner.

Deppert countered that the ballgames had ruined the quiet enjoyment of his premises, that ballplayers often trespassed on his land in pursuit of the ball and that he often had to call the police to “quell fights and brawls of the roughs who assemble there to witness the games.”  He further claimed that his viewing stand had passed the city’s building inspection and that he had the legal right to charge admission and sell refreshments.

The trial court dismissed the Wolverines case and the ball club appealed.  The Supreme Court of Michigan agreed that the Wolverines had no right to control the use of the adjoining property; therefore, Deppert was within his rights to erect a stand on his barn roof and sell refreshments to fans that wanted to watch the game.  Furthermore, there was no evidence that Deppert’s rooftop customers would otherwise have paid the fees to enter Recreation Park.

Similarly, the rooftops of the buildings across the street from Shibe Park were frequently filled with fans wanting a view of the Philadelphia Athletics game action.  While never happy about the situation, Connie Mack was pushed too far in the early 1930s when the rooftop operators started actively poaching fans from the ticket office lines.  Mack responded by building the “Spite Fence,” a solid wall that effectively blocked the view of the field from the buildings across 20th Street.

Lawsuits were filed but the “Spite Fence” remained in place throughout the remainder of the use of Shibe Park, later renamed Connie Mack Stadium.

The Current Dispute

Chicago National League Ball Club, Inc. v. Skybox on Waveland, LLC, 1:02-cv-09105 (N.D.IL.)

In this case, the Cubs sued the rooftop owners on December 16, 2002 seeking compensatory damages, disgorgement to the Cubs of the defendants’ profits and a permanent injunction prohibiting the rooftop owners from selling admissions to view live baseball games at Wrigley Field, among other remedies and under several causes of action.  According to the complaint, the Cubs alleged that the defendant rooftop operators “…have unlawfully misappropriated the Cubs’ property, infringed its copyrights and misleadingly associated themselves with the Cubs and Wrigley Field.  By doing so, Defendants have been able to operate multi-million dollar businesses in and atop buildings immediately outside Wrigley Field and unjustly enrich themselves to the tune of millions of dollars each year, while paying the Cubs absolutely nothing.”

In their statement of undisputed facts, the defendants countered that the rooftops had been used to view games since the park opened on April 23, 1914 as home of the Chicago Federal League team and that the Cubs conceded that their present management knew the rooftop businesses were selling admissions since at least the late 1980s.

In May 1998, the City of Chicago enacted an ordinance authorizing the rooftops to operate as “special clubs,” which allowed them to sell admissions to view Cubs games under city license.  The City wanted their piece of the action and interestingly, the Cubs made no formal objection to the ordinance.  Based on the licensure and lack of any opposition from the Cubs, the rooftop owners made substantial improvements to enhance the experience and to meet new City specifications.

By January 27, 2004, the Cubs had reached a written settlement with owners of 10 of the defendant rooftop businesses which assured that the Cubs “would not erect windscreens or other barriers to obstruct the views of the [settling rooftops]” for a period of 20 years.  The remaining rooftop owners later settled and the case was dismissed on April 8, 2004, just days ahead of the Cubs home opener set for April 12th.

After the 2004 agreement legitimized their businesses, the rooftop owners made further improvements to the properties.  Long gone are the days that a rooftop experience meant an ice-filled trough of beer and hot dogs made on a single Weber.  The rooftop operations are now sophisticated businesses with luxurious accommodations, enhanced food and beverage service and even electronic ticketing.

As a result of the settlement agreement of Cubs’ 2002 lawsuit, the team now has legitimate concerns that a subsequent lawsuit by the rooftop owners to enforce the terms of the contract could ultimately result in the award of monetary damages to the rooftop owners; cause further delays in the commencement of the construction project due to a temporary restraining order; or, be the basis of an injunction preventing the Cubs from erecting the revenue-producing advertising platforms for the remainder of the rooftop revenue sharing agreement.

It is obvious that the rooftop owners need the Cubs more than the Cubs need them; however, the Cubs wanted their piece of the rooftop owners’ profits (estimated to be a payment to the Cubs in the range of $2 million annually) and now the Cubs have to deal with the potential that their massive renovation project will be held up by the threat of litigation over the blocking of the rooftop views.