The Launch Angle Revolution May Save Lives

Mark J. Rebilas-Imagn Images

It’s not news to anyone that being on the receiving end of a 100-mph fastball is an unpleasant experience, but it’s easy for players and fans alike to forget that this little projectile is in fact a deadly weapon. While the tragic death of Ray Chapman along with decades of bruises and broken bones have spurred hitters to don an array of protective items in the box, our baseball culture does not afford pitchers the same protections. This is despite the fact that batted balls regularly exceed the speeds of the fastest fastballs, and occasionally top 120 mph, which may approach the limits of human reaction times at that distance. Additionally, while hitters are selected for their superhuman eyesight and reaction skills, those attributes are generally less important for pitchers. The issue may be further exacerbated by the increasing emphasis on exit velocities in modern hitting analytics:

hard hit rates

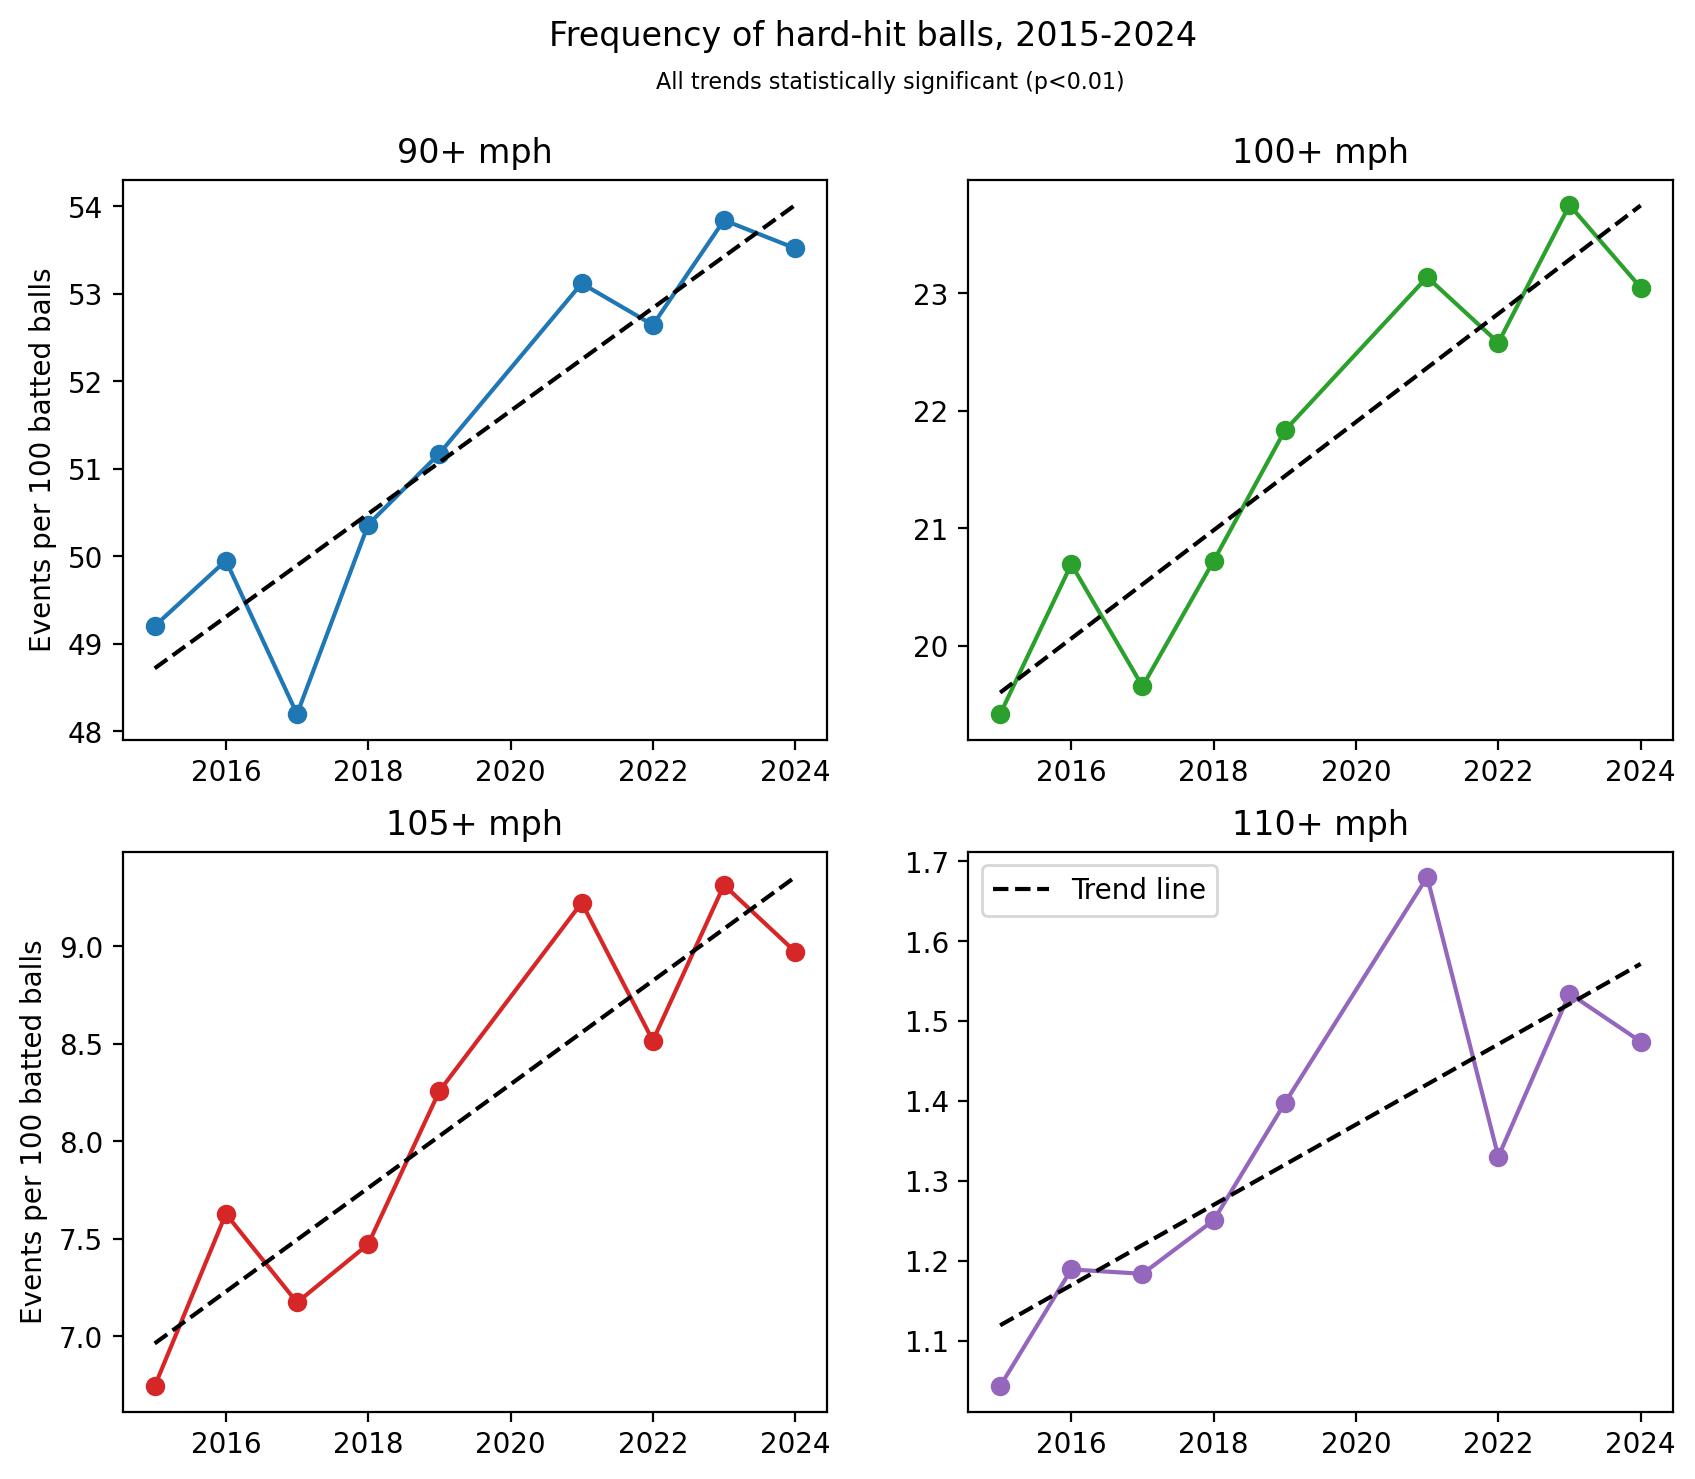
That’s a concerning chart. In particular, notice the difference in scales across the panels; while the frequency of batted balls with exit velocities of at least 90 mph has increased by 8.7% in this span, batted balls hit 110+ mph occur a full 41% more often now than they did in 2015! Let’s find out if this trend is putting our already-fragile pitchers at even more risk. Read the rest of this entry »


Predicting wOBA Using Process-Based Statistics

When trying to determine a batter’s overall offensive value using a single statistic, one of the most popular metrics to use is weighted on-base average (wOBA). wOBA is calculated as a ratio of a linear combination of “outcome” statistics (unintentional walks, hit-by-pitches, singles, doubles, triples, and home runs) divided by, essentially, the number of plate appearances.

With that being said, could one predict whether a given player’s wOBA will be above a certain threshold using “process” statistics such as plate discipline and batted ball parameters? In particular, if we know a player’s zone contact rate, chase rate, and average exit velocity, could we predict with any confidence whether that particular player’s wOBA will be above, say, .320?

Using Statcast data and a bit of machine learning, I have decided to train a shallow neural network to try to do just that. I’ll be using snapshots of the Jupyter Notebook throughout the analysis to try and make it a little easier to follow. Read the rest of this entry »


Using the Toxicological Prioritization Index To Visualize Baseball

Major League Baseball is awash in advanced statistics that more reliably describe key aspects of players’ offensive and defensive performance. It has been reported that through the use of Statcast, the MLB Advanced Media group can supply teams with 70 fields x 1.5 billion rows of data per season [i]. Yes, billion with a b. This flood of information has supercharged MLB teams’ and the sabermetric community’s development of ever-more useful statistics for describing player performance.

However, this amount of data brings significant challenges. Perhaps chief among them is that while certain individuals may be comfortable with reams of tables and ever-increasing numbers of descriptive statistics, many others prefer or require analyses and visualization tools that convert disparate metrics into informative and readily interpretable graphics.

MLB’s situation has certain similarities to the discipline of safety toxicology, where the use of high-information content assays for characterizing chemicals’ toxicological profiles has exploded [ii]. Drawing conclusions from multiple biomarkers and test systems is challenging, as it requires synthesis of large amounts of dissimilar data sets. One tool that toxicologists have found useful is the Toxicological Prioritization Index, or ToxPi for short [iii]. ToxPi is an analytical software package that was developed to combine multiple sources of evidence by transforming data into integrated, visual profiles. Read the rest of this entry »


Analyzing the Draft

Ever since the MLB draft was created in 1965, teams have been searching for any competitive edge to separate themselves from the rest of the league. After all, it is one of the best ways to acquire young affordable talent for your organization. Not picking the best players available is a huge missed opportunity for any club and can set the organization back for years. It can also exasperate even the most devoted fans. It is imperative to have successful drafts every year, but what constitutes a successful draft? How many major leaguers are available in a draft and where can you find these players? These are some of the questions I hope to answer.

Methodology

Much of my analysis in this article will include references to team-controlled WAR. I calculated each draftee’s WAR total by summing their pitching and hitting WAR totals for the first seven years of their career to estimate the amount of value they provided their clubs before the players were eligible for free agency. This method is not perfect, because it does not consider demotions to the minor leagues, and it incorrectly assumes that every team would keep their prospects down in the minors to gain an extra year of control. However, I believe that the first seven years of WAR in a player’s career is a valid estimation of the value a player provides his organization before he exhausts his team-controlled seasons.

The drafts being examined are the drafts that took place from 1965 to 2004. I chose to stop at 2004 because that was the last year that had every player in its draft class exhaust his team-controlled seasons. If I were to include more recent drafts that still have active players, I could draw erroneous conclusions, since these players still have time to make their major league debuts and accumulate more WAR in their team-controlled seasons. Read the rest of this entry »


Studying Release Point Standard Deviation From Center

A few summers ago, Walker Buehler and the Los Angeles Dodgers came to Baltimore at the very end of the season. That night my buddy and I couldn’t figure out why the Dodgers, and the overwhelming mass of their fans in attendance, were so pumped about winning a single game in Baltimore. Once we saw staffers in ties and headsets running out with the “Division Champions” t-shirts, we realized what was going on.

Needless to say, Buehler was excellent, going 7 innings with 11 Ks and — because it was the 2019 Orioles — gave up no runs on four hits. During the game, while surrounded by very excited Dodgers fans, I mentioned that Buehler’s delivery seemed so efficient that his motion looked exactly the same every time he threw the ball. If you’ve ever worked on physical mechanics of any kind, be it baseball swings, golf swings, freestyle swim stroke, running stride, or maybe just proper form sitting at a desk to avoid that “work from home/pandemic backache,” you know how hard it can be to exactly replicate a motion over and over again. Buehler amazed us in his ability to do just that. We know that repetition in delivery mechanics leads to success in various forms, so with that in mind, the point of this analysis is to look at release point consistency and how that correlates with resulting pitching metrics. Read the rest of this entry »


How Much Value Is Really in the Farm System?

Everyone knows that a strong farm system is key to the long-term success of a major league organization. They make it possible for clubs to field competitive teams at affordable salaries and stay beneath the luxury tax threshold, but how much value can an organization truly expect from their farm system? How much more value do the best farm systems generate compared to the worst ones? I decided to take a closer look.

Methodology

The first thing I did was gather the player information and rankings from the Baseball America’s Prospect Handbooks from 2001-14 and entered them into a database. I then found players’ total fWAR produced over the next six seasons, and I added them together to find the values that each farm system produced. I chose six seasons to ensure that teams wouldn’t get credit for a player’s non-team-controlled years, since the value produced would not be guaranteed for the player’s current organization. This method will reduce the total value produced by players that are further away from the majors, but the purpose of this analysis is to focus on the value of the entire farm system and not an individual player’s value over the course of their career.

Let’s look at the 2014 Minnesota Twins as an example. Below is a list of the thirty players that were ranked and the amount of WAR that each player has produced by season. Read the rest of this entry »


Reworking and Improving the Outcome Machine

This post was inspired by a couple of articles that I remembered reading from Jonah Pemstein back in 2014. The intention of those posts was to predict the result of any given batter/pitcher matchup, dubbed the “Outcome Machine.” Have you ever wondered what the probability Mike Trout strikes out when he steps into the box against Justin Verlander? Of course, there are variables that are specific to any plate appearance (umpires/situation/stadium/etc.) that are harder to quantify, but it set out to predict the outcome in a vacuum. Trout vs. Verlander and nothing else (For the record, in 2020, I would estimate the answer is about 27.5%).

Being able to predict the outcomes in sports would take most of the fun out of being a spectator, sure, but I still found myself coming back to those articles. While reading and re-reading in an attempt to understand the logic and fool around with the equations, I came to a few questions of my own:

  • With all of the hubbub of juiced balls and increased launch angles, do equations that were based on data from 2003-13 still apply to the game today?
  • The regression equations were composed of the at-bat result and the stats of the batter and pitcher from the same year. This stuck out to me as an issue because it means the player’s performance later in the season, say in July, influences the prediction of an at-bat in May, and to a lesser extent, the result of that specific at-bat is already baked into that season’s performance. Shouldn’t you use data exclusively before a given at-bat to predict the outcome? Hindsight is 20/20, after all.

Eventually curiosity got the best of me and I decided to emulate the original exercise. Before I really start to nerd out on the inner workings, you can find this iteration of the Outcome Machine as a Google Sheet here. You can either select a pitcher/batter combination through the dropdown or hard key in the rates in a custom, hypothetical matchup below that. League average is set by default to projections for 2020 but can be updated as desired in the custom matchup. I would note that the preset statistics in this tool are total projections for 2020 but not broken out into L/R splits, as to my knowledge that data is currently behind a paywall. Read the rest of this entry »


How Brad Brach Re-Found Success With the Mets

Back in February, Justin Toscano wrote that when the Mets acquired reliever Brad Brach last August, the team asked Brach to do the one thing he couldn’t do with the Cubs in the first half of the season: throw his cutter.

The 6-foot-6, 33-year-old right-hander was designated for assignment by Chicago after signing a $1.65 million deal with the team during the 2018–19 offseason. Brach posted a 6.13 ERA in just 39.2 innings across 42 games for the Cubs in 2019.

After having spent most of the second half of 2019 with the Mets, Brach re-signed with the team on a $850,000 deal, with a player option for 2021, that can increase to $1.25 million with incentives.

From March 27 through August 10 of 2019, among 197 relief pitchers with at least 30 innings pitched during that time frame, Brach ranked 123rd in the league in GB% (41.1%), 70th in K/9 (10.21), 193rd in BB/9 (6.35), and 97th in FIP (4.12). Suffice it to say, Brach was not the most productive pitcher for the Cubs, thus justifying his being DFA’d from the team in the middle of the year.

When analyzing Brach’s career numbers, however, it is clear that his time with the Cubs is not indicative of his overall arc. From 2011–18 with the San Diego Padres and Baltimore Orioles (and half a season with the Braves), Brach pitched to a 3.08 ERA (132 ERA+), a 3.68 FIP, and a 9.6 K/9 in 456 IP.

Prior to 2019, Brach only recorded an ERA over 4.00 once (5.14 in seven innings in 2011 — his first year in the league) and has never allowed more than 28 earned runs in a season. Moreover, since 2013, Brach has posted an ERA+ over 100 in every year but 2019, including a 210 ERA+ in his All-Star 2016 campaign for Baltimore. Read the rest of this entry »


Who Is Yoshitomo Tsutsugo?

Image result for 筒香 嘉智

Last month, the Tampa Bay Rays signed Japanese slugger Yoshitomo Tsutsugo (筒香 嘉智) to a two-year contract for $12 million. If you add the $2.4 million posting fee paid to the Yokohama Baystars, Tsutsugo’s team in the Japanese League, that would make the Rays’ investment at $14.4 million total for two seasons. The 28-year-old left fielder has been expressing his ambition to play in the majors for years, and he finally found the team to play for. Now the question is who this guy is and how he will fit.

Background

Tsutsugo has been one of the top prospects of Japanese baseball since his younger days. He was one of only two freshmen to hit cleanup in his high school team’s history. In his sophomore year, Tsutsugo led his team to the semifinal in Koshien, the biggest high school baseball tournament in Japan, with a .526 batting average, three home runs, and 14 RBIs in three games. It gained him enough attention to play on his country’s national team. In 2009, Tsutsugo was drafted by the Baystars as the first pick in the Nippon Professional Baseball (NPB) League.

Tsutsugo struggled in Japan until 2014. He struck out too much, and frequent injuries prevented him from playing full-time. Until 2014, he only had one season with more than 100 games played (NPB plays 144 per season). However, Tsutsugo started filling up his minimum at-bats, and his OPS has been over .900 every year since. The peak was 2016, when he hit 44 home runs in 133 games with an OPS of 1.110. He also played for Japan in the 2017 World Baseball Classic as the cleanup hitter and proved his power with three home runs and a .680 SLG in seven games. Throughout his nine-year career in Japan, Tsutsugo hit .285/.382/.528, good for a .910 OPS. The average OPS during that time was around .680 to .720. Yokohama’s superstar was truly one of the league’s elite power hitters. Read the rest of this entry »


Shifting Expectation: Analysis of the Shift in 2018

The infield shift is a much-maligned defensive strategy, hounded as one of the worst analytics-based changes to baseball. Multiple times each season there will be some conversation about banning the shift, and each time pros, ex-players/managers, commentators, and analysts will chip in with their two cents. But for now, the shift is here, and it is as popular (with the fielding teams) as it has ever been. Just under 26% of all pitches were thrown with some form of infield shift in place in 2018, 22% of at-bats had a shift for the entirety of it, and 30% had at least one pitch shifted.

As you can see, left-handed hitters are far more likely to be shifted than their right-handed counterparts, with 46% of left-handed ABs seeing a shifted pitch versus 19% for righties. This makes rudimentary sense as the shifted players for a left-hander are closer to first base, so they have a greater chance of impacting the play to first and therefore stopping a potential single.

I have taken players who have 100-plus at-bats in 2018 both against a shifted and non-shifted infield, then I compared the outcomes. There were 132 such players, and their combined number of at-bats was 72,389 (39% of the seasons total). I have split these up into four categories based on the handedness of the batter and the pitcher.

Read the rest of this entry »