I See You, Jake Arrieta

In the last week Ichiro, Tim Lincecum, Carlos Gonzalez, Jonathan Lucroy, Mike Moustakas, and Lance Lynn have all signed. On Sunday, Jake Arrieta joined them, agreeing to a three-year, $75-million contract with the Phillies. That’s an average of a signing a day! Of major leaguers, to major league contracts! The dominoes are certainly falling. Finally.

Arrieta’s signing comes with curiosities. Or maybe more accurately, concerns. He has more than 1,100 professional innings on his arm. From 2014-16 he had a nasty-good run. Toward the end of it, and through 2017, his velo started to dip. Pitch Info tells us he lost two mph off his sinker between 2016 and 2017. His Ks have slightly gone down and his walks have slightly risen. At 32, he’s at an age where it’s fair to begin wondering how much further he could fall, and how quickly.

How does he adapt? Arrieta might be past his peak prime while with the Phillies, but what will he be? What can he be, and what adjustments might it take to get there? The way hitters manufactured production off him last year could help us find a path to that answer.

Arrieta wOBA

Half of his actual weighted on-base averages were higher than what Statcast tells us we should have expected. Arrieta arguably has a skill of inducing weak contact, so what this would seem to suggest is that sometimes, when hitters put the ball in the air against him, he just gets beat. The overall numbers were lower during his run of dominance between 2014 and 2016, but the actual production similarly beat what could’ve been predicted based on the launch angle and exit velocity of balls in play against him.

Beyond that, though, we see a notable split in performance against lefties and righties last year. A single year of batter splits can be dubious, but consider this the New Arrieta; one whose age is revealing diminished skill. Lefties really went to town against his sinker and slider last year. The two pitches break in opposite directions, which makes them excellent sequencing buddies from the same tunnel, but things didn’t play that way for Arrieta last year.

One reason why could be because of the break on Arrieta’s slider. Per Brooks Baseball, he lost .7 inches of horizontal break and .53 inches of vertical break on it. What does that look like? I’m glad you asked.

arrieta visualizer3

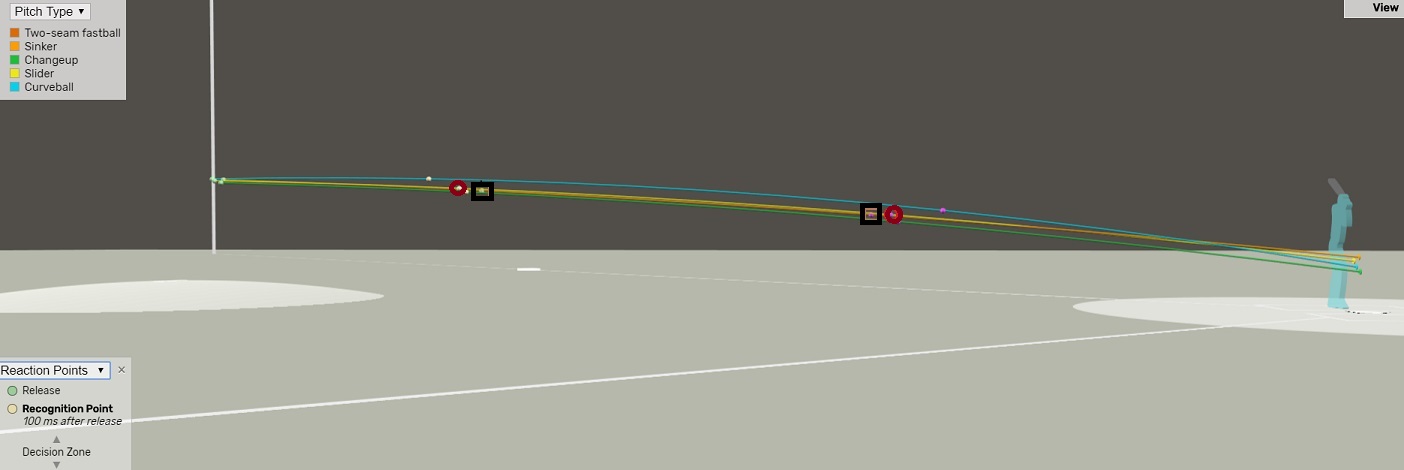
Thanks to Statcast’s incredible, fantastic, super fun new 3d pitch visualizer, we can see how that loss of break on Arrieta’s slider could have impacted its performance against left-handed hitters.

The slider is in red circles. His sinker is in black squares. The ones closer to the mound mark the point at which batters could first recognize the pitch. The ones closer to the plate tell us when batters would have needed to commit to swinging. In 2017, lefthanders saw Arrieta’s slider sooner and were able to decide on swinging against it later than his sinker. Less movement, plus less velo, plus the same tunnel means hitters faced a pitch with very little bite. And that’s how an absurd .509 wOBA happens.

From 2014-16, lefties only generated a .240 wOBA against Arrieta’s slider. Last year’s numbers are probably an outlier, but if the pitch continues to flatten out it could really threaten the viability of one of his weapons. He could consider turning the pitch into more of a true cutter to deliberately make it run further inside on lefties, or he could use it less in favor of the curveball. There’s also a chance he could take a little off the slider to widen the velocity gap with his fastball, but deliberately throwing slower in this context doesn’t seem ideal. 

Arrieta’s going to be an intriguing piece to watch on an increasingly intriguing team. The Phillies are showing they’re getting ready to contend, and his evolution as a pitcher could be key to making it happen.

Pitch mix and wOBA data from Statcast.


What to Expect From J.D. Martinez’s Power in Fenway

Several days ago the Boston Red Sox acquired J.D. Martinez, presumably under the expectation of adding a lot of power to the lineup. Since 2015, he’s eighth in home runs with 105, a league-best .284 ISO (four-thousandths of a point ahead of Nolan Arenado), and his 147 wRC+ puts him at sixth in all of Major League Baseball.

Yes, he can hit for average as well but I’m not interested in that. What I’m curious about is whether or not the famed Green Monster in Fenway Park will be a hindrance to Martinez’s power.

He’ll now be playing 82 games each season in Fenway Park, where every time he comes to bat he’ll have the Green Monster in peripheral view; a 37.2-foot high wall 310 feet down the left field line and as far away as 380 feet at left center. There are dozens of hits every year at Fenway that could have ended up as home runs in other parks, but instead, are eaten up by the Green Monster and spit back out as (extra) base hits.

To attempt to approximate the minimum required launch angle and exit velocity to hit a home run over the Monster, I needed visual proof. Using Baseball Savant, I searched all the home runs hit in Fenway Park during the Statcast era.

I keyed in on home runs specifically hit to left/left center field, spanning the entire range of that monstrosity. Using the spray chart tool, I found any and all homers that were as close to the barrier of the GM (Green Monster) as possible. I came across one that seemed to fit perfectly and cleared the wall just enough.

That’s Steven Souza, Jr. driving a home run under (nearly) perfect metrics to breach the wall.

Just to be certain that this was as close as I could get, I wanted to know what the weather conditions were that day. I was able to find the barometric pressure and how mother nature’s influence could have affected this hit, in terms of exit velocity. Air pressure matters because when its low, baseballs go further due to less friction on the baseball and vice versa.

  • Game time: 1:35 PM
  • Game Duration: 4 hours and 32 minutes
  • Approximate time HR was hit 5:00PM
  • Conditions at time of HR: 50 degrees, light rain, wind blowing NW at roughly 16 MPH with gusts up to 27 MPH
  • Game barometric pressure: A consistent 29 inches

OK, so what jumps out at you? Wind speed, right? All Fenway Park’s contact to left (center) head in a northerly direction. The low barometric pressure and wind speeds give me two possible caveats for this examination.

However, as you see in the GIF, the trajectory was fairly high and it cleared the wall by a couple of feet. It’s impossible to tell if the wind was blowing (and how hard) during Souza’s homer, so keep those things in mind since they are variables that don’t make this investigation exact when applying it to Martinez.

Souza’s hit metrics on that homer were as follows:

  • Breaking ball at 80 MPH
  • 93 MPH exit velocity
  • 33.5-degree launch angle
  • Hit distance of 344 feet

We can use those measurements to get a guesstimate of what Martinez could or would have done hitting regularly in Boston. I produced the following spray chart using his last three seasons under the backdrop of Fenway Park.


J.D. Martinez(2)

Clearly he’s able to hit to all fields; you could suggest that a fair amount of his hard contact is concentrated in the area of the GM and that’s what I’m going to hone in on. Yet with the height of the wall, some of those home runs (hit in other ballparks) could have been inhibited.

I inspected all Martinez’s home runs since 2015, shifted focus to the launch angle and exit velocity using the Souza home run as my model, and ran a query of all his contact using the metrics it would take to clear the wall.

I set the minimum launch angle to 30 degrees, to give a little breathing room because it appears as though Souza’s homer cleared the wall by a foot or two; I did the same for exit velocity, starting it at 90 MPH. For minimum hit projection range, I used the shortest distance to the GM; 310 feet.

Breaking it down even further, I ensured that homers hit to left center had ample room and momentum to clear the wall; e.g. the 310-foot distance wouldn’t work for a ball he actually hit to left center, for example.

Altogether, Martinez had a total of 121 batted ball events under the conditions of my launch angle/exit velocity/distance figures. 24 of those 121 BBEs resulted in contact to left field; 11 would have ended up being GM-clearing home runs if hit in Fenway, but instead were recorded as outs.

So, taking events strictly within the region of left to left-center field in Fenway, Martinez could be expected to hit about 43% more home runs facing the GM over the next three years of his contract.

Remember, that doesn’t include contact to other parts of the field. If you look back to the spray chart, you’ll see several spots marked home runs that would fall short in Fenway.

Furthermore, using his home run total from 2015-2017, we could reasonably surmise that he’ll hit an average of about 35 home runs for the next couple of years. Adding in these 11 outs as home runs, Martinez will be expected to hit roughly 9% more home runs (3 per season) at Fenway, so long as he is a Red Sox.

So, the monster won’t be as problematic as I originally assumed upon hearing of this acquisition for Boston; it might actually improve Martinez’s power.

-This post and others like it can be found over at The Junkball Daily.


Power Relievers and a Third Pitch?

As spring hopes eternal so, too, do the annual Spring Training stories. Guys are in the best shape of their lives or feeling better than they have in years. Or futzing with new pitches. In fact, so many guys try new pitches that Jason Colette keeps an annual, running list of pitchers who are attempting to add to their arsenal. 

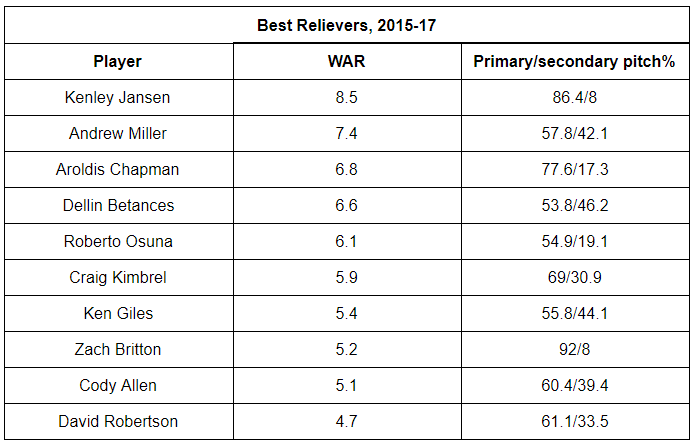
Edwin Diaz is among those attempting to do that this year by adding a changeup to his very fast fastball and exceptionally mean slider. Mariners General Manager Jerry DiPoto says that so far the changeup is “pretty firm.” He also adds that “it could be something in [Diaz’s] back pocket that he can introduce against an occasional lefty.” But does he even need it?

relievers

A glance at the top 10 relievers over the last three years tells us a few things. None of them threw any two pitches at a volume that would allow them to throw a third at a clip of 10% or more. Jansen’s and Britton’s numbers don’t even facilitate doing it for a second pitch! That 10% seems to be the tipping point at which an offering is actually useful to a pitcher. That’s when a hitter has to be accountable to it, or at least be aware of it in the back of his head. Less than that and they can take their chances focusing on what they know is coming more than 90% of the time.

The lone near-exception in this group is Roberto Osuna. After his fastball and slider, he’s thrown a cutter 9.4% of the time. He’s thrown a changeup slightly less than that (8.4) and a sinker slightly less than his change (7.4). While his repertoire might be an outlier compared to his peers, he still falls short of the 10%-per-offering threshold.

It’s important to acknowledge that each reliever’s primary and secondary pitch types aren’t listed above. They all throw different stuff. But what they use, they use similarly. In this sense, it’s kind of like taking different routes to the same destination, but each one takes the nearly same amount of time. Looking at each reliever’s individual splits shows us that almost all of them also faced a relatively even amount of right-handed and left-handed hitters. Only Miller, Chapman, and Britton had splits that tilted more distinctly one way, and that was against righties. None faced notably more lefties.

And that brings us back to Diaz. He, too, has faced more righties than lefties so far in his time in the bigs, about 14% more. Adding a pitch specifically to focus on hitters he’s seen less of, in anticipation that he might see them more, seems premature at best. Remember, the M’s moved Diaz to the bullpen because he couldn’t develop a third pitch to stick in the rotation. That’s how we get a lot of our power relief arms. As a starter, that third pitch is way more critical because of the volume of hitters per appearance. For relievers — especially the dominant ones, which Diaz is capable of being — the lack of volume is by design.

Odds are that Diaz stops fiddling with a changeup and just keeps throwing his fastball and slider as the season gets going. But nonetheless, the situation feels like trying to push a buoy underwater. It’ll just keep bobbing back up. And why the Mariners would advocate for it in this context, whether passively or actively, is very, very confusing to me.

In my day job, I’m an educator. For every lesson planned, there’s a constant inner monologue, a series of cascading questions. What’s the best way to approach the day’s goal? Does this lesson serve the unit? If not, does the lesson have enough value to still include or would it just be empty fun? What questions can I anticipate, and what answers could I have ready?

If I were the Mariners, I wouldn’t plan for Diaz to throw a changeup. If he asked to do it, I’d conference with him about why he thinks it would be effective. I’d speak to him, with evidence, about why it might be cool, but emphasize that it’s definitely not necessary to succeed. I’d map out why it makes sense for him to just throw that dang slider.

But alas, I’m not the M’s.

Data from Fangraphs.


Do Teams That Shift More Have Lesser Defenders?

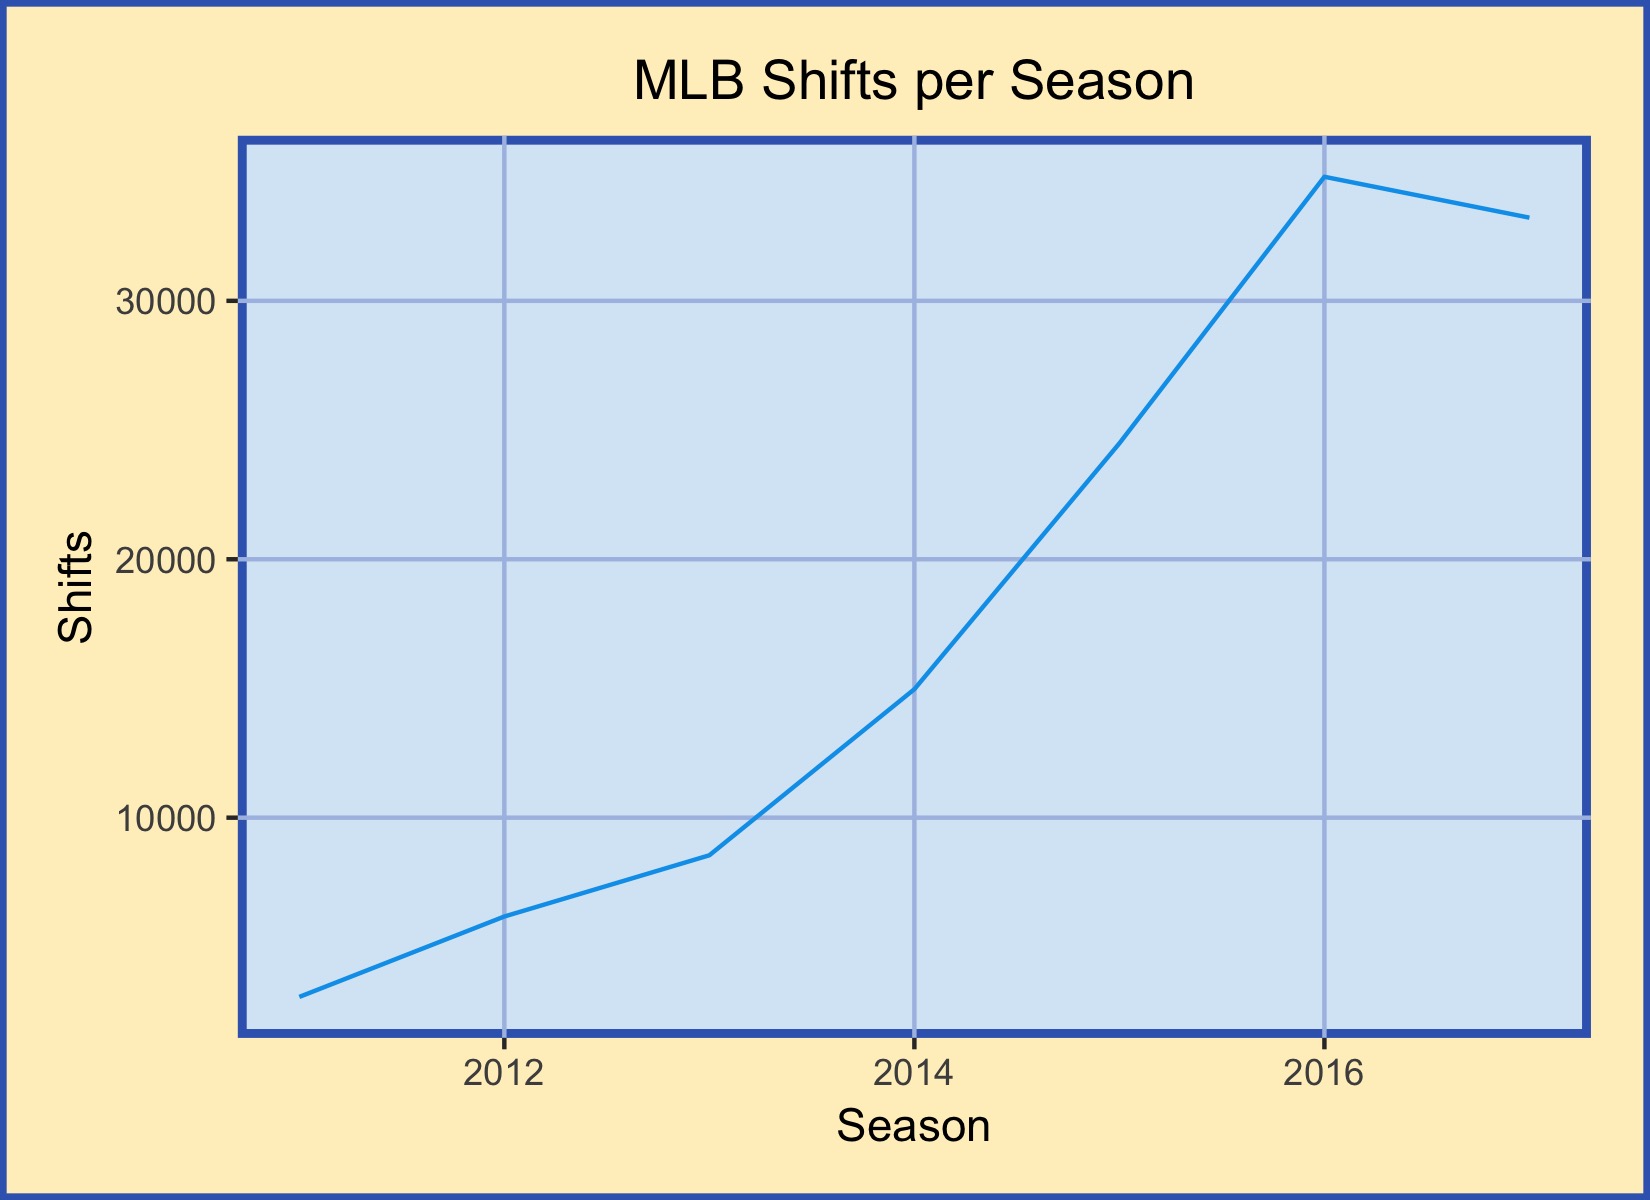
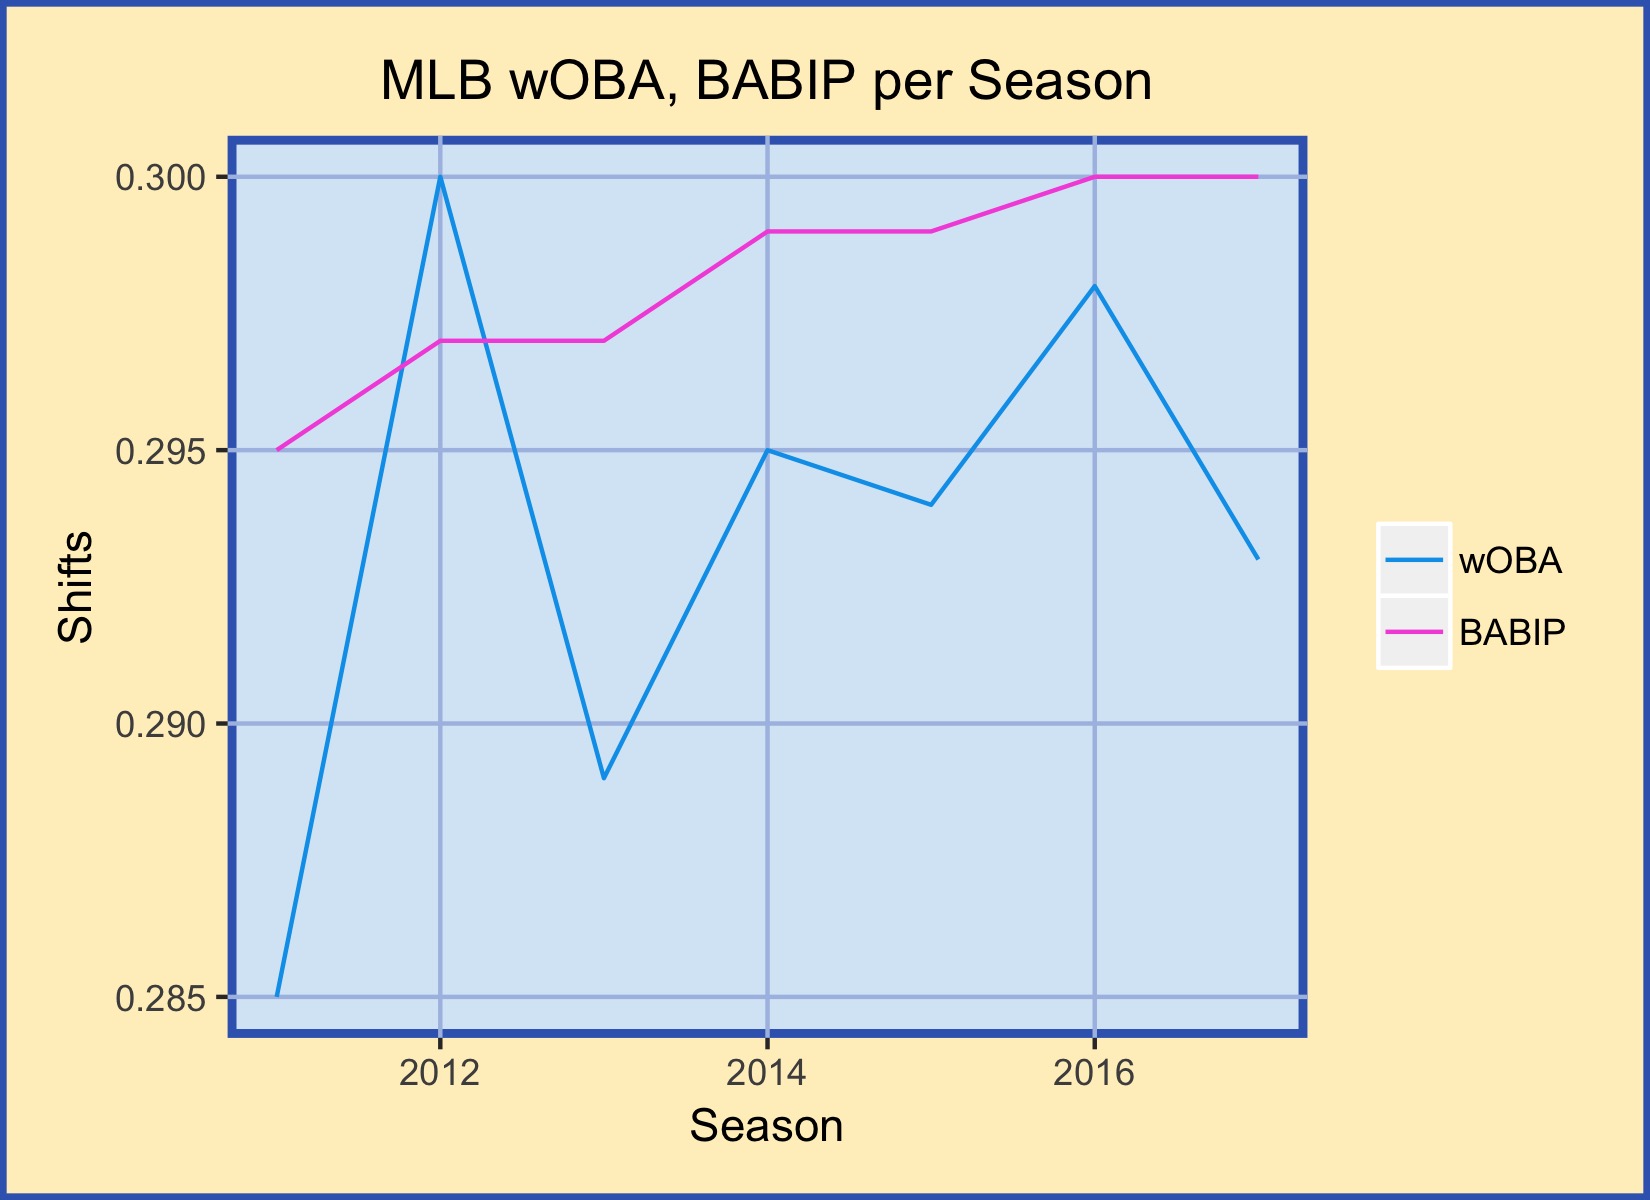
Defensive shifts are designed to prevent hits. By placing fielders in spots of higher hit frequency, the logic follows, fewer batted balls will drop in as hits. Notably, though, as the number of shifts has drastically increased, the league-wide BABIP hasn’t changed. Since 2011, shift deployment has increased tenfold (though BABIP has actually increased 1.7% – .295 in 2011 to .300 in 2017). Better positioning could lead to teams utilizing fielders who have less range, as they’d be located closer to batted balls. Do teams who shift frequently employ worse-ranged fielders?

First, the recent MLB environment. Through a combination of enhanced analysis and deeper data, teams across MLB are increasing shift usage. Positioning fielders in locations of high hit density, for specific batters, allows them to field more batted balls. Every team is increasing their shift usage, driving the total shifts deployed up.

shifts_league

The intuitive result of this would be batters are recording fewer hits. As fielders field more balls, they should convert more of those previously-hits into outs. However, league-wide BABIP has actually increased as shift usage increased. Perhaps the quality of the batted balls has decreased, though – trading doubles and triples for singles. According to the league-wide wOBA, though, the overall quality of offense has increased.

woba_league

Clearly, shifts aren’t having the effect one would expect them to have. Rather than explore what effect they do have (as if they had no effect, why would teams continue to shift?), I want to see if perhaps the defenders being used are worse. Perhaps shifts have allowed teams to mask poor defenders with better positioning.

After browsing the data, I thought it was best to compare year-to-year changes in range runs saved above average to changes in shift deployment, in attempts to analyze the effects of a large change in shift use on range runs above average (RngR). This variable doesn’t measure data for shifts — any shift-influenced batted balls are excluded. This exclusion is what makes RngR perfect for analysis — we can isolate plays which are standard and similar fielder-to-fielder and control for frequency of shifts.

To do this, I first prorated range runs above average to a 150 defensive game rate (RngR.150), as each team had slightly different innings totals. I then took the year over year difference in RngR.150 as RangeDiff, to analyze changes in range runs above average. Similarly, I took the year over year percentage changes in shift deployments. Due to the drastic increase in shift usage across the majors, comparing these absolute numbers would be meaningless here, so I scaled these percentage changes to each season’s average change in shift usage. This variable, ShiftScaleYOY, represents a team’s shift usage change as standard deviations above or below the season average change. All this data is from Fangraphs, 2011-2017 team defense statistics and shift deployment.

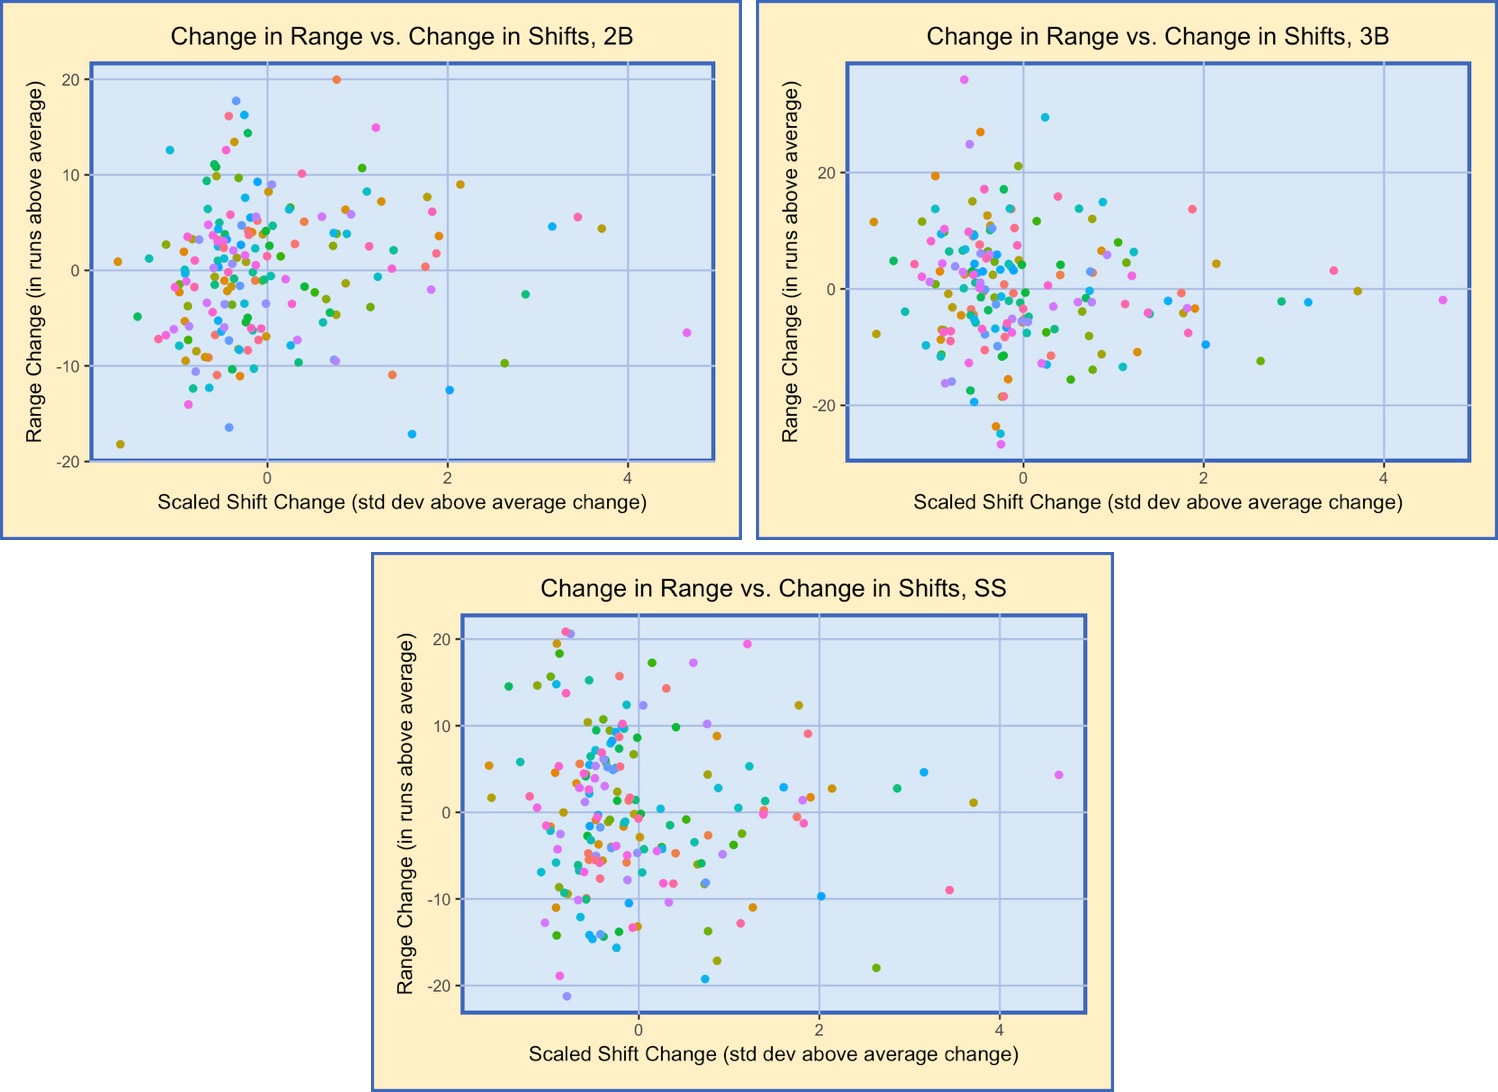
My hypothesis is that teams that have a drastic increase in shift usage between seasons, compared to league-average, would have worse defenders, as measured by range. The results:

positions.jpg

First, notice the axes. Third basemen have a larger variance. Teams with larger increases in shift usage year-to-year, relative to the rest of the league during this same time periods, appear to have defenders at third with range values closer to zero. This is difficult to see through inspection, however. There doesn’t appear to be much of a relationship with 2nd basemen or shortstops.

When I regressed the between-year standard deviation measurement of shift changes on between-year range change, with dummies for position and season, the shift change variable was insignificant. In fact, there were no significant variables, and the R-Squared was merely .13%. Notice the symmetry in the above graphs, though. A team’s range values seem to converge as the team’s standard deviation of shift changes increases.

To explore this, I ran two regressions, with subsets where the dependent variable, Range.150, was positive and negative. The positive regression had an R-Squared of 9.2%, implying it poorly describes the variance in positive Range changes year-over-year. 2017, 3B and SS were all statistically significant, at the 99% confidence level. This implies that there is a 2.15 range per 150 defensive games decrease in 2017 versus the other seasons, that there is a 1.5 run increase for being a third baseman and a 1.4 run increase for being a shortstop over a second baseman. The negative regression had an R-Squared of 8.6%, again implying this model poorly describes the variance in the data. Here, however, 2017 and 3B both were statistically significant, at the 99.9% or greater confidence level. The values were greater, but the direction of implication was the same – 2017 implies a 2.7 run increase, and a third baseman has a 2.4 run decrease over second basemen. These analyses suggest that 2017 resulted in fewer outlier defenders and that third basemen were higher variance than second basemen.

There are a few issues or improvements with this analysis that could be made. First, publicly available data is limited – comparing shifted plays and non-shifted plays would be best for this analysis. What I did could be seen as cursory, at best an introduction. Secondly, the sample size of defensive shift data is small. Defense data for individual, full-time players is generally utilized in three-year samples, and I was using single-year measurements (albeit at the team level, slightly larger samples per position than individual players). Lastly, a deep analysis on shift impacts on player abilities would use individual players – comparing his or her defensive prowess on shifted and non-shifted plays. This would allow us to try to measure the impact of shifts on defensive performance, to better understand if teams would employ different-skilled players as they increase shift usage or if their players perform differently with shift usage.

There are suggestions in the data that certain years or positions differ with respect to defensive range. Nothing suggested relative increases in shift usage impacts range or quality of defenders on the field. All in all, I think this study can be summarized by the wisdom of Albert Einstein: “the more I know, the more I realize how much I don’t know.”


– tb


Will We See a Record Number of Three True Outcomes Specialists in 2018?

Last season was the year of the three true outcomes specialist.  Aaron Judge’s dominant three true outcomes season was the most prominent example of this: he ranked second in home runs (52) and walks (127) and first in strikeouts (208).  In total, 57% of his plate appearances resulted in one of the three true outcomes.  He was the American League Rookie of the Year and in the running for the 2017 American League Most Valuable Player award, finishing second.  His performance helped the Yankees reach the American League Division Series.

We know that the three true outcomes rate has been increasing.  In part, this is due to the average player increasing his rate of home runs, strikeouts and walks.  But there is also the unusual player in the mold of Judge who takes an extreme approach at the plate resulting in dominant three true outcomes seasons.  The number of these hitters has been increasing over time.

Figure 1. Three True Outcomes Specialists per Season, 1960-2017

View post on imgur.com

Figure 1 shows the number of dominant three true outcomes player seasons over time.  To get here I examined all players since 1913 with at least 170 plate appearances in a season.  I considered a dominant season one with a three true outcomes rate of at least 49%.  There have been 132 player seasons with a three true outcomes rate of at least 49%.  All of them have taken place after 1960.

The graph shows that the number of dominant seasons has been increasing over time.  Since Dave Nicholson first did it in 1962, most years have had at least one player cross the threshold.  Since 1994, every season has had at least one.  From 2001 to 2010 there were four seasons with five three outcomes hitters.  There was six in 2012 and eight in 2014.  The trend is currently peaking with 13 in 2016 and 16 in 2017.  The trend is a bit more extreme but similar to the average increases in three outcomes rates over time.  It seems that more players pursue (and teams tolerate) an approach to hitting that includes extreme rates of the three outcomes.

It is worth pointing out that those 16 players in 2017 account for about 4% of all players with at least 170 at-bats.  Three true outcomes specialists are more common but still rare.  Who are those 16 players?  Table 1 lists them including the home run, walk and strikeout rates, and the combined three true outcomes rate for the year.

Table 1. Three True Outcomes Specialists, 2017

Player HR/PA BB/PA SO/PA TTO
Joey Gallo 8% 14% 37% 59%
Aaron Judge 8% 19% 31% 57%
Ryan Schimpf 7% 14% 36% 56%
Chris Davis 5% 12% 37% 54%
Miguel Sano 6% 11% 36% 53%
Alex Avila 4% 16% 32% 52%
Mike Zunino 6% 9% 37% 51%
Drew Robinson 5% 12% 35% 51%
Jabari Blash 3% 14% 34% 51%
Keon Broxton 4% 9% 38% 51%
Chris Carter 4% 10% 37% 50%
Mike Napoli 6% 10% 34% 50%
Kyle Schwarber 6% 12% 31% 49%
Matt Olson 11% 10% 28% 49%
Cameron Rupp 4% 10% 34% 49%
Eric Thames 6% 14% 30% 49%
Jake Marisnick 6% 8% 35% 49%
2017 Averages 3% 9% 21% 33%

The list includes many of the unique player stories of the year.  Aaron Judge’s rookie year was historic.  Joey Gallo made waves, particularly for his extreme three true outcomes rates.  Miguel Sano was an All-Star who helped lead the Twins to a bounce back year and a wildcard spot.  Eric Thames was a surprise story of the year, returning from a year in Japan and sparking the Brewers to an early lead in the National League Central.

Notable about this list is the young cohort of hitters who have consistently taken the all or nothing approach of the three true outcomes specialist.  Judge, Olson, and Blash all made their MLB debut in 2017.  Gallo still qualified as a rookie despite making his debut in 2016.  Keon Broxton, Ryan Schimpf, and Kyle Schwarber are in their second year.  Sano has been a specialist for three years running.  Sure, there are old hands like Napoli and Carter, and Davis who take the all or nothing approach, but the record number of specialists the last couple years have been due to this young cohort of three true outcomes specialists.  A new record will come down to 2018 rookies who practice this all or nothing approach heading into their major league debuts, and the number of teams willing to tolerate the strikeouts that come with this approach.


The Trickiest Third Strike Pitcher in MLB

I ran some queries over at Baseball Savant and came across this tidbit of information. Since 2015, no other pitcher froze hitters on strike three more than Cleveland Indians’ Corey Kluber.

cKluber

I decided to write an article on Kluber’s caught looking data along with how he’s able to be the best at getting hitters held up on that third strike.

Sifting through the last three years of Statcast data, and filtering the results down to a 5000 pitch minimum, Kluber ranks second overall to Clayton Kershaw (2.38%) in called third strike ratio to total pitches (2.28%).

So, why am I not writing about Kershaw? Well, I’m not concerned with ratio because, in this case, the ratio is independent of the number of times Kluber is able to deal that third strike. Kershaw might be better at working over hitters (thereby throwing less) but that doesn’t necessarily lend itself to more swing-less third strikes.

Kluber has thrown with two strikes nearly 1500 more times than Kershaw has in the last 3 years. But, Kershaw his pitched much less (mainly due to injuries), so we’re not going to ‘punish’ Kluber for this. And, we’re talking about a difference in the ratio that’s a tenth of a percent.

Moving on, I wondered if there is any advantage pitching in the American League? First, I looked at the overall plate discipline numbers for the entirety of Major League Baseball from 2015-2017.

mlbPlateDiscipline

So we have a 3-1 ratio of swings, as well as contact, in verses out of the zone. Now I’ll compare the AL vs NL three-year average.

alnlPlateDiscipline

We’re talking about fractions of a percent difference, with the only real disparity (if you can call it that) is the out of zone contact where the AL has a nearly 1% difference. So, there is no advantage to pitching in either league in terms of the type of at-bat you’ll experience.

Using a minimum of 1000 pitches each year, I found that Kluber finished first in 2015, third in 2016, and 2nd in 2017 in strikeouts looking. Furthermore, in context of plate appearances with two strikes, Kluber is ahead in the count (1-2/0-2 count) 24% of the time, even at 45%, and behind (or, a 3-2 count) 31% in those three years. Nearly a quarter of every two-strike situation, hitters are forced to be aggressive at the plate; and just under a third of the time, the batter has to make a mandatory choice.

Before I proceed,  I need to point out that there is some discrepancy as to what Kluber actually throws. He uses something of a sinking fastball that is hard to classify; it goes either way but my main source of research indicates it’s basically a sinker. And with his breaking pitches, which some sites call it a slider, some call it a curve, but it may be a slurve.  For argument’s sake, we will refer to both of them as a sinker and a slider.

So what is it that Kluber is using that’s laying waste to hitters on strike three? His sinker, which he’s thrown for strike three 108 times (50%) since 2015.

kluberPitchTypes

The above graph is his pitch selection after strike two the last three seasons.

His sinker location when he throws regardless of the count. Good luck telling a hitter where to concentrate his swing when he throws it.

chart (21)

chart (22)

However, something changed in 2017; he cut back on his bat-confining sinker by 7% and increased his change-up and slider/curve/slurve usage 1.5% and 7.3% respectively.

kluberSIvsCH

Just for curiosity’s sake, Kluber’s release points are nearly identical on all three pitches. So the hitter may not know whats coming at him with the intention of ending up as strike three (until its too late).

chart-(23)

OK, so he leaned more on his slider last year. What can we make of that using his last three years’ run values in the context of runs above average?

Screen Shot 2018-02-28 at 4.48.06 PM

The sinker, his bread and butter pitch for strikeouts, seems to hover around league average in terms of run value. Upping his change and slider usage appears to have paid dividends; Kluber seems to believe those are better suited to set the batter up for the strikeout. I would also venture to guess his sinker isn’t nearly as effective when thrown earlier in the count, hence the negative run value.

To note, Kluber’s two-strike stats: .136 BA/.392 OPS/10-1 K-BB

His sinker is clearly working when he needs it to.  Overall, it’s his least-effective pitch as hitters eat it up for a .300 average. Nevertheless, according to the data, it’s a tough pitch to gauge when used for that third strike.

Maybe Kluber will start using his slider more with two strikes. However, if he does so, that could cause him to be dethroned as the ‘King of Caught Looking’; his slider is swung at more than any other pitch he has, thereby causing a swinging strikeout.

Regardless, Kluber should still be able to put batters away with that devastating sinking fastball; opponents have 2-to-1 odds they’ll be dealing with it when the count has their backs are against the wall.  It usually doesn’t end well.


Predicting Arbitration Hearings; Was Mookie an Outlier?

Mookie Betts went to an arbitration hearing. Marcus Stroman went to an arbitration hearing. George Springer and Jonathan Schoop did not. Other than the obvious differences between these players, there are others— related to the arbitration process itself— that may have affected these outcomes. Particularly, the differences and qualities of their filings.

To those unfamiliar with the arbitration process, eligible players and teams who are unable to come to a settlement ahead of the given deadline, submit salary filings which reflect either party’s evaluation of the player’s worth. Even after filing, teams and players are able to negotiate a one-year contract, but in some cases, a panel of arbitrators will decide a salary: either the player’s bid or the team’s bid, but not any number in between. This “final-offer arbitration” system is designed to create compromise and negotiation between bargaining parties as the threat of losing a large amount of money increases the incentive to settle early while a midpoint is still available. By extension, teams and players are encouraged to moderate their bids as an outlandish one is surely to be challenged and lost.

But, two different theories exist as to how the difference in bids itself affects the likelihood of hearing. Some argue that higher differences between teams and players in valuation would increase the likelihood of an arbitration hearing as the difference in bids reflects differences in valuation. However, others— namely Carell and Manchise in Negotiator Magazine (2013)— argue that differences in bids increase the risk of heading to a hearing and incentivize teams and players to hammer out a settlement.

Using two separate probability models and data on all players that filed for arbitration between 2011 and 2017, I examined the likelihood that a player goes to an arbitration hearing based on the differences in bids between the player and the team. The models both control for the player performance— by incorporating the effect of WAR— and utilize a dummy-variable for Super-Two status— controlling for the effect of players granted a “bonus year” of arbitration eligibility. The only difference between the two models is the variable of interest. The first uses the ratio of the absolute bid differences to the midpoint between the two salaries in order to measure the effect of a growing gap between filings relative to the actual size of the filings. The latter model separates the two effects to understand whether absolute gaps and absolute filing size have an effect on arbitration hearings. The model specifications and regression results are shown below. The table below essentially shows the marginal effect on likelihood to go to hearing due to a 1 unit change in the corresponding variable.

Model 1:

Model 2:

Results:


Both models demonstrate highly significant coefficients indicating that players with large gaps in salary filings are less likely to enter hearings. In fact, in the aggregate sample of players an increase of $100,000 in bid differences reduces the likelihood of a hearing by 2.7% and a 1% increase in Bid Difference to Midpoint Ratio decreases the likelihood of a hearing by 1.1%. This stands as an incredibly significant effect considering only 16.73% of players in the sample even made it to a hearing. Quite evidently, teams and players are incredibly risk-averse and fear losing the arbitration hearing and being forced to agree to a suboptimal salary. Thereby, the incentive to settle is driven up by higher bid differences.

Another interesting result shows that in all samples, an increase in filing midpoint by $100,000 increases hearing likelihood by 0.56%. As such, all else equal, players with higher filing midpoints are more likely to head to a hearing. The intuition behind this is best explained considering this with the negative coefficient on WAR, as both WAR as Midpoint are highly related but have opposite and significant signs. While WAR indicates that better players are less likely to head to a hearing, the positive coefficient on Midpoint states that “better” players are more likely to head to a hearing.

Though these indicate opposite effects, considering the effect of a high midpoint with WAR constant and vice-versa, the theory provides explanatory qualities. A more aggressive salary bid— given an exogenous and fixed level of production— is easier to dispute for a low-value player than a high-value player. Thus, independent of the player’s production level, a higher Midpoint leads to a higher likelihood to enter an arbitration hearing. As such, the positive coefficient on Midpoint likely reflects bad players bargaining for extra money rather than good players— whose effects on hearing likelihood are captured by the WAR coefficient. Considering the WAR coefficient independent of the filing midpoint as well, teams are more likely to focus their negotiation efforts on their better players, thereby reducing the likelihood high WAR players end up in hearing.

The final variable of interest in these regressions is the dummy-control for Super-Two status. As mentioned earlier, Super-Twos represent young players with substantial playing times who are rewarded with an extra year of arbitration eligibility. The models predict that Super-Two status increases the likelihood of hearings by 14.3%-16.9% depending on the model. As such, these young players seem more likely to challenge their teams in salary evaluations. This too comes as no surprise since challenging a team in your first (and bonus) year of arbitration eligibility can lead to significant level effects in subsequent arbitration hearings. A salary increase from the league minimum to $545,000 to even $1M can snowball into much larger raises in the following years with an arbitration victory. As such, these players may have a higher incentive to enter hearings and capture these multiplicative effects.

Now, revisiting the four cases above— Betts, Stroman, Springer, and Schoop— some interesting cases do pop out. Betts may not have been the most likely candidate to head to an arbitration hearing, the $3M difference between Betts and the Red Sox was incredibly high and reflected an enormous risk for either party entering a hearing. The predicted path for Betts was likely closer to George Springer’s contract extension or Jonathan Schoop’s 1-year deal. By contract, Stroman may represent the classic arbitration case, a low-risk hearing for either party, bargaining over a small fraction of their bids. And while Stroman expressed his frustration— or lack thereof— following the hearing, history shows that the Stromans of the world will likely end up there again. Ultimately, the final offer arbitration system does its job: those who disagree significantly tend to work toward compromise, while those who disagree a little take a change and roll the dice.


Sizing Up the “Most X of the Decade” Races; Plus Bonus Trout Stuff

Admittedly, this is a bit of a stupid topic. These distinctions are often thrown around with an air of importance that is far from earned. Nobody ever mentions that Hank Aaron had the most RBIs in the 1960s. You don’t need to talk about arbitrary endpoints with the Hammer. Mentioning that a player holds one of these “records” is a bit like saying a guy you are trying to set a friend up with has a great personality. It’s likely that this is covering up for something else like a hat covers a balding head.

(*before you head to the comments to blast me, yes, RBI is an incredibly useless statistic)

But they are fun! Hank Aaron did lead in RBI in the 1960s, but he finished second to Harmon Killebrew in home runs. Growing up into a baseball fan in the 1990s, one of the bigger surprises in this genre of record was the hit leader of that decade: Mark Grace. I’d imagine every Cub fan knows this. In addition, anyone who knows a chatty Cubs fan probably knows this, too. Looking at the most recent decade, there are a few surprises: Miguel Tejada had the most games played and at-bats. Andy Pettitte edged out Randy Johnson for most wins. Johnson, along with Alex Rodriguez, dominated most of the categories.

Moving to the point of this article, here is a quick rundown of compelling and not so compelling races to have the most X of this decade, with two seasons remaining:

WAR

You, the Fangraphs reader that goes into the depths of the Community Research section, probably know who leads this category, despite spending 2010 in A ball. But it is a bit closer than you might have thought. While Trout could conceivably win the position player award while sitting out the next two seasons (Joey Votto is the only player that might topple him in this scenario, and he is 9.1 WAR behind), this is the one major statistical category in which position players and pitchers compete with each other.

If I just jogged your memory of that, you probably know the name that is coming: Clayton Kershaw. Trout leads with 54.4 WAR. Kershaw has 52.1 WAR on the pitching side, but has also accrued 1.8 WAR as a batter. That should count. So Kershaw, at 53.9 WAR, is directly on Trout’s heals. Trout is still the heavy favorite, but Kershaw has a puncher’s chance, especially if another injury befalls Trout.

Totally made up odds: Trout, 98%; Kershaw, 2%

Hits

Jose Altuve has put up four straight 200-hit seasons, but he is 251 off the pace and in 15th place. No, this title will most likely go Robinson Cano. Cano leads with 1501, and the only players within sniffing distance are similarly on the downside of their primes. Miguel Cabrera is second at 1416, and then there is a slew of players, including Fangraphs favorite Nick Markakis, in the low to mid 1300s.

Cano should clear 150 hits the next two seasons, and if he does, he will not be passed. Cabrera, as bad as he looked at times last season, would be the likely beneficiary of some unforeseen collapse by Cano. Elvis Andrus is the end of that slew of players behind Cabrera. He has 1329 hits, but recorded 191 last season and is significantly younger than everyone in front of him. I’m going to give him sleeper status for this title.

Totally made up odds: Cano, 93%; Cabrera, 5%; Andrus, 2%

Home Runs

Currently, this is an incredibly close race, with four players within five homers of each other at the top of the list. Jose Bautista is first with 272. Edwin Encarnacion and Nelson Cruz are second and third, and then you get to Giancarlo Stanton in fourth place with 267. Other than Miguel Cabrera and the remnants of Albert Pujols, no one else is close. Stanton has to be the favorite, here, but his status is extremely tenuous. First, let’s just get Buatista out of the way. He’s unemployed and several steps below the other players even if he does try to gut out two more seasons.

Without a doubt, it would be shocking if a healthy Stanton didn’t win this. But a healthy Stanton would be at least a little bit of a shock. The once-oft-injured Cruz and Encarnacion are 37 and 35, respectively, but are still mashing and project for mid-to-high 30-something homers apiece. Cruz has played four straight full seasons and E5 has three straight under his prodigious belt. Stanton is projected by Steamer for a literally—but not really literally—bananas number of 53 home runs. The Fans of Fangraphs are more modest, pegging him with only 48. But Stanton is injury prone. You all know that. There is no argument that he is not. So this is a fairly open race.

Totally made up odds: Stanton, 55%; Encarnacion, 25%; Cruz, 20%

RBI

Again, I do know this is a stupid statistic. But artificial endpoints of decades are pretty stupid, too, so this is fitting. This is Miguel Cabrera’s title to lose, and as long as he plays, he should easily win. And guys making the cash Cabrera is due for the next thousand years generally get every opportunity to play. Sitting behind Cabrera’s 860 RBI are Albert Pujols at 806 and Robinson Cano at 789. The aforementioned Edwin Encarnacion and Nelson Cruz round out the top five with 763 and 756 respectively.

If Cabrera falters, this looks like it would be a wide-open race. Pujols achieved the remarkable 100+ RBI season while losing 2.0 WAR last year. He likely will do much worse, but as long as he is playing, he will continue to accrue a decent number of RBI. E5’s Indians outscored the M’s by 68 runs last year and seem to be a better offensive team, but Cano does have a 26 RBI lead. Honestly, this looks like a virtual toss-up if Cabrera doesn’t win, but the idea of Edwin Encarnacion or Nelson Cruz leading the decade in home runs and RBI is rather delicious.

Totally made up odds: Cabrera, 80%; Cano, 7%; Encarnacion, 6%; Cruz, 4%; Pujols, 3%

Stolen Bases

Be honest, which would you rather be known for: a surprise answer to the question “who stole the most bases in the second decade of the new millennium?” or hitting an epic World Series Game Seven home run… for the losing team. Rajai Davis might say porque no los dos? Davis has the most stolen bases this decade with 301. However, he is actually a longshot to keep this title. Davis just signed a minor league deal with the Indians that includes a non-roster invitation to spring training. He will likely struggle to ever get regular playing time again. He’s 37 years old.

This will likely come down to a race between the two guys behind him. Dee Gordon has 278 stolen bases, had 60 last year, and only turns 30 in April. He has a 35 stolen base lead on 3rd place, which would seem more insurmountable if that person was not arguably a full tick or two faster. Billy Hamilton has 243 stolen bases since coming into the league in 2013, and has been remarkably consistent, stealing one more base each year than the year before. The fans think he’ll do that again this year, hitting 60 stolen bases. Hamilton is over two years younger than Gordon, and might be faster, but the 35 stolen base edge Gordon enjoys makes him the clear favorite.

Totally made up odds: Gordon, 66%; Hamilton 33%; Davis, 1%

Wins

This is likely a two-person race between Max Scherzer and Clayton Kershaw who have 132 and 131 wins respectively. Justin Verlander and Zack Greinke sit enough off the pace at 123 and 122 to make a comeback very improbable absent an injury, but close enough to make a comeback very possible if both players in front of them miss significant time.

Moving to who I give the edge to: there just isn’t a lot separating these two. Scherzer is older, but Kershaw has had a bit more in the way of nagging injuries lately. If it truly were a push going forward, I could just go with Scherzer since he is one ahead at the moment. But I’m going to give Kershaw the ever-so-slight edge because the Dodgers are almost assuredly going to be one of the best teams in baseball the next two years while the Nationals might only have that status for the next season. Verlander gets the nod as more likely spoiler for a similar reason: the Astros are ballers.

Totally made up odds: Kershaw, 45%; Scherzer 43%; Verlander, 7%; Greinke, 5%

Saves

Craig Kimbrel should put this away by midseason. At 291, he ranks 61 ahead of Kenley Jansen and Fernando Rodney, who are tied for second with 230. Aroldis Chapman sits in 5th with 204. Kimbrel’s consistency and consistently light usage should ensure that he continues to rack up saves the next two seasons. Even a repeat of his comparatively modest 66 saves over the last two seasons would give him a realistic lock on this honor.

If Kimbrel does fall apart, the 30-year-old Jansen would be the likely beneficiary, as he has a much stronger hold on his 9th inning role than the 40-year-old Rodney. While Kimbrel might have this decade locked down, he will likely fall short in his quest to surpass Rivera’s total from the last decade. Rivera saved 397 games that decade. It should be noted, however, that Kimbrel barely pitched in the majors in 2010 and recorded only one save. On the other hand, he’s already blown one more save than Mariano did all of last decade.

Totally made up odds: Kimbrel, 97%; Jansen, 2%; Rodney, 1%

Strikeouts

Stop me if you’ve heard this before, but this is a two-man battle between Max Sherzer and Clayton Kershaw. Only this time, there is a much clearer favorite. Scherzer leads Kershaw 1909 to 1835. He essentially built that entire lead last season when he recorded 66 more strikeouts than the limited Kershaw. But Kershaw’s innings shortfall was not the only thing at play here. Scherzer struck out 1.63 more batters per nine innings. For the decade, Scherzer has a 74 strikeout lead in only 14 1/3 more innings. The only realistic path for Kershaw to overtake Scherzer is injury. Of course, with pitchers, injury is always a legitimate and significant risk.

Behind Scherzer and Kershaw is Justin Verlander with 1670. No one past Verlander has any legitimate shot barring a mass retirement of the some of the game’s best starting pitchers. At the end of the day, this is really a question about health. But for Kershaw to overtake Scherzer, he’d not only need Scherzer to get hurt, but he’d have to stay healthy himself.

Totally made up odds: Scherzer, 79%; Kershaw, 19%; Verlander 2%

Runs

This has been a very positive article, but let’s get a bit negative for a second. Which pitcher will give up the most runs in this decade? A big factor in this, of course, is that giving up a lot of runs is bad, and playing bad usually leads to not playing. You have to be good enough to get the ball on a regular basis, but bad enough to rack up the runs allowed. Our frontrunners are honestly not terrible pitchers. Rick Porcello leads the way with 789 runs allowed. James Shields is just behind with 778 runs allowed. Porcello is 29, started a playoff game last year, and is owed a lot of money through the end of the decade. He also won the Cy Young Award in 2016 while accruing 5.1 WAR on the mound. He should have opportunities to add to this total. Porcello underperforms his peripherals, but only by a little. He is basically good enough to never get moved out of the rotation, and durable enough to throw over 1500 innings this decade, but has a suddenly-not-great-for-the-era ERA of 4.29 over the last eight seasons.

James Shields is slated to maybe start opening day 2018. Unlike Porcello, Shields has been dreadful the past two seasons. Yeah, the White Sox starting pitching this year might be awful. Shields is owed a lot of money in 2018, but 2019 is an option that will only be picked up if Shields has a dramatic turnaround. Thus, there is a bit of a catch-22 here. If Shields plays well enough to keep getting the ball regularly into 2019, it seems unlikely that he’ll chase down Porcello. Of course, this could also come down to injury. If either player gets hurt, the other will very likely take this notorious (dis)honor.

Ubaldo Jimenez sits in 3rd with 734 runs allowed. He will thankfully have a hard time adding to that total. If Porcello and Shields find themselves with quick hooks and no jobs, there are a few possible dark horses, including Ervin Santana and Jon Lester, who at the very least should get two full seasons of starts barring injury. For this one, I’m just going to put the field as a third choice rather than trying to single out who might suck, but play.

Totally made up odds: Porcello, 60%; Shields, 30%; Field, 10%

Other Interesting Battles

(My favorites in italics)

Games: Robinson Cano, 1264; Alcides Escobar, 1250 (that would be something)

Runs: Ian Kinsler, 785; Miguel Cabrera, 741; Andrew McCutchen, 740; Robinson Cano, 738

Strikeouts: Chris Davis, 1266; Mark Reynolds, 1250; Justin Upton, 1249

HBP: Shin-Soo Choo, 98; Anthony Rizzo, 98; Chase Utley, 92

Games: Tyler Clippard, 576; Luke Gregerson, 551

Innings Pitched: Justin Verlander, 1705; Max Sherzer, 1670.2; Clayton Kershaw, 1656.1

HBP: Charlie Morton, 82; Justin Masterson, 77 (23 in AAA in 2017)

Balks: Clayton Kershaw, 17; Franklin Morales, 15; Johnny Cueto, 13

Bonus Trout Stuff

You will notice that, apart from WAR, Mike Trout was not mentioned at all in this article. Of course, Trout played zero MLB games in 2010 and only 40 in 2011. But he is also an all-around performer. He doesn’t even show up in the top 10 for most counting categories. So for the lazy, here is where Trout ranks in the decade (if among top 30, must be qualified for rate stats):

Triples: T-8th (40)

Home Runs: T-16th (201)

Runs: 8th (692)

RBI: 30th (569)

Walks: 7th (571)

Intentional Walks: T-14th (61)

HBP: T-27th (55)

Sac Flies: T-16th (40)

Stolen Bases: 17th (165)

Batting Average: 6th (.306)

OBP: 2nd (.410) (not close to first, Joey Votto, .438)

Slugging%: 1st (.566) (biggest threat is probably Giancarlo Stanton, at .554)

Trout is about to play his age 26 and 27 seasons to round out the decade. He’ll be an “old 27” with his August birthday. We don’t know how he’ll age. But it is possible that he plays his whole career, a career of an inner-inner-circle Hall of Famer, and never leads a decade in any traditional counting stat. This on top of his frustratingly low MVP totals. If nothing else does, perhaps that should tell you how stupid this whole exercise is, and how stupid rigid benchmarks for greatness are in general. If Trout were born three years earlier, he could have dominated the counting stat leaderboards of this decade. If he played for a better team, he could have 2-3 more MVP awards.

So what does it all mean? Probably not much. If Albert Pujols squeaks out the most BRI of the decade, will that make it less of a disappointment? Does Nelson Cruz having the most home runs over an arbitrary 10-year period mean that he’ll one day be enshrined in Cooperstown? Well, no. However, I hope you had fun. I know that I did.


Making Baseball Slow Again

If you’re a baseball fan, you may have noticed you’ve been watching on average 10-15 minutes more baseball then you were 10 years ago.  Or maybe you are always switching between games like me and never stop to notice. If you’re not a fan, it’s probably why you don’t watch baseball in the first place: 3+ hour games, with only 18 minutes of real action. You are probably more of a football guy/gal right?  Believe it or not NFL games are even longer, and according to a WSJ study, deliver even less action.

The way the MLB is going, however, it may not be long before it dethrones the NFL as the slowest “Big Four” sport in America (and takes away one of my rebuttals to “baseball is boring”). Currently, the MLB is proposing pitch clocks and has suggested limiting privileges such as mound visits.

Before I get into the specific proposal and the consequences of these changes, let me give you some long winded insight into pace of play in the MLB.

A WSJ study back in 2013 broke down the game into about 4 different time elements:

  1. Action ~ 18 minutes (11%)
  2. Between batters ~ 34 minutes  (20%)
  3. Between innings ~ 43 minutes (25%)
  4. Between pitches ~ 74 minutes  (44%)

The time between pitches or “pace” is what everyone is focused on, and rightly so. It makes up almost twice as much time as any other time element and is almost solely responsible for the 11-12 minute increase in game length since 2008. Don’t jump to the conclusion that this is all the fault of the batter dilly-dallying or the pitcher taking his sweet time. This time also includes mound conferences, waiting for foul balls or balls in the dirt to be collected, shaking off signs and stepping off, etc. Even if we take all of those factors out, there are still two other integral elements that increase the total time between pitches: the total batters faced and the number of pitches per plate appearance (PA).  If either of these increase, the total time between pitches will increase by default. In the graph below, I separated the effects of each by holding the rest constant to 2008 levels to see how each factor would contribute to the total time added.

Any modest game time reduction due to declining total batters faced was made up by a surge in pitches per PA. Increasing pace between pitches makes up the rest.

As we have heard over and over again in the baseball world, the average game time has increased and is evident in the graph above. It’s not just that the number of long outlier games has increased; the median game time has actually crept up by about the same amount.

Plenty of players are at fault for the recent rise in game time. You can check out Travis Sawchik’s post about “Daniel Nava and the Human Rain Delays” or just check out the raw player data at FanGraphs. Rather than list the top violators here, I thought it would be amusing to make a useless mixed model statistic about pace of play.

A mixed model based statistic, like the one I created in this post, helps control for opposing batter/pitcher pace and for common situations that result in more time between pitches. Essentially, for the time between each pitch, we allocate some of the “blame” to the pitcher, batter, and the situation or “context”.

I derive the pace from PITCHf/x data, which contains details about each play and pitch of the regular season. I define pace as the time between any two consecutive pitches to the same batter excluding intervals that include pickoff throws, stolen bases, and other actions documented in PITCHF/x (This is very similar to FanGraphs’ definition, but they calculate pace by averaging over all pitches in the PA, while I calculate by pitch). For more specifics, as always, the code is on GitHub.

It’s a nice idea and all, but does context really matter?

The most obvious example comes from looking at the previous pitch. Foul balls or balls in the dirt trigger the whole routine involved in getting a new ball, which adds even more time. The graph below clearly shows that time lags when pitches aren’t caught by the catcher.

The biggest discrepancy comes with men on base. Even though pickoff attempts and stolen bases are removed from the pace calculation, it still doesn’t account for the game’s pitchers play with runners on base. This includes changing up their timing after coming set or stepping off the rubber to reset.

The remainder of the context I’ve included illustrates how pace slows with pressure and fatigue as players take that extra moment to compose themselves.

As the game approaches the last inning and the score gets closer, time between pitches rises (with the exception of a score differential of 0, since this often occurs in the early innings).

And similarly, as we get closer to the end of a PA from the pitcher’s point of view, pace slows.

Context plays a large part in pace meaning that some players who find themselves in notably slow situations, are not completely at fault. I created the mixed model statistic pace in context, or cPace, which accounts for all of the factors above. cPace can essentially be interpreted as the pace added above the average batter/pitcher, but can’t be compared across positions.

When comparing the correlation of Pace and cPace across years, cPace seems like a better representation of batters’ true tendencies. My guess is that, pitchers’ pace varies more than the average hitter, so many batters’ cPace values benefited from controlling for the pitcher and other context.

After creating cPace, I came up with a fun measure of overall pace: Expected Hours Added Per Season Above Average or xHSAA for short. It’s essentially what it sounds like: how many hours would this player add above average given 600 PA (or Batters Faced) in a season and league average pitches per PA (or BF).

The infamous tortoise, Marwin Gonzalez, leads all batters with over 3 extra hours per season more than the average batter.

That was fun. Now back to reality and MLB’s new rule changes. Here is the latest proposal via Ken Rosenthal:

The MLB tried to implement pace of play rules in 2015, one of which required batters to keep one foot inside the box with some exceptions. The rules seemed to be enforced less and less, but an 18- or 20-second pitch clock is not subjective and will potentially have drastic consequences for a league that averages 24 seconds in-between pitches. Some sources say the clock actually starts when the pitcher gets the ball. Since my pace measure includes the time between the last pitch and the pitcher receiving the ball, the real pace relative to clock rules may be 3-5 seconds faster.

Let’s assume that it’s five seconds to be safe. If a pitcher takes 20 seconds between two pitches, we will assume it’s 15 seconds. To estimate the percentage of pitches that would be affected by these new rules I took out any pitches not caught by the catcher, assuming all the pitches left were returned to the pitcher within the allotted five seconds.

The 18-second clock results in about 14% of the pitches with no runners on in 2017 resulting in violations of the pitch clock. This doesn’t even include potential limits on batters times outside the box or time limits between batters, so we can safely say this is a lower bound. If both of the clocks are implemented in 2020, at least 23% of all pitches would be in violation of the pitch clock(excluding first pitch of PA). Assume it only takes three seconds to return the ball to the pitcher instead of five, and that number jumps to 36%!

And now we are on the precipice of the 2018 season, which could produce the longest average game time in MLB history for the second year in a row as drastic changes loom ahead. I don’t know who decided that 3:05 was too long or that 15 minutes was a good amount of time to give back to the fans. Most likely just enough time for fans to catch the end of a Shark Tank marathon.

Anyways, if game times keep going up, something will eventually have to be done. However, even I, a relatively fast-paced pitcher in college, worry that pitch clocks will add yet another element to countless factors pitchers already think about on the mound.

There are certainly some other innovative ideas out there: Ken Rosenthal suggests the possibility of using headsets for communication between pitchers and catchers, and Victor Mather of the NYT suggests an air horn to bring in new pitchers instead of the manager. Heck, maybe it’ll come down to limiting the number of batting glove adjustments per game. Whatever the league implements will certainly be a jolt to players’ habits and hardcore baseball fans’ intractable traditionalist attitude. The strategy, technology, and physicality of today’s baseball is changing more rapidly than ever. When the rules catch up, I have a feeling we will still like baseball.


The HOF Case for Andruw Jones

With this article, I know that I’m walking into the fire, but I’m prepared.  I will craft my Cooperstown argument for Andruw Jones, the greatest defensive outfielder the game has ever seen.  Receiving 7.3% of the 2018 Hall of Fame votes is insulting to his career, and I hope that, upon reading this article, you’ll see why.

Tale of Two Andruws

30 and under Andruw Jones was on the fast-track to Cooperstown as the greatest defensive centerfielder of his time.  When he wasn’t patrolling the outfield for the Atlanta Braves, he was swatting home runs at a superhuman rate.

By age 31, that Andruw had disappeared, and he would play parts of 5 disappointing seasons with the Dodgers, Rangers, White Sox, and Yankees before retiring from Major League Baseball.  He gained some serious weight, and the athlete of his younger days was gone forever.

Putting Andruw Jones in Context

In my recent Mike Trout article, I brought up a plethora of stars with short careers to make the case for Mike Trout.  However, Andruw Jones is a very different type of player than Mike Trout, and Andruw deserves a different argument.

Too many baseball critics view Andruw Jones as a power hitter that failed to hit the 500 home run mark.  For reference, Andruw Jones hit 434 career home runs, still good for 47th all-time tied with Juan Gonzalez, but well short of the 500 mark.

Andruw Jones’ case will be created by framing his defensive ability and his home run ability in the context of history.  While he didn’t play a full season after age 30, what he did contribute to the game was Hall of Fame worthy, as he was only 19 when he joined the Majors.

The Greatest Defensive Outfielder, Ever

Seriously, Andruw Jones was not just the strongest defensive centerfielder of his time, or centerfielder of all-time.  He is undoubtedly the greatest defensive outfielder, ever.  And his defensive wins above replacement (dWAR) statistics prove it.

If we are looking at defensive skill and Andruw’s ability to perform run-saving, highlight reel plays on the daily, he is the best to ever do it in the outfield.

Baseball Reference has a nicely compiled list of the leaders in career dWAR.  Ozzie Smith sits atop as the greatest defensive player in the history of baseball, with 43.4 career dWAR.  Others high on the list are Brooks Robinson in 3rd (38.8 dWAR), Cal Ripken in 4th (34.6 dWAR), and catcher Ivan Rodriguez in 8th (28.7 dWAR).

These players, along with the top 19 in general, have one thing in common.  They all played infield.  It’s no secret that infielders are likely to have more defensive opportunities, thus having the ability to post higher dWAR each year.  Though playing infield requires quick reaction time and instinctual play, there is not much running involved.  Infielders can often play at an elite level for longer, since covering massive amounts of ground isn’t required.  If you don’t believe me, watch the below video and ponder how many 30+ year olds could chase that ball down.

That video displays the defensive patrolling that is reserved for the outfield.  Elite fielding outfielders above the age of 30 rarely exist because the sheer amount of running required just isn’t feasible on legs over 30 years old.

Now, I’ve held you in suspense long enough, and you’re still wondering where Andruw Jones ranks, and who number 20 is on the list of career dWAR.  That man, with 24.1 career dWAR, is Andruw Jones.  Okay.  Yay!  Cool.  So Andruw Jones has the highest dWAR of any outfielder, ever.  Where do the other great outfielders rank?

Before we can answer a question like that, let’s first keep scrolling down the list until we reach another outfielder.  Hmmm……

Of the top 50 career defensive WAR players, only Andruw Jones played in the outfield.  That’s strange.  It must be a mistake.  There’s no way he was this good and only received 7% of the vote.  Ozzie Smith was inducted first ballot as the best defensive infielder of all-time.  Brooks Robinson was inducted first ballot as the best defensive third baseman of all-time.

We have to move down to position number 60 to find the next highest outfielder on this list: Paul Blair, Orioles’ centerfielder in the 60s and 70s, recorded 18.6 career dWAR.

But Josh, Andruw Retired Early!

This is the unfortunate argument where we assume that because Andruw Jones didn’t play much as he got older, his career dWAR stayed in-tact, never declining with age.  While true that his dWAR dropped from a peak of 26.2 to 24.1 due to 5 sub-par half-seasons as he aged, Andruw Jones was still far better than other greats with longer careers.

Willie Mays played about a decade more full seasons than Jones, so you’d expect his 18.1 career dWAR to be more a factor of negative dWAR seasons as he grew older.  You’re correct in that Mays’ peak career dWAR was above 18.1, but sadly, Willie reached a peak career dWAR of only 19.3, according to Baseball Reference.  Even with almost a decade of additional playing exposure, Willie Mays was never even close to Andruw Jones’ 26.2 peak dWAR.  Even though Willie Mays was an above average outfielder into his mid 30s, his career of defensive excellence is still dwarfed by Andruw Jones’ decade of greatness.

Ken Griffey Jr. is another popular name to throw around as a defensive stalwart in center, but he maxed out at 11.1 dWAR at age 30, before injuries and age reduced his career dWAR to a paltry 1.3.  Jim Piersall reached a max of 16.0 career dWAR during the 50s and 60s.  Andre Dawson reached the 9.0 career dWAR mark before declining with age.  Jim Edmonds never crossed double digits either.  Defensive whiz Lorenzo Cain is currently at 12.1 career dWAR, though he is showing signs of defensive decline.

Andruw Jones’ career dWAR, along with his peak career dWAR is better than any other outfielder.  He is the greatest defensive outfielder in history.  No further questions.

But Could He Hit?

Andruw Jones had a career .254 batting average, but once you get past that, a feared hitter takes shape.  Jones launched 434 career home runs in a very short career.  He also walked 10.3% of the time, which is no number to snuff at.  He had a career slugging percentage of .486, good enough for 170th all-time.  His career OPS+ sits at 111.

Before I dive into his career home run mark, let’s treat ourselves to game 1 of the 1996 World Series, where at 19 years old, Andruw Jones homered in his first two at-bats.  By all my fact-checking, he is the youngest player to hit a home run in the postseason, let alone a World Series, and he did it in back-to-back at-bats.

If we look at the players on the all-time home run list that are higher than Andruw Jones, we note only a handful of players that accomplished this feat in fewer at-bats.  These players are included below, with two objects to note.  In parentheses is the player’s career dWAR, along with an asterisk if this player took any sort of steroids or HGH at any point in their career.  While Juan Gonzales had the same amount of career HRs as Jones, I included him because he did it in fewer at-bats.

The short list:

  • Mark McGwire* (-12.8 dWAR)
  • Carlos Delgado* (-17.9 dWAR)
  • Jason Giambi* (-20.5 dWAR)
  • Dave Kingman (-17.1 dWAR)
  • Adam Dunn* (-29.6 dWAR)
  • Jose Canseco* (-14.5 dWAR)
  • Juan Gonzalez* (-12.3 dWAR)

Note that all these players had career dWAR well below -10, and all but Dave Kingman were linked to steroid abuse.  While none of these players is enshrined in Cooperstown, these players were all one-way guys.  Clearly, none of them contributed from the field throughout their careers.

Andruw Jones had a career AB/HR of 17.51, placing him just ahead of Reggie Jackson on that list.  Jones had an innate ability to hit the ball out of the park, and his career HR/dWAR combination resembles that of only Adrian Beltre (462 HR, 27.8 dWAR), who is a likely first-ballot Hall of Famer himself.  Of course, it did take Beltre significantly more seasons to crush 400 home runs, along with much more time in the infield to reach 20 dWAR.

Defensive Specialists in Cooperstown

Cooperstown loves defensive specialists, and I too, believe they are often deserving.  There is no doubt that players like Ozzie Smith and Brooks Robinson should be in the Hall of Fame.  These guys were first ballot since there was no debate about their credentials.  However, if we look at Smith and Robinson, and notice their career OPS+, we get 87 and 104 respectively.   Both rank below Jones’ mark of 111.

In fact, if we look at the 19 players with more career dWAR than Andruw Jones, only three players have higher career OPS+: Adrian Beltre (117), Gary Carter (115), and Cal Ripken (112).  Carter and Ripken are already in the Hall, and Beltre, as previously mentioned, is a lock for the Hall whenever he finishes his incredible career.  Jones deserves to join them as well, and his abysmal 7.3% of the vote in 2018 worries me greatly.

The Whole Package

I used JAWS a lot in my Mike Trout article as an advanced way to look at Hall of Fame worthiness and included a snapshot of Andruw Jones’ JAWS stat (from Baseball Reference) compared to other CFs in the Hall.


Screen Shot 2018-02-11 at 2.09.18 PM

His JAWS is barely below the average Hall of Fame CF, and his 7 year peak WAR is actually above this average.  If we look at 7 year peak WAR for all centerfielders, we find only 8 guys with a figure above Jones’ 46.4, and 7 of those 8 are already in Cooperstown.  And the 8th is… you guessed it, Mike Trout.

Below is a snapshot of Omar Visquel’s JAWS worthiness.  Visquel was a defensive specialist who snagged 37% of the vote in 2018.  Someone please tell me why his case for Cooperstown is better than Jones’.

Screen Shot 2018-02-11 at 2.35.29 PM

Then we have the beloved Vladimir Guerrero, who entered the Hall this year, even though his 7-year peak WAR was below the average for RFs, and his JAWS score was about 8 points lower than the average Hall of Fame right fielder.

OK, rant over.  Andruw Jones should be in the Hall.  I’ll leave you with a final Andruw Jones moment, this one a broken bat home run to deep center field.  Anyone see this happen recently?  That’s what I thought.  The next time I’m in Cooperstown, I hope to see a plaque of Andruw Jones there.