Do Teams That Shift More Have Lesser Defenders?
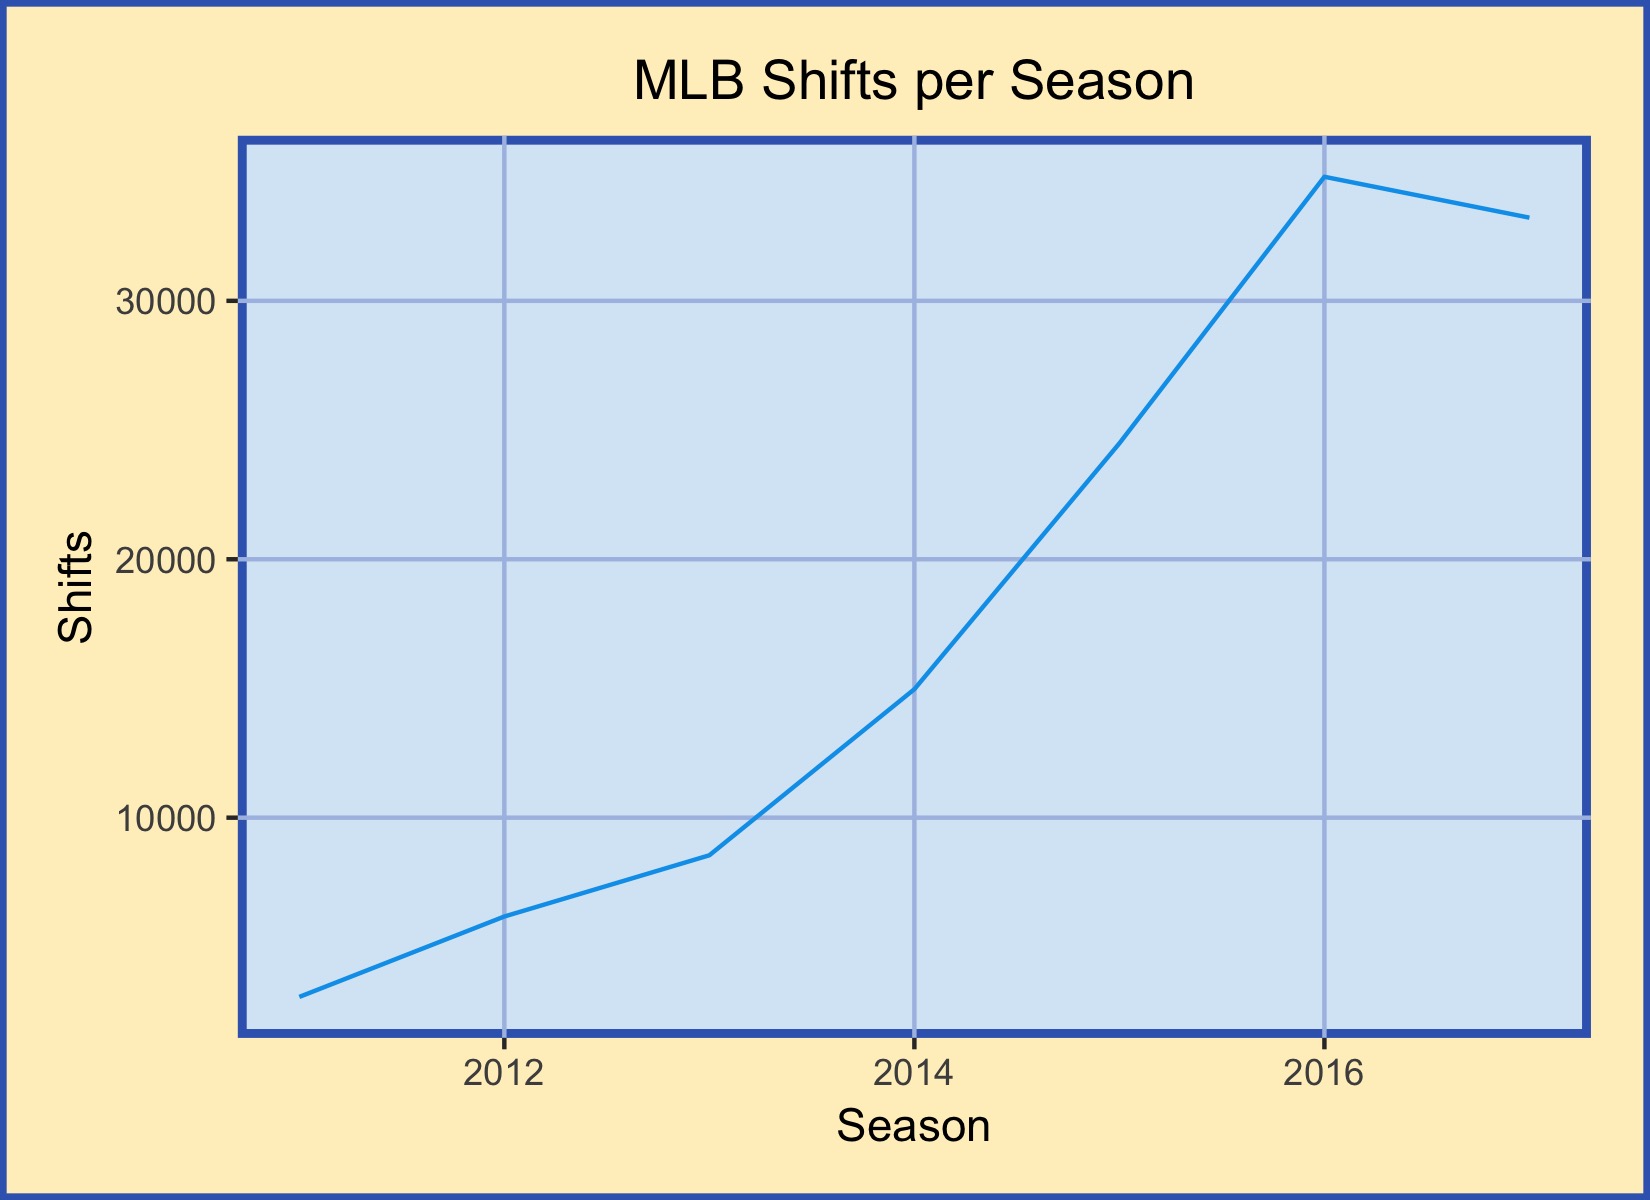
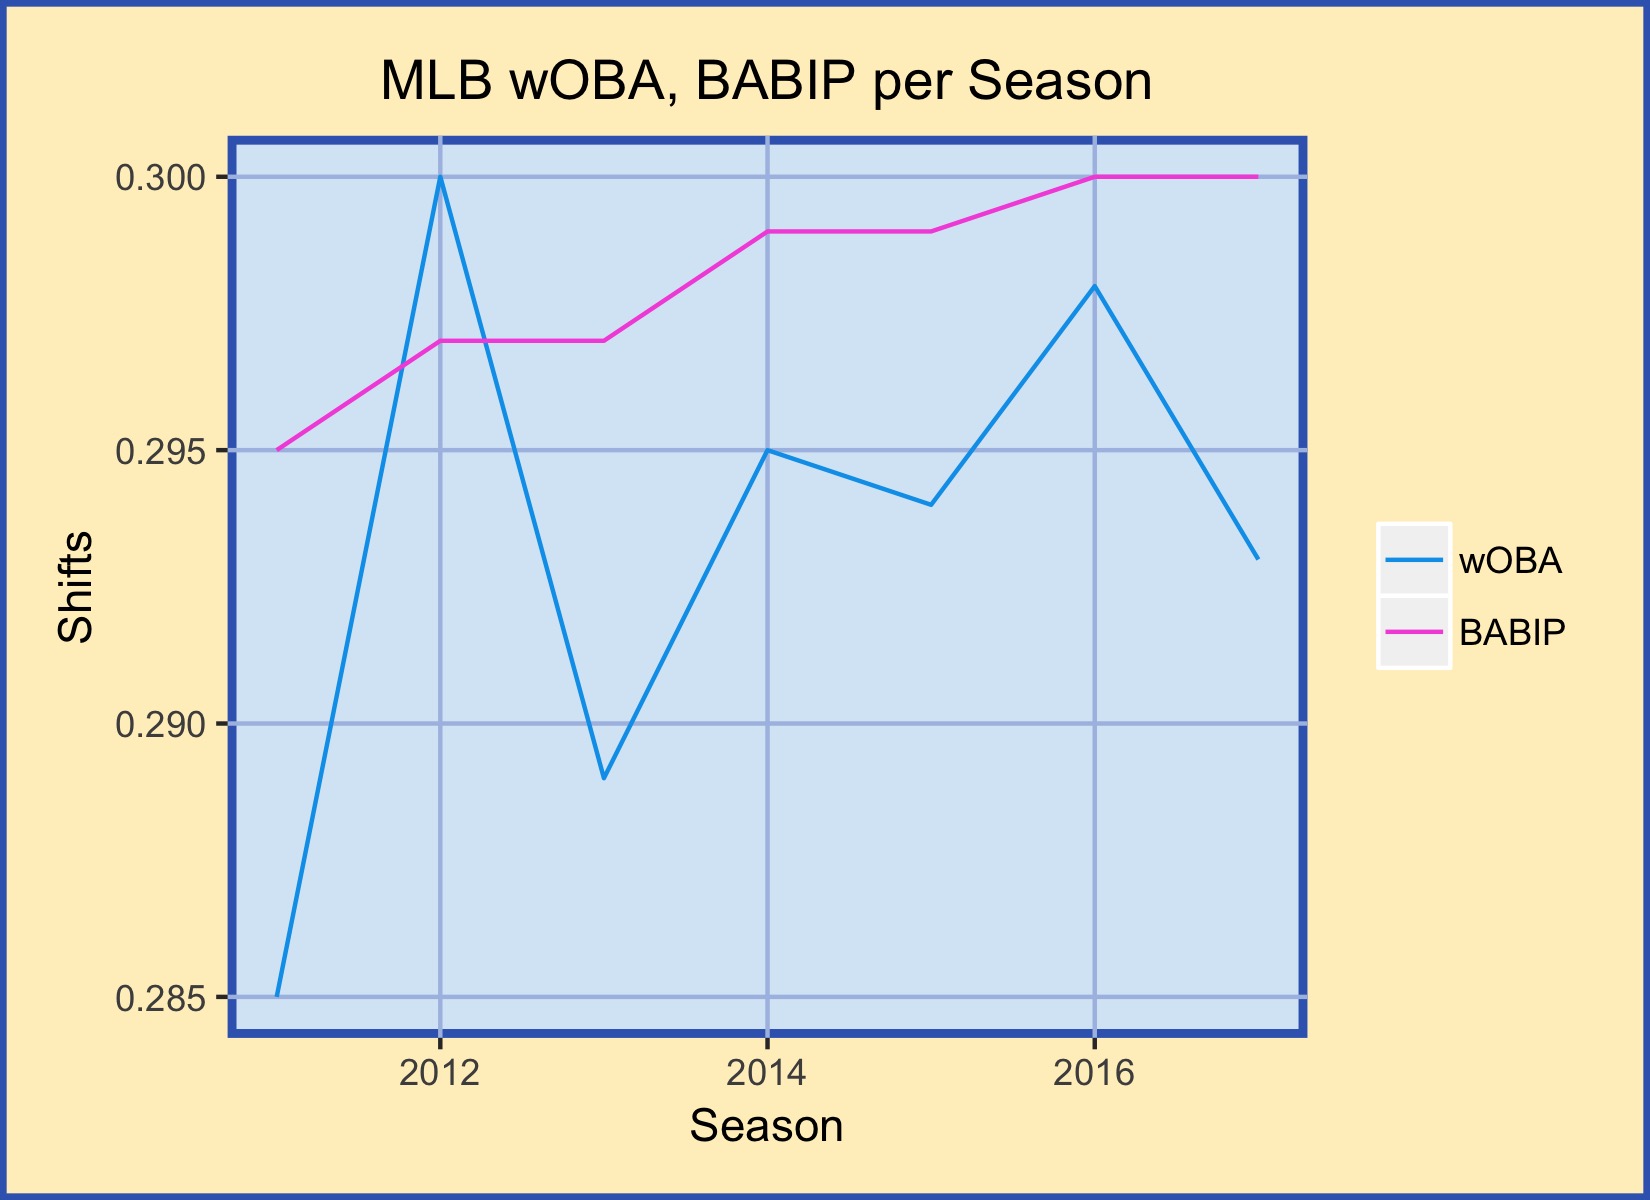
Defensive shifts are designed to prevent hits. By placing fielders in spots of higher hit frequency, the logic follows, fewer batted balls will drop in as hits. Notably, though, as the number of shifts has drastically increased, the league-wide BABIP hasn’t changed. Since 2011, shift deployment has increased tenfold (though BABIP has actually increased 1.7% – .295 in 2011 to .300 in 2017). Better positioning could lead to teams utilizing fielders who have less range, as they’d be located closer to batted balls. Do teams who shift frequently employ worse-ranged fielders?
First, the recent MLB environment. Through a combination of enhanced analysis and deeper data, teams across MLB are increasing shift usage. Positioning fielders in locations of high hit density, for specific batters, allows them to field more batted balls. Every team is increasing their shift usage, driving the total shifts deployed up.
The intuitive result of this would be batters are recording fewer hits. As fielders field more balls, they should convert more of those previously-hits into outs. However, league-wide BABIP has actually increased as shift usage increased. Perhaps the quality of the batted balls has decreased, though – trading doubles and triples for singles. According to the league-wide wOBA, though, the overall quality of offense has increased.
Clearly, shifts aren’t having the effect one would expect them to have. Rather than explore what effect they do have (as if they had no effect, why would teams continue to shift?), I want to see if perhaps the defenders being used are worse. Perhaps shifts have allowed teams to mask poor defenders with better positioning.
After browsing the data, I thought it was best to compare year-to-year changes in range runs saved above average to changes in shift deployment, in attempts to analyze the effects of a large change in shift use on range runs above average (RngR). This variable doesn’t measure data for shifts — any shift-influenced batted balls are excluded. This exclusion is what makes RngR perfect for analysis — we can isolate plays which are standard and similar fielder-to-fielder and control for frequency of shifts.
To do this, I first prorated range runs above average to a 150 defensive game rate (RngR.150), as each team had slightly different innings totals. I then took the year over year difference in RngR.150 as RangeDiff, to analyze changes in range runs above average. Similarly, I took the year over year percentage changes in shift deployments. Due to the drastic increase in shift usage across the majors, comparing these absolute numbers would be meaningless here, so I scaled these percentage changes to each season’s average change in shift usage. This variable, ShiftScaleYOY, represents a team’s shift usage change as standard deviations above or below the season average change. All this data is from Fangraphs, 2011-2017 team defense statistics and shift deployment.
My hypothesis is that teams that have a drastic increase in shift usage between seasons, compared to league-average, would have worse defenders, as measured by range. The results:
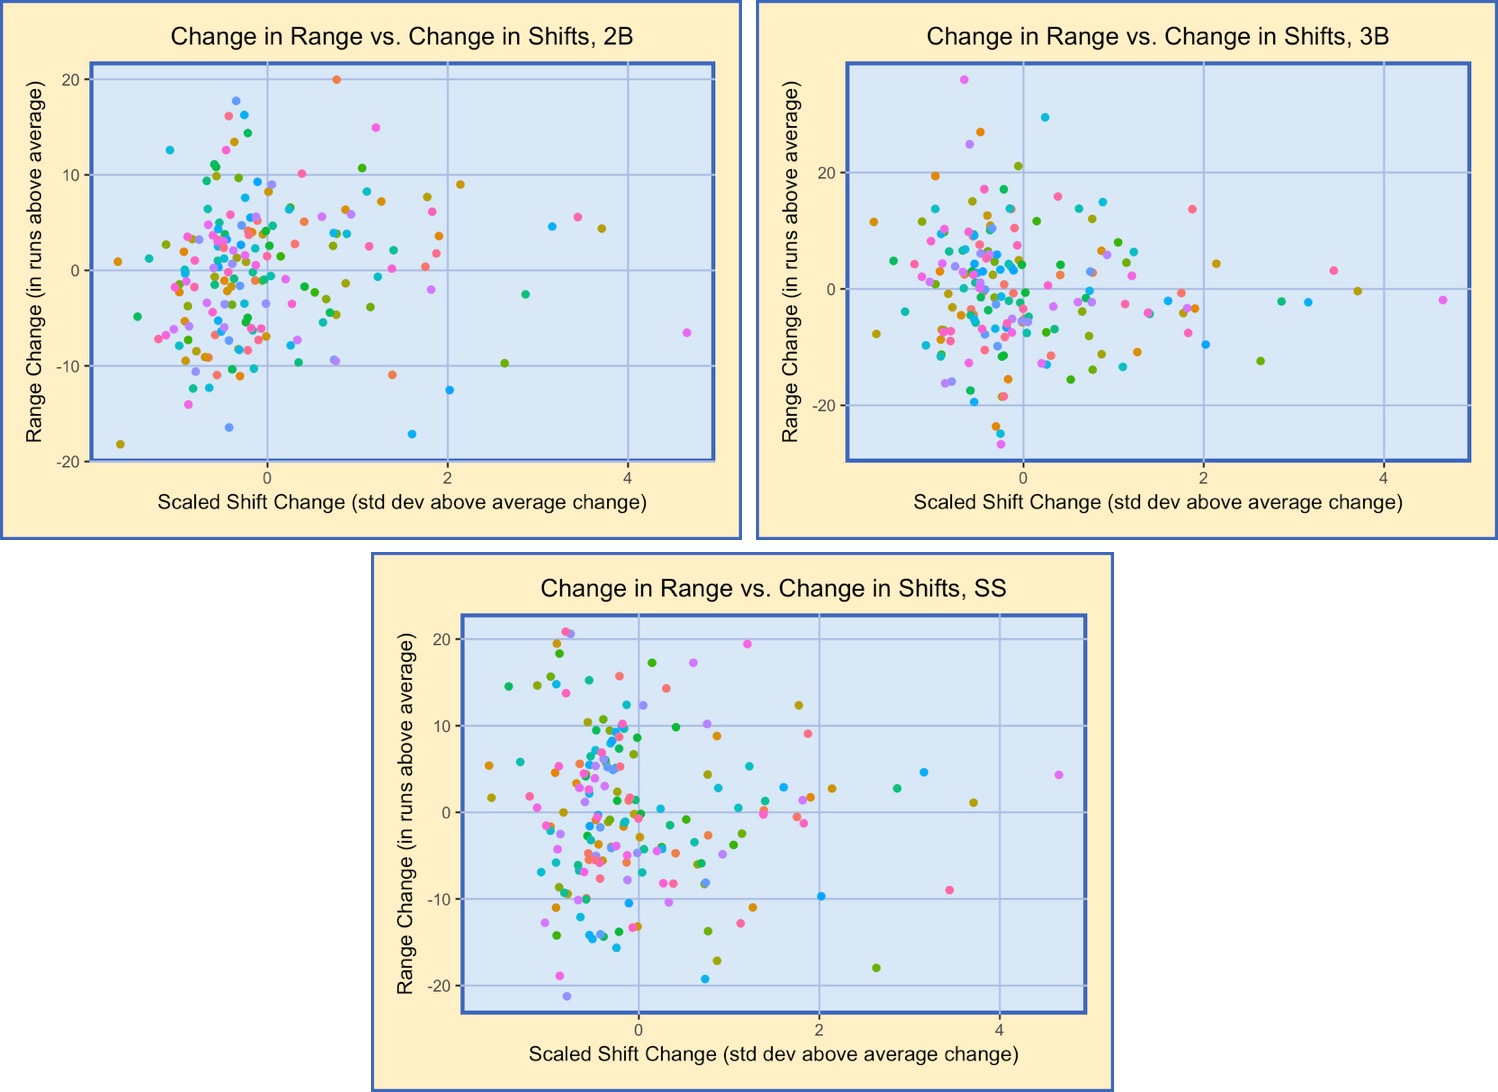
First, notice the axes. Third basemen have a larger variance. Teams with larger increases in shift usage year-to-year, relative to the rest of the league during this same time periods, appear to have defenders at third with range values closer to zero. This is difficult to see through inspection, however. There doesn’t appear to be much of a relationship with 2nd basemen or shortstops.
When I regressed the between-year standard deviation measurement of shift changes on between-year range change, with dummies for position and season, the shift change variable was insignificant. In fact, there were no significant variables, and the R-Squared was merely .13%. Notice the symmetry in the above graphs, though. A team’s range values seem to converge as the team’s standard deviation of shift changes increases.
To explore this, I ran two regressions, with subsets where the dependent variable, Range.150, was positive and negative. The positive regression had an R-Squared of 9.2%, implying it poorly describes the variance in positive Range changes year-over-year. 2017, 3B and SS were all statistically significant, at the 99% confidence level. This implies that there is a 2.15 range per 150 defensive games decrease in 2017 versus the other seasons, that there is a 1.5 run increase for being a third baseman and a 1.4 run increase for being a shortstop over a second baseman. The negative regression had an R-Squared of 8.6%, again implying this model poorly describes the variance in the data. Here, however, 2017 and 3B both were statistically significant, at the 99.9% or greater confidence level. The values were greater, but the direction of implication was the same – 2017 implies a 2.7 run increase, and a third baseman has a 2.4 run decrease over second basemen. These analyses suggest that 2017 resulted in fewer outlier defenders and that third basemen were higher variance than second basemen.
There are a few issues or improvements with this analysis that could be made. First, publicly available data is limited – comparing shifted plays and non-shifted plays would be best for this analysis. What I did could be seen as cursory, at best an introduction. Secondly, the sample size of defensive shift data is small. Defense data for individual, full-time players is generally utilized in three-year samples, and I was using single-year measurements (albeit at the team level, slightly larger samples per position than individual players). Lastly, a deep analysis on shift impacts on player abilities would use individual players – comparing his or her defensive prowess on shifted and non-shifted plays. This would allow us to try to measure the impact of shifts on defensive performance, to better understand if teams would employ different-skilled players as they increase shift usage or if their players perform differently with shift usage.
There are suggestions in the data that certain years or positions differ with respect to defensive range. Nothing suggested relative increases in shift usage impacts range or quality of defenders on the field. All in all, I think this study can be summarized by the wisdom of Albert Einstein: “the more I know, the more I realize how much I don’t know.”
– tb
ML defensive play depends on linkages between players, not just their individual skill sets, IMO. How do you extract, for instance, ‘unit’ defensive ability from individual ability, synergy as it were.
That’s another area where deeper defense data publicly available would optimize analysis. Knowing which players were on the field for which plays, and where, would allow for controlling for defensive partners and positioning.
I used the Fangraphs team RngR per position, which I think just aggregates individual RngR.
Because UZR and its components exclude shifted plays, comparing team RngR allowed for a direct comparison of similar plays (in terms of batted balls), essentially isolating defensive skills for teams at certain positions (breaking that into individuals, though, requires the above mentioned data).
Content aside, this was a creative idea for an article.
This is gonna seem crazy, but maybe shifts are doing more harm than good. There could be teams that are shifting in suboptimal ways that hurt their cause. Or perhaps the shift in general is just not working: (Forgive the link: https://www.baseballprospectus.com/news/article/36733/baseball-therapy-burn-shifts/ )