The Elite Imperfections of Mike Trout

It’s hard to tell exactly what’s going on with a player when their numbers get skewed. Sometimes its injury, others could be due to team/manager/front office resentment, more often than not it can be attributed to bad luck. However, when numbers begin to become conventional or eclipse career norms on a regular basis, under certain conditions, it behooves me as a curious self-proclaimed ‘baseball scientist’ to look into that.
Today’s subject is one Mike Trout of the Los Angeles Angels. Observe his monthly OPS through his seven seasons in Major League Baseball.

Before I proceed, this is not an indictment or deposition on Trout. This is a scrutinization that will attempt to answer why his OPS drops so sharply once we hit the dog days of summer.
Trout is a great player, no one can deny that. You ask just about any baseball player if they’d like to have numbers like Trout and they’d answer before you even finish the question.
A simple assumption through basic observation would be that it’s the fault of the three true outcomes; striking out more and walking less while his power remains the same or takes a dive as well. Since I don’t have a better explanation yet, we’ll stick with that.
But first, I wanted to see if Trout was any sort of outlier; does the average player peak mid-season, then drop off as Trout does? Sort of.

I see the same dip, somewhat as steep for Trout, in July but followed by a resurgence into August. OK, so nothing extreme; basically the same start with a disjunct finish.
Going back to his monthly performances, what also stood out is that as his at-bats increased, his OPS seemed to decrease. However, that only occurred once he surpassed 500 ABs. In the scatter plot below, the coefficient of determination reveals that just about 60% of Trout’s OPS change is attributed to his increase in ABs. That’s a pretty good interrelationship.

So far we know that Trout seems to fade in late summer and that his OPS plummets as his at-bats go up. Is it as simple as that? I can somewhat understand that as the season progresses, players get worn out and, sometimes but not always, their production drops. But the ABs situation makes it more intriguing; you’d think a great hitter is usually always great regardless of the number of times he comes to bat. It doesn’t always follow that the more chances you have the more likely you are to fail.
Remember my original supposition of K/BB/HR variation causing his OPS drop? That’s an invalid inference because we have the same thing happening; as ABs increased, his strikeouts and walks did also. Home runs bounced a little with no correlation to AB figures.

Trout’s strikeouts did jump quite a bit from June to July while his walks increased at the same rate as his ABs. However, his biggest OPS drop-off was from July to August, so we can’t parallel that to a conclusion. The following month (July to August), his ABs increased at the same 11% with both walks and strikeouts growing at the identical rates.
Not satisfied, I needed a couple of player comps to see if they showed any of the similar tendencies I see with Trout. Using his career wRC+ (the best all-inclusive offensive stat) of 169, I see Joey Votto, Miguel Cabrera, and David Ortiz in his range.
- Votto- 162
- Cabrera- 158
- Ortiz- 151
Now, lets move back to their OPS. I took the quad’s career monthly average and created a comparison chart. Keep in mind we aren’t concerned about the numbers, only the trends.
And, because I’m a cheapskate, I have to use Google Sheets to create this chart which will not let me customize the labels.
So you have: Trout, Cabrera, Votto, Ortiz

Cabrera dips about the same time as Trout but his trend line is much more stable. Votto seems to get better as the season goes on, while Ortiz seems to match pretty well except for his minor improvement in Sept/Oct.
So, is Trout and anomaly? Not really; Oritz has very similar tendencies, but also played twice as long as Trout has. To say for certain they match will take more playing time for Trout. In any case, for a player as good (and highly regarded) as Trout, that drop-off is still vexing.
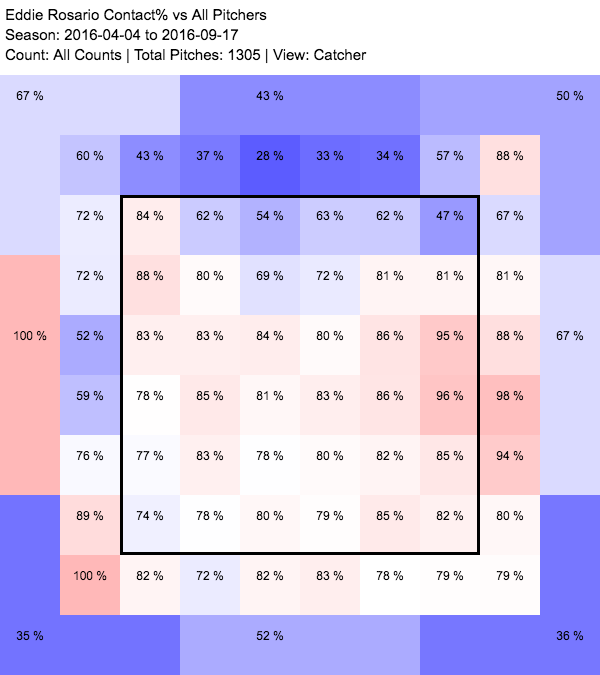
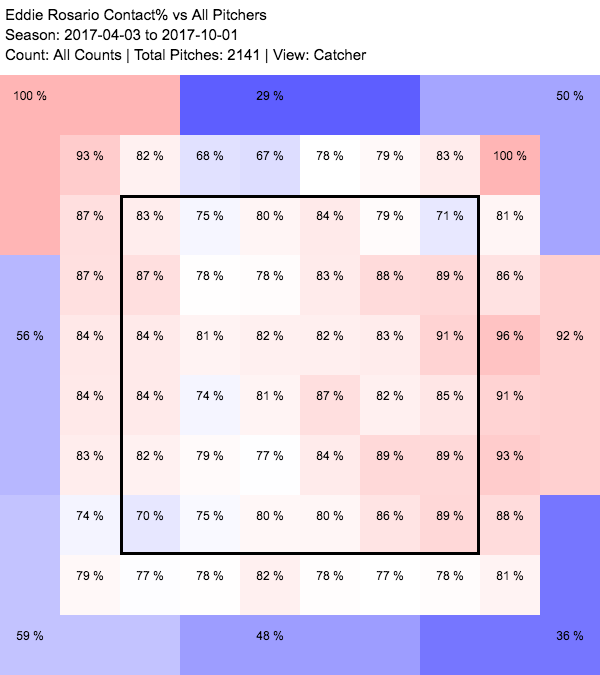
So, I moved on to check and see if his hitting tendencies change. We can view Trout’s career monthly contact figures to determine if there are any obvious signs that could give any sort of explanation for the drop. Things like putting more balls on the ground instead of the air, contact type such as line drives which end up as hits more often, any infield pop-ups indicating a change in swing path, and directional hitting in regards to beating any sort of “shift” to his hitting proclivities (e.g. more balls are finding well-positioned fielders).

A couple of things stand out. The first being his line drive rate; dropping from 23.6 to 19.2 from June to Oct. Secondly his hard contact; while not a huge difference, we can see less potential for barreled contact. Lastly, as you would expect, his BABIP and OPS drop sharply from June on; .395 to .333 and 1.036 to .919 respectively.
Perhaps looking into what causes line drive as well as his hard contact regression will provide the answer; are there changes in exit velocity and/or launch angle? As a reminder, we only have the data that is available through the Statcast era (2015-2017), so take this with a grain of salt; I’m not sure we can glean much from it but its worth looking because it covers roughly half of his career.
- June- 13.8 degrees/91.6 mph
- July- 13.9 degrees/91.4 mph
- August- 14.3 degrees/91.3 mph
- Sept/Oct- 14.7 degrees/91.1 mph
There are drops but the change is slow; launch angle changes by nearly one degree and exit velocity declines by .5 MPH. Can we claim that as the cause? It’s hard to say because as I noted, it only covers his last three years.
To reinforce the lack of apparent swing path/tendencies, observe the gif that goes in chronological order from June through Sept. Do you see any pronounced change, because I don’t?

Perhaps I’m thinking about this too hard. Perhaps I’m asking the wrong question(s). Perhaps its just the way it is; sometimes you eat the ball and sometimes the ball eats you. As I said before, this isn’t a judgment or doubt on Trout’s ability; when he’s at his worst, he’s still better than most of the other hitters in the league.
This post and others like it can be found over at The Junkball Daily.
 (Gif from YouTube, video credit to