Jedd Gyorko’s Struggles

A couple of months ago, I wrote a community post on FanGraphs stating that I felt as though Jedd Gyorko was a special player. I summed up the fact that Jedd Gyorko goes against the normal second baseman positional identity. Rather than being the slappy hitting second baseman,  Gyorko was a second baseman with some serious power. A second baseman with power is not something you see everyday. You can really only point to guys like Robinson Cano and Ian Kinsler in today’s game, that have played second base, and have had success because of their power.

Gyorko’s success last season was mainly driven by his power. Gyorko hit 23 homers to go along with a line of .249/.301/.444.  Gyorko’s contact rate was below league average in 2013 with a mark of 73%, and when you pair that with a walk rate of only 6.4%, you end up getting a player who makes most of his value from driving the ball a long ways.

This season has been a bit of a different story. Gyorko has been one of the worst hitters in the league. In just 56 games this season — before going down with a foot injury — Gyorko has hit an abysmal line of .162/.213/.270. Gyorko’s lack of production could be attributed to a below average BABIP of .192. Gyorko has been unlucky, but it’s also likely that he’s also just not been very good.

In 2013, Gyorko hit a slightly higher FB% than league average (39%), and that has remained the same for 2014. The difference this year has been that Gyorko has been hitting more groundballs, more IFFB’s, and less line drives. Whenever you’re hitting less line drives, you’re probably not getting as many hits.

Year O-Swing% Z-Swing % Swing % O-Contact% Z-Contact % Contact % Zone %
2013 33.6% 70.8% 50.1% 60.0% 82.1% 73.8% 44.4%
2014 30.0% 66.3% 47.5% 54.4% 84.8% 74.8% 48.1%

If you look at Gyorko’s plate discipline, the story hasn’t actually been that much different from 2013. For the most part there’s only been a +/- 6% margin between his plate discipline stats from 2013 to 2014. The contact rate has been steady. Gyorko is swinging at less pitches outside of the zone, however of those pitches outside of the zone he’s making less contact than he did in 2013. For the most part it looks as though Gyorko’s plate approach has remained relatively consistent.

Jedd Gyorko » Heatmaps » RAA/100P | FanGraphs Baseball.

In 2013, Gyorko’s heatmaps indicated that he had success mainly on pitches low and inside. However, he hit pretty well on pitches inside most of the strike zone excluding pitches up and in or low and outside.

Jedd Gyorko » Heatmaps » RAA/100P | FanGraphs Baseball.

In 2014 nearly all of locations in the strike zone Gyorko has struggled with hitting. Gyorko has only had success with pitches that are  low and inside, and even that location has a pretty small area. For the most part Gyorko has not been able to punish anything inside the zone.

Overall pitchers have been able to get away with throwing Gyorko strikes. However, the thing that is also mysterious about Gyorko is that the power has been gone. Even if Gyorko hasn’t been making a whole lot of contact, you would at least think that when he did make contact it would be going a long ways. Thanks to Baseball Savant’s Pitch F/x tool, I was able to take a look at the velocities of pitches which Gyorko was hitting home runs. None of Gyorko’s home runs came off of pitches that were slower than 90 MPH.

Ironically,  despite all of Gyorko’s home runs having come off of high velocity pitches, he has struggled against fastballs this season. In 2013 Gyorko had a 3.6 wRAA against fastballs. In 2014, Gyorko has had a -8.3 wRAA against fastballs: nearly a 12 run difference.  The struggle against fastballs is something that is new for Gyorko, but what has remained steady for Gyorko between 2013 and 2014 has been the struggle against breaking balls. Gyorko has posted negative wRAA against every single type of off-speed pitch. When you can’t hit anything very well, and have never been able to hit off-speed pitches well, it makes the pitchers job very easy.

This dilemma is not something I know how to fix. It may be something mechanical or it may be something mental. Right now, Jedd Gyorko is on the disabled list taking care of a foot injury. Hopefully he can take advantage of his rehabilitation and make some adjustments to his swing. In my posts a couple of months ago I mentioned Jedd Gyorko in the same sentence as Dan Uggla. This season Gyorko might be showing that he may never reach Uggla’s ceiling. He’s played like Uggla’s floor. However the good news is that there is a whole second half of baseball, and Gyorko still young. There’s still the chance that Gyorko can fix whatever it is that is making perform terribly, and be the second baseman that breaks positional identities.


Roster Doctor: Baltimore Orioles

With the simultaneous (if temporary) collapses of the Yankee and Red Sox dynasties, the Baltimore Orioles hit the All-Star break with a very real chance of emerging atop the smoking wreckage of the AL East.  If they miss the playoffs it will be at least in part for one reason the Washington Nationals did so last year: too many bad plate appearances from second base. Jonathan Schoop, the O’s primary second baseman, is slashing  a putrid .219/.257/.322, good for the 16th best WAR among AL second basemen. While dumpster-diving Dan Duquette has found serviceable patches for catcher (Nick Hundley) and left field (the incredibly powerful alien inhabiting Steve Pearce), a solution at second base continues to elude him. Schoop’s head is barely above replacement level water thanks to his stellar defense, but his bat is missing more balls than Julio Cesar.

For now the organization publicly and vigorously defends Schoop, who may yet turn out to be a high-quality two-way player. Ryan Flaherty seems to have taken up residence in Buck Showalter’s split-level dog house, having started just 12 games in June and July. His unimpressive .647 OPS still beats Schoop’s by 50 points. The farm offers little immediate hope; the only O’s middle infield prospect beside Schoop in the team’s Baseball America top 30, Adrian Marin, appears overmatched for now in high-A.

Should the Duke decide look outside the current roster, here’s a review of cellar-dwelling second basemen who may be on the block (contract status from Baseball Reference).

Chase Utley (.297/.354/.452   3.2 WAR) Signed thru 2015, 2 yrs/$25M (14-15) & 16-18 vesting option

Enjoying a Chipper Jonesian late-career resurgence, Utley remains the phace of the phading Phils. He also has a brutal contract and a full no-trade, so he might be cost-prohibitive even if Ruben Amaro was willing to trade him. (Utley has said he won’t waive is no-trade, but most players say that – Baltimore would be about the only place he could be traded and still spend homestands mostly at home.) If Amaro did trade Utley he would need to sleep in kevlar pajamas, so this move seems unlikely.

Darwin Barney (.224/.261./316 0.2 WAR) 1st-Year Arb Eligible, 1 yr/$2.3M (14)

Here’s something about Darwin Barney you might not have known: he doesn’t just do crosswords, he creates them. Here’s something about Darwin Barney you almost certainly know: he just can’t hit. At all. With essentially the same skill set as Schoop is showing this year, he’s not an option for the O’s. Another Cubs middle infielder, Arismendy Alcantara, would probably make Duke salivate, but AA would cost the Orioles at least two of their top three pitching prospects. With Kevin Gausman now firmly entrenched in the rotation (thanks to Ubaldo Jimenez’ heaven-sent trip to the List) he is almost certainly off the block. Dylan Bundy and Hunter Harvey together may be too high a price to pay for a still-raw position player, and one of them alone probably won’t be enough for Theo to pull the trigger.

Aaron Hill (.238/.273/.351 -0.9 WAR) Signed thru 2016, 5 yrs/$46M (12-16)

Aaron Hill’s principal remaining function in baseball is to serve as a warning to others. Disappearing bat speed, immobility in the field, and an albatross contract mean there’s really nothing to see here. Perhaps the O’s think they can fix Hill’s bat, but his 4:1 K/BB ratio suggests otherwise.

DJ LeMahieu (.279/.337/.346 1.1 WAR) Pre-Arb Eligible, 1 yr/$501k (14)

No one has unlocked the secret to winning at Coors yet, but loading up on heavy-groundball starters and assembling a stellar infield defense might be one of the few approaches that Dan O’Dowd hasn’t tried yet. LeMahieu would be a key component of any such strategy. LeMahieu is only 25 and still plays for the MLB equivalent of free; it would almost certainly take a significant package for the O’s to pry him away from the Rox. One problem the Orioles face is that their top-heavy system makes it hard to go after a guy like LeMahieu. He’s not worth any of the top 3 pitchers, and the O’s have little else that would entice a team to part with a solid but unspectacular player. (Christian Walker is raking in AA; maybe he could be part of the answer.) The Rox also have Josh Rutledge, who plays all the infield positions badly but can hit a little. He could form an offense/defense platoon with Schoop, and might be available at a reasonable cost.

Ben Zobrist (.268/.353/.406 2.7 WAR) 5 yrs/$23M (10-14) & 15 team option

In theory, Zobrist is the perfect answer for the Orioles — a short-term rental who could spur their pennant run while Schoop sorts things out at AAA. In practice, of course, he’s in the Orioles’ division. While the Rays have said they are even willing to trade David Price within the division, they have also said they will exact an intra-division premium. The same is presumably true for Zobrist. If he’s traded to a team with orange on their uniforms, it will probably be the Giants.

Brian Dozier (.237/.340/.414 2.7 WAR) Pre-Arb Eligible, 1 yr/$540k (14)

Dozier went from afterthought to asset by jumping his walk rate up this year (12.6% as compared to his career rate of 8.6%). Eddie Rosario’s plan to be the Twins’ starting 2B in 2015 went up in smoke earlier this year, and he has struggled in AA this year after returning from his suspension. (According to one of the better baseball headlines this year, Terry Ryan has offered “high praise” for Rosario since his return.) So Dozier is both more valuable and less expendable now than he seemed in spring training. The Twins minor league system is one of the best in the majors, so it’s hard to see a match here except in the unlikely event the O’s would be willing to part with one of the Big Three for Dozier.

It seems unlikely that any second baseman on the Texas Rangers would be a good trade fit. Rougned Odor, though struggling now, is presumably untouchable. Luis Sardinas has a bright future, but right now it’s unlikely he would be much of an upgrade over Flaherty, who the O’s can start without giving up any talent.

This list is obviously not exhaustive, but it suggests that Duquette’s options outside the organization may be little more appealing than the internal ones. In his tenure as Orioles GM, Duquette has shown a surprising ability to pull rabbits out of his baseball cap. How he solves the O’s second base conundrum will be one of the small but fascinating dramas to follow as this year’s trade deadline draws near.


The Cubs are Bettin’ on Bats

The Cubs are a team that is best described in the future tense. That is not to say that they are completely unwatchable at the major league level; they have a budding star 1st baseman in Anthony Rizzo and an enigmatically talented shortstop in Starlin Castro. But it is the players that have not yet reached The Show that intrigue baseball fans. Since trading Jeff Samardzija and Jason Hammel for wunderkind SS prospect Addison Russell and others, the mystique and potential of the Cubs system has increased dramatically. They have an amazingly talented and deep farm that according to prospect wizard Keith Law has the number 5,8,9 top prospects along with many more in the top 100. Almost all of those players having something in common-their jobs are to crush baseballs and eat planets.

Besides C.J. Edwards, (acquired in the Matt Garza heist) the future of the Cubs being a great team will be based on if those prospects hit. This is why many thought that Theo Epstein and Jed Hoyer would target a club with pitching prospects to send back in a trade. It seems however that such a deal never materialized so the front office did the smart thing and traded their two talented pitchers for the best over all assets which ended up being Addison Russell and co. In the process they created an interesting case study on rebuilding teams farm system composition. For the piece I’ll look at the Cubs with their hitter heavy system, the Astros with their more balanced system system and the Oriole’s pitcher heavy system.

What is perhaps the most important caveat to remember though is that GMs don’t get their way every time; assembling a farm system does not happen in a vacuum. The Cubs, Astros, and Orioles composed their farm systems with the parts that were available to them and who knows how each decision maker would build his ideal farm system. Each of the three franchises however do have amazing talent in the minor league systems and if everything breaks right those clubs will be well equipped to compete for the foreseeable future.

The way the Cubbies have constructed their farm could be described as putting all of their eggs in one basket, after all it’s great if you can average 5 runs a game but if you can’t get anyone out its a moot point. But the kind of eggs the Cubs are investing in are much less fragile than the pitching prospect variety. We live in a baseball age where fans fear the words “elbow soreness” and worry about their favorite pitcher throwing too many breaking balls. That is not to say that hitting prospects don’t get injured, just look at Miguel Sano and Carlos Correa, but as a whole hitters seem less likely to spontaneously explode. The Cubs front office knows that can’t-miss prospects do indeed miss all the time, but by having such a large amount of hitting talent they can hope a few of them at least will reach All-Star levels.

The Astros farm system is also very deep and talented like the Cubs but their top players are a mix of pitchers and hitters. Including the recently graduated Springer, Singleton and Santana (who promptly spilled his cup of major league coffee on himself) they still have Correa in the minors along with Aiken, Appel, and Foltynewicz to make a pretty enticing next generation of Astros. This is a more even approach than the Cubs that allows for the inevitable disappointment of a couple of those big names by having depth in both batters and hurlers. Unfortunately, Aiken apparently has a elbow ligament injury and has not even taken the mound yet. This along with the Correa injury takes out the headliners of both their pitching and hitting departments.

To be fair, those two players just happened to get hurt around the same time of this piece so in a sense I am cherry picking a bit. But it goes to show just how much has to go right for prospects to make an impact in the majors and by diversifying your assets you can sometimes spread yourself a little thin. Nothing is worse than watching a player get hurt but thankfully modern medicine has come along way and odds are that both of those prospects will be again be healthy and productive. However, nothing is a sure bet and injuries that require surgery are serious by definition.

The Oriole’s minor league system is not in the same class as the Cubs or Astros, but it does have three pitchers that are considered to be top of the line starters, if not outright aces. Dylan Bundy, Kevin Gausman, and Hunter Harvey are the pitchers Baltimore is hoping to have anchor its staff by 2016. Those guys each have filthy stuff and in a hitter friendly environment like Camden Yards, having dominant pitching is especially valuable. While the Oriole’s hitting prospects are nothing to write home about not many other systems (if any) can boast the top of the line pitching the Orioles have on hand.

But like any top heavy system there is the concern of injury wiping out the crème de la crème and being left with next to nothing. Already Bundy has gone under the steady hand of Dr. James Andrews (and has looked great so far, especially considering it hasn’t been a full year since he underwent surgery) and Harvey is still in Low A ball with plenty of time between now and the majors. Gausman on the other hand has already pitched for the Orioles and at times has been excellent which makes the teams handling of him curious to say the least. While having all three of those guys become aces seems unlikely, even if only two of them reach their potential that would still give Baltimore a pair of feared fire breathing hurlers to hold court in the AL East. On the other hand I’m sure most still remember Generation K back in 1995 with the promise they showed and while that is an oversimplified comparison it is a reminder of how pitching prospects can break your heart.

Another factor that I believe demonstrates building a farm system with mostly hitters is the way to go is based on the players who are likely to test free-agency in the next couple of years. Rarely do elite position players enter free agency and if they do, they do so with their best years likely behind them and cost the GDP of countries to sign. That is not to say that elite pitchers are flooding the free agent market, but the talent of pitching that will be in the free agent market is indubitably better than the hitting. For your entertainment, here are a couple of the best hitting free agents-to-be in the 2015 class and their 2014 WAR so far in parentheses (I have not included players that have any sort of option for 2015)- Victor Martinez (2.5), Adam LaRoche (1.1), Chase Headley (1.1), Hanley Ramirez (2.4), Russell Martin (2.1), Melky Cabrera (1.8).

If your eyeballs still work after reading that remind yourself that all those guys are going to be at least 30 years old when the 2015 season starts and many have injury histories. Sure V-Mart is a great hitter but he is 35 and almost strictly a DH at this point. Ramirez can be a real difference-maker when healthy, but he unfortunately hasn’t been able to stay on the field the last two years. The free agent pitching class is headlined by Max Scherzer, James Shields, Jon Lester and the immortal Edinson Volquez. While Scherzer, Shields, and Lester all have their warts, they have the potential to anchor a staff for at least a few more years. And in 2016 there are some incredibly attractive starting pitchers who could test the market.

So while having the arms the Orioles can trot out or the excellent combination of hitting and pitching the Astros have on the farm is an enviable position for a GM, having a surplus of athletic hitting prospects who can play multiple positions like the Cubs have seems to be the safest approach to building a major league roster. For a club like the Cubbies that has suffered for years you can’t help but hope this incoming tsunami of talent will be the core of their next great team. And in the process perhaps the idea of hoarding hitting prospects in a time when scoring runs is at a premium will be copied by other franchises looking to rebuild. Until then the Cubs doubling down on bats will be a fascinating storyline.


Breaking Down the Aging Curve Some More

Now that I have gone through the individual cohorts in parts 1, 2, 3, and 4 (click them if you need some background in what I am doing).  To start I will show you three charts with some simple, and I don’t think overly shocking, things to remember.  Then I will get into some regressions that will hopefully help explain what I think is going on.  Keep in mind throughout this that the groups that should be trusted most are the larger cohorts, 22 to 26 year old first full seasons, as the others might have some sample size issues and you will see in these charts that 19 and 20 year cohorts don’t behave well in almost all cases.

First up is this:

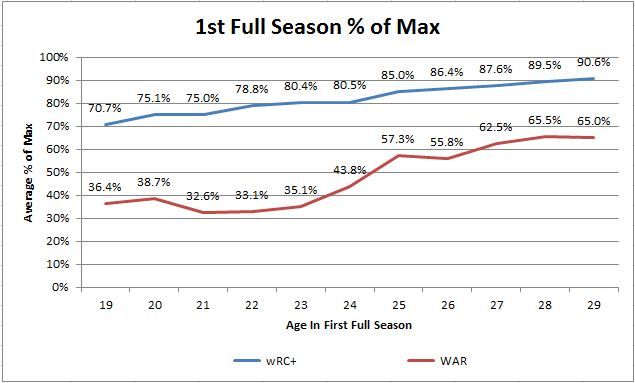
 photo 1stYearofMaxByCohort_zps2f9ded4d.jpg


If you look at the average percent of max for each cohort in their first season, it shows an upward sloping line for both hitting skill and overall value.  The younger cohorts are therefore farther from their peak production when they show up in the league and should be expected to grow if they stick around.  You see a lot higher percentages for wRC+ versus WAR mostly from a scaling and volatility difference.  Going from 1 WAR to 2 WAR is a 100% improvement and not terribly hard to do.  Going from 80 wRC+ to 160 wRC+ is much, much harder, and 1 standard deviation for wRC+ is about 25% of the average while it is almost 100% of average for WAR so wRC+ is significantly less volatile relatively.

Those characteristics mean that randomness around your true talent level means that 50% of max WAR on average means that the cohort might already be at peak true talent level from 24/25 years old and due to volatility it is hard to get very close to 100%, but the hitting gets much closer.  Anyway, players coming up later are much closer to their peak on average and just don’t have much room to grow.  Next let’s look at the two stats, starting with wRC+, at overall level rather than percent of max production:

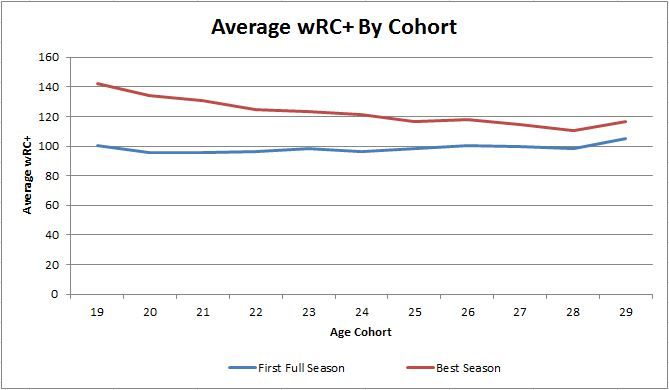
 photo 1stwRCVSmax_zpsb9114e86.jpg


In the first full season each cohort performs at a very similar level, and the older cohorts might actually slightly outperform the younger.  That is a pretty flat line for first year average.  If you take each players best season though, the younger cohorts destroy the older cohorts.  Every cohort before age 25 has an average best of 120 wRC+ or better, so most of the players in those cohorts are going to put up at least one season in the Chase Utley of the last 2 years range, which is pretty good.  After that the difference between the average of the first full season and the peak shrinks down to 10 to 20 wRC+, well within one standard deviation, so the peak looks more like a season where luck pushed a player above average rather than a change in expected performance level.  That’s why we saw players in the cohorts after 24 seem to be at peak and only decline after entering the league.  WAR behaves similarly:

 photo 1stWARvsMaxWAR_zpsd7bc79b6.jpg


Again, 19 and 20 year olds are few and far between, but seriously and average best season of 5 to 6 WAR is pretty staggering as last year only 12 position players made it to 6 WAR or better.  On average the cohorts mostly show up around 1.5 WAR in their first season, and again the older cohorts probably are a little better in their first year.  The best season averages are again much better with a downward slope on the best season averages that starts to flatten out in the mid to late 20s, and I think it is easier to see on this chart than the first.  On average players enter the league at about the same level hitting and as overall producers, but those who can manage that at a younger age (before 25) generally go on to higher performance levels than the players who debut older.

Next I am going to show three regression outputs to try and explain what I think is important to remember for aging of players.  I will try to explain what I am doing so that if you don’t have a background in regression analysis you can still get the point.  If you do have a regression background, know that I am focusing on a couple of key ingredients so they are not intended to be perfect models.  Mostly I am trying to use data to illustrate a point.

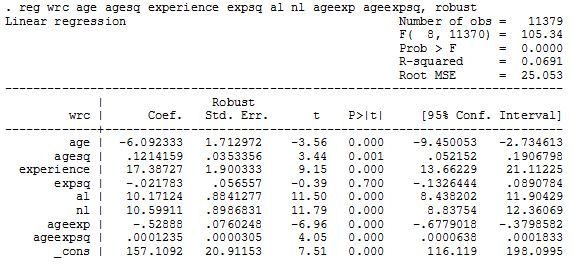
 photo REG1_zps32536599.jpg


So first I went back to all data and ran this OLS specification with wRC+ as the dependent variable.  I was looking at two things, we expect age to affect players in a nonlinear fashion (aging CURVE) so I put in an age and age squared term and did the same for experience where 1st year in the big leagues is 1, 2nd is 2, etc.  AL and NL are probably not necessary but are controlled for in wRC+ and I just went ahead and stripped that part out since I had it there in dummy variable form.  Then I added interaction terms where I multiplied age and experience to see if the combination of the two is important rather than them acting independently.  The only term that came back insignificant was experience square which gave experience a purely linear relationship to hitting performance and also shows why this would be a bad model to lean on in predicting player performance.

The coefficient for experience is 17.4 so the model is saying each year of experience helps the player’s wRC+ increase by an average of that amount.  Other factors, age and age/experience interaction are negative and working against that, but this strong positive experience coefficient makes it so that if you model out a generic player of any cohort they get better at hitting for an unreasonable amount of time before the negative coefficients catch up because age*experience as a multiplier is getting bigger faster.  For the age 21 cohort the first year a player would start to decline would therefor be predicted in year 13 at age 33, and for the 27 cohort year 10 age 36 going against everything we know.

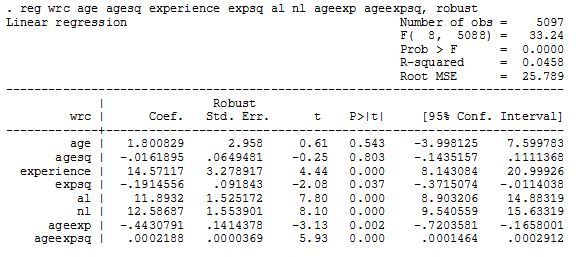
This is I think mostly due to survivor bias (I have discussed this before).  Let me show you what causes this with another regression output.  In this one I intentionally bias the sample by only including players who have 10 or more full seasons.  This reduces my original number of player from 2,054 down to 390, so about 19% of position players that get a full season end up with 10 or more for their career according to this set of players and they have an inordinate effect on a regression of the whole group.

 photo 10plusyearREG_zps46d068c3.jpg


In the first regression there were 11,379 observations (player years), but 5,097 came from this group of players that made it 10+ years.  That means 19% of the players are making up almost 45% of data being used!  They are also in general the best players, which is why they stuck around for so long and thus made it look like experience was a huge positive above.  Within just these players you see that effect is still strong with an experience coefficient of 14.6, but it is no longer linear as experience squared is now a significant negative showing the curve I would expect of experience.  Experience, at least in my expectation, should be beneficial to a player, but have diminishing returns (less effect in each year of experience) and this model shows that.  If you play this model out for the same cohorts I did before it does a better job of showing the peak in the mid 20s, but then continuing production for a lot longer than we would expect for an average player.  That’s fine, I just wanted to show why it is hard to tell how the general player ages because of the undue power of the players who stick around for so long.

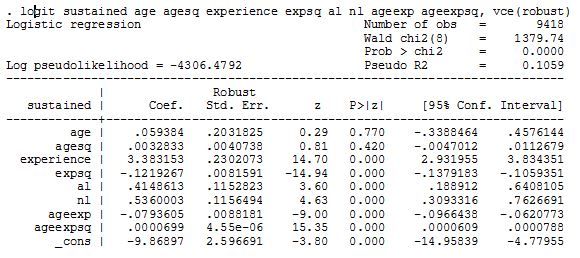
Finally, I want to show you one more regression and discuss some things I think are important for aging in baseball players.  In this one I focused on differencing of wRC+ (e.g. year 2 minus year 1) and created a variable called sustained.  Sustained is a dummy variable that shows years in which a player was better than a previous wRC+ level in two consecutive years.  So if a player had a wRC+ of 100, then 112 the next year and 108 the next it was sustaining higher performance.  Also, since I am using differences in wRC+ instead of the values themselves all 1st year player data is gone since there is nothing to difference it from.  This could be considered as biasing data again, but since we are looking at aging curves players need to stick in the league to see anything so I am doing a study only on those players rather than one and dones.  Here is the output, then more discussion:

 photo REGlogit_zpscaff049a.jpg


Sustained is now the dependent variable, and it is a binomial variable, so I had to move to a logit model.  That means the coefficients are now hard to directly interpret them since they are log odds of the sustained outcome rather than actual units of wRC+ as before.  This model does show what I believe to be the case after breaking all of the aging curve into age cohorts.  It does not show age or age squared as significant, it is showing that experience matters and that the interaction of experience and age matters.  Players who can get major league experience benefit most from getting that experience younger.  There is an obvious endogeneity issue here that that it may be the other way around, players that can get to the majors younger are better players.  I think there is truth in both statements though.

Yes, a player who can handle playing at the major league level at a younger age is likely better and should have a higher expected peak.  On top of that though, the model here is showing that the experience for such a player may also matter.  Playing against better competition makes players better, this is a commonly held belief and there is research to back it up if you want to go over to Google Scholar if you want to search around and read some formal pieces on that topic.  For an anecdotal example let’s look at a couple of players. Jose Guillen came up at 21 and muddled around for several years posting 82, 83, 67, and 88 wRC+ numbers in from 1997 through 2000, only got 145 and 259 plate appearances the next two years, and then finally put up a 138 wRC+ followed by three more above average seasons.  Around the same time there was a guy named Travis Lee who was not in the majors until 23 and posted a 102 wRC+ as a rookie.  He hung around for awhile with a peak of 112 wRC+ in 2003, but had a pretty unspectacular career.

Would Travis Lee have been able to put up an 82 wRC+ a couple years before his 102 at age 23?  I have no idea, but it is possible that if he had, and had two more years experience before that 1998 season that was his rookie year that he might have developed very differently.  The interaction term of age and experience is therefore very important in my opinion.  The model shows that experience is an arc that first increases, peaks, and then decreases in probability of reach new sustained performance levels.  If you look at it in conjunction with the age times experience and squared term of age and experience it shows that the probability of reaching a new and higher level of production is higher for a younger cohort (I’ll forgo posting the numbers for expediency), peaks in the mid 20s, and then drops off fairly quickly.  That is what the aging curve probably looks like based on all I have done so far.


Dominant Players (a la XKCD)

With apologies to Randall Munroe:

Dominant players

Click to embiggen

If you’d like to make your own graph like this one, I’ve pasted the R code I used here.


The Cubs Hope Lightning Can Strike Twice

In the 2013 offseason, the Cubs did something smart. They signed RHP Scott Feldman. Feldman had a rough 2012 season in Texas, posting an ERA of 5.09. However, his peripherals indicated that he was fairly unlucky during that season, leading him to be vastly undervalued. FanGraphs’ own Dave Cameron opined that Scott Feldman was the poor man’s Brandon McCarthy. Feldman was a nice, cheap addition for one year, $6 million.

The Cubs’ strategy of betting on FIP and xFIP seemed to pay off as Feldman quickly became an asset by the time the trade deadline rolled around. In a move that flew under the radar, the Cubs traded Feldman for Steve Clevenger, Pedro Stroop, international bonus slots, and a struggling Jake Arrieta.

It hasn’t taken the Cubs long to see the fruits of their return as Jake Arrieta has become a bright spot on an otherwise struggling Cubs team. In 64 innings, he has compiled a 2.4 WAR and an ERA/FIP/xFIP line of 1.81/1.97/2.50.

Arrieta has been downright filthy for the Cubs in the 64 innings that he has pitched this season. While this is a small sample, it’s indicative that there has been a change in Arrieta’s approach to pitching that is proving to be successful.

While the acquisition of Arrieta didn’t make headlines last year, the Cubs have definitely made headlines over when they completed potentially the largest blockbuster trade of the season, sending pitcher Jeff Samardzija and Jason Hammel to the Oakland Athletics in return for Addison Russell, Billy McKinney, Dan Straily and a PTBNL.

While Russell and Samardzija are the main components of the trade, there is something interesting about the other acquisitions.  If you break the trade into two parts, there’s McKinney and Russell for Samardzija, and then there’s Straily and a PTBNL for Hammel.

It looks as though the Cubs are hoping that history can repeat itself.

The Cubs signed Hammel — for not a lot of money — hoping that he would perform well, and that he could be used as ‘trade bait’ midway through the season. Hammel exceeded expectations during his time with the Cubs, and now he is netting another reclamation project for the Cubs. Sounds an awful lot like the Feldman trade the Cubs made a year ago.

Straily has struggled this year, posting an ERA/FIP/xFIP line of 4.93/5.64/4.43. This is a small sample size of only seven starts,  however the projection systems don’t rate him too favorably for the rest of the year. ZiPs projects Straily to have an ERA of 4.44 and FIP of 4.80 by the end of this year. Steamer projects Straily to have an ERA of 4.45 and FIP of 4.93.

Straily has been getting a decent number of strikeouts, however the root of his struggles have been keeping the ball in the park (16.4% HR/FB), and keeping his walks down. It’s reasonable to think that Straily’s HR/FB will come down given that this is a small sample size, and he’s not nearly this bad at keeping the ball in the park; regression to the mean is expected.

Unlike Arrieta, Straily doesn’t necessarily have the blazing raw stuff. Arrieta flashed a 94 MPH fastball even through his struggles with the Orioles. You could definitely see some raw talent. Straily is in the midst of a velocity decline in which his fastball has declined from 90 MPH in 2013 to 88 MPH this year, and he has lost at least a mile and a half on each of his other pitches. However,  Straily does appear to have a good slider and decent changeup which — combined with regression back to the mean — is a good enough reason for the Cubs to think that there is some talent that can be unlocked.

It’s unlikely that the Cubs will be able to turn Straily into a potential ace, however it’s hard to bet against their track record. They have managed to turn Feldman, Hammel, and Arrieta into something. The have proved that they are good at scouting as they boast arguably the best farm system in the league. Maybe they see something in Straily with which they think that they can work, and realize that he might be good to buy low and hope that he turns into an asset. The Cubs trust their ability to turn pitchers that are nothing into something. While Russell, Samardzija, and Hammel may be grabbing all the headlines, it might just be Straily that surprises us in a year or two.


Pitch Win Values for Starting Pitchers – June 2014

Introduction

A couple months back, I introduced a new method of calculating pitch values using a FIP-based WAR methodology.  That post details the basic framework of these calculations and  can be found here.  The May update can be found here.  This post is simply the June 2014 update of the same data.  What follows is predominantly data-heavy but should still provide useful talking points for discussion.  Let’s dive in and see what we can find.  Please note that the same caveats apply as previous months.  We’re at the mercy of pitch classification.  I’m sure your favorite pitcher doesn’t throw that pitch that has been rated as incredibly below average, but we have to go off of the data that is available.  Also, Baseball Prospectus’s PitchF/x leaderboards list only nine pitches (Four-Seam Fastball, Sinker, Cutter, Splitter, Curveball, Slider, Changeup, Screwball, and Knuckleball).  Anything that may be classified outside of these categories is not included.  Also, anything classified as a “slow curve” is not included in Baseball Prospectus’s curveball data.

Constants

Before we begin, we must first update the constants used in calculation for June.  As a refresher, we need three different constants for calculation: strikes per strikeout, balls per walk, and a FIP constant to bring the values onto the right scale.  We will tackle them each individually.

First, let’s discuss the strikeout constant.  In June, there were 50,861 strikes thrown by starting pitchers.  Of these 50,861 strikes, 4,837 were turned into hits and 14,888 outs were recorded.  Of these 14,888 outs, 3,981 were converted via the strikeout, leaving us with 10,907 ball-in-play outs.  10,907 ball-in-play strikes and 4,837 hits sum to 15,744 balls-in-play.  Subtracting 15,744 balls-in-play from our original 50,861 strikes leaves us with 35,117 strikes to distribute over our 3,981 strikeouts.  That’s a ratio of 8.82 strikes per strikeout.  This is down from 8.88 strikes per strikeout in May.  Hitters were slightly easier to strikeout in June than they were in May.

The next two constants are much easier to ascertain.  In June, there were 28,442 balls thrown by starters and 1,469 walked batters.  That’s a ratio of 19.36 balls per walk, up from 18.77 balls per walk in May.  This data would suggest that hitters were slightly less likely to walk in June than previously.  The FIP subtotal for all pitches in June was 0.57.  The MLB Run Average for June was 4.16, meaning our FIP constant for May is 3.59.

Constant Value
Strikes/K 8.82
Balls/BB 19.36
cFIP 3.59

The following table details how the constants have changed month-to-month.

Month K BB cFIP
March/April 8.47 18.50 3.68
May 8.88 18.77 3.58
June 8.82 19.36 3.59

Pitch Values – June 2014

For reference, the following table details the FIP for each pitch type in the month of June.

Pitch FIP
Four-Seam 4.16
Sinker 4.14
Cutter 4.00
Splitter 4.43
Curveball 3.98
Slider 4.03
Changeup 4.64
Screwball 3.24
Knuckleball 6.30
MLB RA 4.16

As we can see, only three pitches would be classified as below average for the month of June: splitters, changeups, and knuckleballs.  Four-Seam Fastballs and Sinkers also came in right around league average.  Pitchers that were able to stand out in these categories tended to have better overall months than pitchers who excelled at the other pitches.  Now, let’s proceed to the data for the month of June.

Four-Seam Fastball

Rank Pitcher Pitch Value Rank Pitcher Pitch Value
1 Jordan Zimmermann 0.8 171 Marco Estrada -0.3
2 Brandon Cumpton 0.6 172 Masahiro Tanaka -0.3
3 Clayton Kershaw 0.6 173 Juan Nicasio -0.3
4 Matt Garza 0.5 174 Edwin Jackson -0.3
5 Nathan Eovaldi 0.5 175 Nick Martinez -0.3

Sinker

Rank Pitcher Pitch Value Rank Pitcher Pitch Value
1 Tanner Roark 0.5 160 Wei-Yin Chen -0.2
2 Chris Archer 0.5 161 Andrew Heaney -0.2
3 Charlie Morton 0.5 162 Jake Peavy -0.2
4 Alfredo Simon 0.4 163 Jered Weaver -0.2
5 Brandon McCarthy 0.4 164 Dan Haren -0.4

Cutter

Rank Pitcher Pitch Value Rank Pitcher Pitch Value
1 Jarred Cosart 0.6 73 Chris Tillman -0.1
2 Madison Bumgarner 0.4 74 Brandon McCarthy -0.1
3 Corey Kluber 0.3 75 Mike Minor -0.1
4 Adam Wainwright 0.3 76 Brad Mills -0.1
5 Josh Collmenter 0.3 77 Scott Feldman -0.2

Splitter

Rank Pitcher Pitch Value Rank Pitcher Pitch Value
1 Alex Cobb 0.3 26 Tim Hudson -0.1
2 Masahiro Tanaka 0.3 27 Charlie Morton -0.1
3 Tim Lincecum 0.2 28 Jake Peavy -0.1
4 Kyle Kendrick 0.2 29 Ubaldo Jimenez -0.2
5 Alfredo Simon 0.2 30 Miguel Gonzalez -0.3

Curveball

Rank Pitcher Pitch Value Rank Pitcher Pitch Value
1 Jered Weaver 0.2 150 Vance Worley -0.1
2 Edinson Volquez 0.2 151 Christian Bergman -0.1
3 Roenis Elias 0.2 152 Alfredo Simon -0.2
4 Collin McHugh 0.2 153 Marcus Stroman -0.2
5 A.J. Burnett 0.2 154 David Price -0.3

Slider

Rank Pitcher Pitch Value Rank Pitcher Pitch Value
1 Garrett Richards 0.4 113 Aaron Harang -0.2
2 Ervin Santana 0.4 114 Wily Peralta -0.2
3 Chris Archer 0.3 115 Wei-Yin Chen -0.2
4 Homer Bailey 0.3 116 Juan Nicasio -0.2
5 Tyson Ross 0.3 117 Vidal Nuno -0.3

Changeup

Rank Pitcher Pitch Value Rank Pitcher Pitch Value
1 Felix Hernandez 0.3 154 Ervin Santana -0.2
2 Jeff Locke 0.3 155 Mark Buehrle -0.2
3 Henderson Alvarez 0.3 156 David Buchanan -0.3
4 Jeremy Guthrie 0.2 157 Hyun-Jin Ryu -0.3
5 Jason Vargas 0.2 158 Scott Kazmir -0.3

Screwball

Rank Pitcher Pitch Value
1 Trevor Bauer 0.0

Knuckleball

Rank Pitcher Pitch Value
1 C.J. Wilson 0.0
2 R.A. Dickey -0.4

Overall

Rank Pitcher Pitch Value Rank Pitcher Pitch Value
1 Jordan Zimmermann 1.0 177 Dan Haren -0.4
2 Felix Hernandez 1.0 178 Miguel Gonzalez -0.4
3 Chris Archer 0.9 179 Joe Saunders -0.4
4 Clayton Kershaw 0.9 180 Juan Nicasio -0.5
5 Matt Garza 0.9 181 R.A. Dickey -0.6

Pitch Ratings – June 2014

Four-Seam Fastball

Rank Pitcher Pitch Rating Rank Pitcher Pitch Rating
1 Drew Smyly 60 80 Samuel Deduno 36
2 Drew Hutchison 59 81 Wade Miley 34
3 Matt Garza 59 82 Nick Martinez 34
4 Hector Santiago 59 83 Tony Cingrani 33
5 J.A. Happ 59 84 Ricky Nolasco 33

Sinker

Rank Pitcher Pitch Rating Rank Pitcher Pitch Rating
1 J.A. Happ 61 62 Andrew Heaney 38
2 Jeff Samardzija 59 63 Jered Weaver 38
3 Jake Arrieta 59 64 Tommy Milone 35
4 Jesse Hahn 58 65 Jake Peavy 32
5 Felix Hernandez 58 66 Dan Haren 24

Cutter

Rank Pitcher Pitch Rating Rank Pitcher Pitch Rating
1 David Price 59 28 Brandon Workman 46
2 Corey Kluber 59 29 Mike Bolsinger 44
3 Jarred Cosart 57 30 Scott Feldman 40
4 Mike Leake 57 31 Dan Haren 39
5 Phil Hughes 57 32 Mike Minor 34

Splitter

Rank Pitcher Pitch Rating Rank Pitcher Pitch Rating
1 Masahiro Tanaka 59 12 Dan Haren 42
2 Doug Fister 58 13 Wei-Yin Chen 40
3 Kevin Gausman 58 14 Jake Odorizzi 40
4 Alfredo Simon 58 15 Tim Hudson 36
5 Alex Cobb 57 16 Ubaldo Jimenez 25

Curveball

Rank Pitcher Pitch Rating Rank Pitcher Pitch Rating
1 Stephen Strasburg 60 63 David Phelps 42
2 Erik Bedard 59 64 Aaron Harang 38
3 Drew Pomeranz 59 65 Alfredo Simon 34
4 Collin McHugh 59 66 Marcus Stroman 28
5 Josh Tomlin 58 67 David Price 20

Slider

Rank Pitcher Pitch Rating Rank Pitcher Pitch Rating
1 Jeff Samardzija 62 50 Zack Greinke 37
2 Max Scherzer 60 51 Matt Cain 32
3 Tanner Roark 59 52 Wei-Yin Chen 30
4 Vance Worley 59 53 Aaron Harang 29
5 Jhoulys Chacin 59 54 Vidal Nuno 27

Changeup

Rank Pitcher Pitch Rating Rank Pitcher Pitch Rating
1 Gio Gonzalez 61 58 Scott Kazmir 24
2 Jeff Locke 59 59 Drew Hutchison 22
3 Jeremy Guthrie 58 60 Ervin Santana 22
4 Josh Collmenter 58 61 T.J. House 22
5 Sonny Gray 58 62 Hyun-Jin Ryu 20

Screwball

Rank Pitcher Pitch Rating
1 Trevor Bauer 54

Knuckleball

Rank Pitcher Pitch Rating
1 R.A. Dickey 41

Monthly Discussion

As we can see, Jordan Zimmermann takes the top for this month most due to the  quality of his Four-Seam Fastball.  Zimmermann was classified as throwing five different pitches in June (Four-Seam, Sinker, Curveball, Slider, and Changeup) and managed to earn at least 0.1 WAR from the Four-Seam, Curveball, and Slider.  The most valuable pitch overall in June was Zimmermann’s Four-Seam Fastball.  The least valuable was R.A. Dickey’s Knuckleball.  As far as offspeed pitches, Garrett Richards’s 0.4 WAR from his slider lead the way.  The least valuable fastball was Dan Haren’s sinker.

On our 20-80 scale pitch ratings, the highest rated qualifying pitch was Jeff Samardzija’s slider.  Somewhat surprisingly, the lowest rated was David Price’s curveball.  The highest rated fastball was J.A. Happ’s sinker, and the lowest rated fastball was Dan Haren’s sinker.

Pitch Values – 2014 Season

Four-Seam Fastball

Rank Pitcher Pitch Value Rank Pitcher Pitch Value
1 Jordan Zimmermann 1.5 228 Nick Martinez -0.3
2 Phil Hughes 1.3 229 Dan Straily -0.4
3 Ian Kennedy 1.3 230 Doug Fister -0.4
4 Michael Wacha 1.2 231 Juan Nicasio -0.4
5 Jose Quintana 1.2 232 Marco Estrada -0.6

Sinker

Rank Pitcher Pitch Value Rank Pitcher Pitch Value
1 Charlie Morton 1.4 216 Vidal Nuno -0.3
2 Felix Hernandez 1.2 217 Dan Straily -0.3
3 Chris Archer 1.1 218 Jake Peavy -0.3
4 Cliff Lee 1.0 219 Erasmo Ramirez -0.3
5 Justin Masterson 1.0 220 Wandy Rodriguez -0.3

Cutter

Rank Pitcher Pitch Value Rank Pitcher Pitch Value
1 Madison Bumgarner 1.2 102 Cliff Lee -0.2
2 Corey Kluber 1.0 103 Felipe Paulino -0.3
3 Adam Wainwright 1.0 104 Johnny Cueto -0.3
4 Jarred Cosart 0.9 105 C.J. Wilson -0.3
5 Josh Collmenter 0.7 106 Brandon McCarthy -0.3

Splitter

Rank Pitcher Pitch Value Rank Pitcher Pitch Value
1 Masahiro Tanaka 0.7 32 Charlie Morton -0.2
2 Alex Cobb 0.4 33 Franklin Morales -0.2
3 Tim Lincecum 0.4 34 Clay Buchholz -0.2
4 Hisashi Iwakuma 0.3 35 Danny Salazar -0.3
5 Hiroki Kuroda 0.3 36 Miguel Gonzalez -0.3

Curveball

Rank Pitcher Pitch Value Rank Pitcher Pitch Value
1 Sonny Gray 0.8 197 J.A. Happ -0.2
2 A.J. Burnett 0.7 198 Erasmo Ramirez -0.2
3 Jose Fernandez 0.6 199 David Price -0.2
4 Brandon McCarthy 0.6 200 Franklin Morales -0.2
5 Stephen Strasburg 0.5 201 Felipe Paulino -0.3

Slider

Rank Pitcher Pitch Value Rank Pitcher Pitch Value
1 Garrett Richards 0.8 159 Jered Weaver -0.2
2 Tyson Ross 0.6 160 Liam Hendriks -0.2
3 Jason Hammel 0.6 161 Travis Wood -0.3
4 Ervin Santana 0.6 162 Erasmo Ramirez -0.3
5 Corey Kluber 0.6 163 Danny Salazar -0.4

Changeup

Rank Pitcher Pitch Value Rank Pitcher Pitch Value
1 Felix Hernandez 0.7 211 Jordan Zimmermann -0.3
2 Henderson Alvarez 0.6 212 Tony Cingrani -0.3
3 Stephen Strasburg 0.6 213 Matt Cain -0.3
4 Francisco Liriano 0.5 214 Wandy Rodriguez -0.4
5 John Danks 0.5 215 Marco Estrada -0.6

Screwball

Rank Pitcher Pitch Value
1 Trevor Bauer 0.0
2 Alfredo Simon 0.0
3 Hector Santiago 0.0

Knuckleball

Rank Pitcher Pitch Value
1 R.A. Dickey 0.7
2 C.J. Wilson 0.0

Overall

Rank Pitcher Pitch Value Rank Pitcher Pitch Value
1 Felix Hernandez 2.8 235 Dan Straily -0.4
2 Adam Wainwright 2.5 236 Felipe Paulino -0.5
3 Chris Archer 2.1 237 Juan Nicasio -0.5
4 Corey Kluber 2.1 238 Wandy Rodriguez -0.8
5 Garrett Richards 2.1 239 Marco Estrada -1.0

Year-to-Date Discussion

If we look at the year-to-date numbers, MLB FIP and WAR leader Felix Hernandez still sits in the top spot.  Current NL FIP leader Adam Wainwright ranks second.  The least valuable starter has been Marco Estrada.  On a per-pitch basis, the most valuable pitch has been Jordan Zimmermann’s four-seam fastball.  The most valuable offspeed pitch has been Garrett Richards’s slider.  The least valuable pitch has been Marco Estrada’s four-seam fastball.  The least value offspeed pitch has been Marco Estrada’s changeup.  Needless to say, it’s been a rough year for Marco.  Qualitatively, I feel fairly encouraged by the year-to-date results so far.  The leaderboard is topped by two no-doubt aces, both of whom currently their respective leagues in FIP, and Marco Estrada comes in at the bottom after posting the highest FIP among qualified starters so far.  For reference, the top five in the year-to-date overall rankings are currently 1st, 6th, 23rd, 3rd, and 7th on the FanGraphs WAR leaderboards respectively.


Baseball Analytics, Arthritis, and the Search for Better Health Forecasts

This article originally appeared on my blog “Biotech, Baseball, Big Data, Business, Biology…”

It’s Fourth of July weekend in Seattle as I write this. Which means it’s overcast. This was predictable, just as it’s predictable that for the two months after July 4th the Pacific Northwest will be beautiful, sunny and warm. Mostly.

Too bad forecasting so many other things–baseball, earthquakes, health outcomes–isn’t nearly as easy. But that doesn’t mean people have given up. There’s a lot to be gained from better forecasting, even if the improvement is just by a little bit.

And so I was eager to see the results from a recent research competition in health forecasting. The challenge, which was organized as a crowdsourcing competition, was to find a classifier for whether and how rheumatoid arthritis (RA) patients will respond to a specific drug treatment. The winning methods are able to predict drug response to a degree significantly better than chance, which is a nice advance over previous research.

And imagine my surprise when I saw that the winning entries also have an algorithmic relationship to tools that have been used for forecasting baseball performance for years.

The best predictor was a first cousin of PECOTA. Read the rest of this entry »


Quantifying “Good” and “Bad” Pitches

I found Jeff’s recent post on Jake Arrieta fascinating, because he goes into a game and pulls out Arrieta’s eight worst pitches from that game. This is something I’d never really thought deeply about before. We all know what bad pitches look like, right? An 0-2 fastball down the heart of the plate, a hanging slider, a pitch in the dirt on a full count, sure. But can we quantify this? Is there a way to say mathematically (in a way that makes some sort of sense) whether one pitch was better than another? Follow me beyond the jump and I’ll share some thoughts about how we might do this.
Read the rest of this entry »


Finding the Ideal Leadoff Hitter

We know, in 2014, that lineup construction has little effect on winning. And yet, it’s not any less frustrating when managers set their batting orders in ways that seem to defy any semblance of logic. Lineup construction matters to us. We may know it’s not terribly important, but we’re fascinated in spite of ourselves.

The lineup position subject to the most debate is probably leadoff. Multiple writers and analysts have noted that players who would make the best leadoff hitters are normally too valuable to use in the leadoff position. Bill James wrote in his New Historical Abstract, “All of the greatest leadoff men … would be guys who aren’t leadoff men, starting with Ted Williams … if you had two Ted Williamses, and could afford to use one of them as a leadoff man, he would be the greatest leadoff man who ever lived.”

Every method I’ve seen to determine great leadoff batters produces names like Ted Williams, Barry Bonds, Mickey Mantle, Ty Cobb … players who are probably better suited to the second through fourth spots in the batting order. I think I’ve found a simple method that solves the problem. I’ve always been interested in singles hitters who walk. It’s a skill set that matches our image of the prototypical leadoff batter.

Most fans agree that a good leadoff man should get on base and run the bases well. Most fans further agree that a player who both gets on base and hits with power is more valuable a little later in the order, where he can drive in runs. If we accept that we probably can’t have two Ted Williamses, a realistic ideal of the leadoff batter has a high on-base percentage but doesn’t hit with a lot of power.

With this in mind, I’m adapting a stat I’ve talked about elsewhere to identify optimal leadoff men: OBP minus ISO. In my head, I’ve always called this reverse ISO, but that’s sort of a misnomer, and it’s a little unwieldy, so from here on let’s call this stat combination Leadoff Rating, or LOR. We know a good leadoff man gets on base, but most players with high on-base percentage are great all-around hitters. We know power hitters are usually better suited to other spots in the batting order, but many players with low ISO just aren’t that great. By subtracting isolated power from OBP, we can identify players specially suited to hitting leadoff.

This stat does not include baserunning (because I have no idea how to incorporate it with two percentages) but it turns out not to matter very much. A significant majority of players who rank well in LOR were also accomplished baserunners, and base stealers in particular. Among the top 300 hitters of all time (basically everyone with 2,000 career hits), I found a fairly strong positive correlation between LOR and SB (r=.465). The relationship is weaker if you only look at 1947-present (r=.356), but a degree of positive correlation is clear. In both data sets, n=300.

When you calculate LOR for the all-time top 300 hitters, the leader is Billy Hamilton. That’s Sliding Billy Hamilton, the Hall of Fame outfielder for Philadelphia and Boston in the 1890s, not the rookie phenom for the Cincinnati Reds. The original Hamilton retired with 1,782 singles, 1,187 bases on balls, and 376 extra-base hits. He hit .344/.455/.432, with an ISO of just .088, and an OBP higher than his slugging percentage. Hamilton also stole 912 bases. He is a superb example of the hitter we’re looking for, and he leads the new stat by a huge margin. His .367 LOR rates 12% higher than second-place Eddie Collins (.328). Here’s the top 75: Read the rest of this entry »