Breaking Down the Aging Curve Some More
Now that I have gone through the individual cohorts in parts 1, 2, 3, and 4 (click them if you need some background in what I am doing). To start I will show you three charts with some simple, and I don’t think overly shocking, things to remember. Then I will get into some regressions that will hopefully help explain what I think is going on. Keep in mind throughout this that the groups that should be trusted most are the larger cohorts, 22 to 26 year old first full seasons, as the others might have some sample size issues and you will see in these charts that 19 and 20 year cohorts don’t behave well in almost all cases.
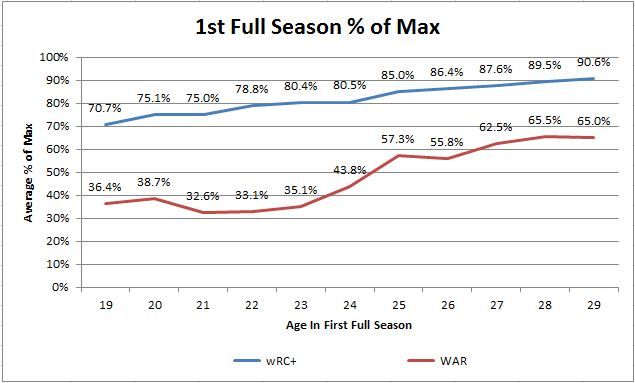
First up is this:
If you look at the average percent of max for each cohort in their first season, it shows an upward sloping line for both hitting skill and overall value. The younger cohorts are therefore farther from their peak production when they show up in the league and should be expected to grow if they stick around. You see a lot higher percentages for wRC+ versus WAR mostly from a scaling and volatility difference. Going from 1 WAR to 2 WAR is a 100% improvement and not terribly hard to do. Going from 80 wRC+ to 160 wRC+ is much, much harder, and 1 standard deviation for wRC+ is about 25% of the average while it is almost 100% of average for WAR so wRC+ is significantly less volatile relatively.
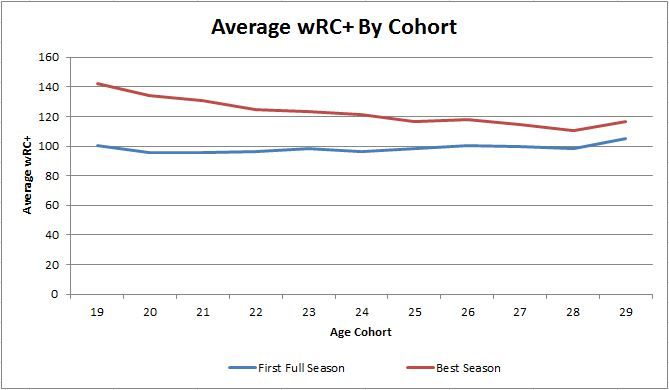
Those characteristics mean that randomness around your true talent level means that 50% of max WAR on average means that the cohort might already be at peak true talent level from 24/25 years old and due to volatility it is hard to get very close to 100%, but the hitting gets much closer. Anyway, players coming up later are much closer to their peak on average and just don’t have much room to grow. Next let’s look at the two stats, starting with wRC+, at overall level rather than percent of max production:
In the first full season each cohort performs at a very similar level, and the older cohorts might actually slightly outperform the younger. That is a pretty flat line for first year average. If you take each players best season though, the younger cohorts destroy the older cohorts. Every cohort before age 25 has an average best of 120 wRC+ or better, so most of the players in those cohorts are going to put up at least one season in the Chase Utley of the last 2 years range, which is pretty good. After that the difference between the average of the first full season and the peak shrinks down to 10 to 20 wRC+, well within one standard deviation, so the peak looks more like a season where luck pushed a player above average rather than a change in expected performance level. That’s why we saw players in the cohorts after 24 seem to be at peak and only decline after entering the league. WAR behaves similarly:
Again, 19 and 20 year olds are few and far between, but seriously and average best season of 5 to 6 WAR is pretty staggering as last year only 12 position players made it to 6 WAR or better. On average the cohorts mostly show up around 1.5 WAR in their first season, and again the older cohorts probably are a little better in their first year. The best season averages are again much better with a downward slope on the best season averages that starts to flatten out in the mid to late 20s, and I think it is easier to see on this chart than the first. On average players enter the league at about the same level hitting and as overall producers, but those who can manage that at a younger age (before 25) generally go on to higher performance levels than the players who debut older.
Next I am going to show three regression outputs to try and explain what I think is important to remember for aging of players. I will try to explain what I am doing so that if you don’t have a background in regression analysis you can still get the point. If you do have a regression background, know that I am focusing on a couple of key ingredients so they are not intended to be perfect models. Mostly I am trying to use data to illustrate a point.
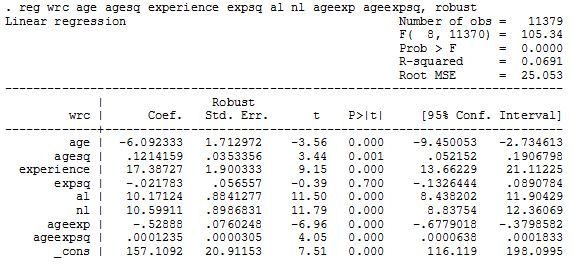
So first I went back to all data and ran this OLS specification with wRC+ as the dependent variable. I was looking at two things, we expect age to affect players in a nonlinear fashion (aging CURVE) so I put in an age and age squared term and did the same for experience where 1st year in the big leagues is 1, 2nd is 2, etc. AL and NL are probably not necessary but are controlled for in wRC+ and I just went ahead and stripped that part out since I had it there in dummy variable form. Then I added interaction terms where I multiplied age and experience to see if the combination of the two is important rather than them acting independently. The only term that came back insignificant was experience square which gave experience a purely linear relationship to hitting performance and also shows why this would be a bad model to lean on in predicting player performance.
The coefficient for experience is 17.4 so the model is saying each year of experience helps the player’s wRC+ increase by an average of that amount. Other factors, age and age/experience interaction are negative and working against that, but this strong positive experience coefficient makes it so that if you model out a generic player of any cohort they get better at hitting for an unreasonable amount of time before the negative coefficients catch up because age*experience as a multiplier is getting bigger faster. For the age 21 cohort the first year a player would start to decline would therefor be predicted in year 13 at age 33, and for the 27 cohort year 10 age 36 going against everything we know.
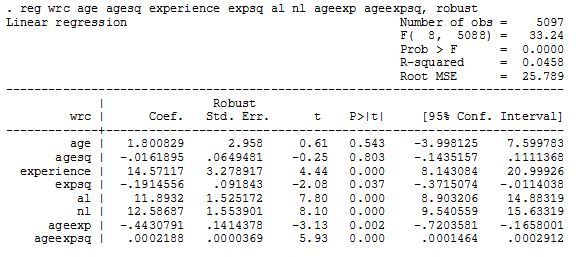
This is I think mostly due to survivor bias (I have discussed this before). Let me show you what causes this with another regression output. In this one I intentionally bias the sample by only including players who have 10 or more full seasons. This reduces my original number of player from 2,054 down to 390, so about 19% of position players that get a full season end up with 10 or more for their career according to this set of players and they have an inordinate effect on a regression of the whole group.
In the first regression there were 11,379 observations (player years), but 5,097 came from this group of players that made it 10+ years. That means 19% of the players are making up almost 45% of data being used! They are also in general the best players, which is why they stuck around for so long and thus made it look like experience was a huge positive above. Within just these players you see that effect is still strong with an experience coefficient of 14.6, but it is no longer linear as experience squared is now a significant negative showing the curve I would expect of experience. Experience, at least in my expectation, should be beneficial to a player, but have diminishing returns (less effect in each year of experience) and this model shows that. If you play this model out for the same cohorts I did before it does a better job of showing the peak in the mid 20s, but then continuing production for a lot longer than we would expect for an average player. That’s fine, I just wanted to show why it is hard to tell how the general player ages because of the undue power of the players who stick around for so long.
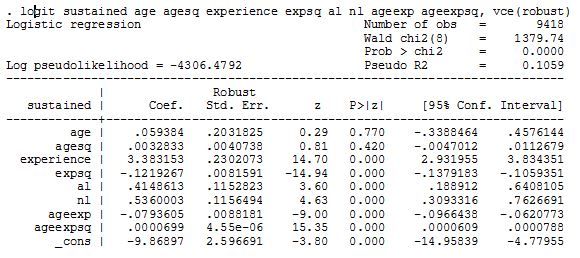
Finally, I want to show you one more regression and discuss some things I think are important for aging in baseball players. In this one I focused on differencing of wRC+ (e.g. year 2 minus year 1) and created a variable called sustained. Sustained is a dummy variable that shows years in which a player was better than a previous wRC+ level in two consecutive years. So if a player had a wRC+ of 100, then 112 the next year and 108 the next it was sustaining higher performance. Also, since I am using differences in wRC+ instead of the values themselves all 1st year player data is gone since there is nothing to difference it from. This could be considered as biasing data again, but since we are looking at aging curves players need to stick in the league to see anything so I am doing a study only on those players rather than one and dones. Here is the output, then more discussion:
Sustained is now the dependent variable, and it is a binomial variable, so I had to move to a logit model. That means the coefficients are now hard to directly interpret them since they are log odds of the sustained outcome rather than actual units of wRC+ as before. This model does show what I believe to be the case after breaking all of the aging curve into age cohorts. It does not show age or age squared as significant, it is showing that experience matters and that the interaction of experience and age matters. Players who can get major league experience benefit most from getting that experience younger. There is an obvious endogeneity issue here that that it may be the other way around, players that can get to the majors younger are better players. I think there is truth in both statements though.
Yes, a player who can handle playing at the major league level at a younger age is likely better and should have a higher expected peak. On top of that though, the model here is showing that the experience for such a player may also matter. Playing against better competition makes players better, this is a commonly held belief and there is research to back it up if you want to go over to Google Scholar if you want to search around and read some formal pieces on that topic. For an anecdotal example let’s look at a couple of players. Jose Guillen came up at 21 and muddled around for several years posting 82, 83, 67, and 88 wRC+ numbers in from 1997 through 2000, only got 145 and 259 plate appearances the next two years, and then finally put up a 138 wRC+ followed by three more above average seasons. Around the same time there was a guy named Travis Lee who was not in the majors until 23 and posted a 102 wRC+ as a rookie. He hung around for awhile with a peak of 112 wRC+ in 2003, but had a pretty unspectacular career.
Would Travis Lee have been able to put up an 82 wRC+ a couple years before his 102 at age 23? I have no idea, but it is possible that if he had, and had two more years experience before that 1998 season that was his rookie year that he might have developed very differently. The interaction term of age and experience is therefore very important in my opinion. The model shows that experience is an arc that first increases, peaks, and then decreases in probability of reach new sustained performance levels. If you look at it in conjunction with the age times experience and squared term of age and experience it shows that the probability of reaching a new and higher level of production is higher for a younger cohort (I’ll forgo posting the numbers for expediency), peaks in the mid 20s, and then drops off fairly quickly. That is what the aging curve probably looks like based on all I have done so far.

This is great stuff, man. You address so many of the tricks this kind of data can play, and come out with what I think are some reasonable conclusions despite the issues. Just wanted to give you credit and let you know your work had a fan. 😉
That’s a wink and not a lazy eye…
Thanks Dan, I really appreciate the kind words.
Seconded. Adding this series to my set of “saber” bookmarks.
tz, just wondering if you have been to saberarchive.com where they are building a repository for meaningful research. Could be easier than keeping your own set of boookmarks.