Author Archive

National League Team Depth

Last week I looked at the AL, so it is time to talk about the Senior Circuit depth. After that I will discuss the limitations that I think exist in both my approach and Jeff’s, part of which could be a new form of MVP debates. What is depth?

Again, I started with a rough look at front line versus second for the teams:

Team Front Line Second
Dbacks 18.2 3.8
Cubs 24.3 4.1
Mets 21.4 2.8
Brewers 24 2
Padres 20.1 2.3
Dodgers 37.4 3.8
Rockies 23.6 2.3
Cards 33.9 3.3
Marlins 25.6 1.1
Pirates 28.1 1.1
Giants 28.9 1.1
Braves 18.8 0.6
Nats 42.1 1.3
Phils 14.3 -0.5
Reds 28.5 -1.3

I had to adjust my method of using the multiple of using front divided by second line a little bit to account for the Reds and Phillies who have negative second line projections by using absolute values.  The National League is structured in a more stars and scrubs way this year versus the American League where there are no teams that you point at and think they will be horrible.  In Philadelphia, Atlanta, and Arizona things are looking pretty grim on the front lines though I could argue that Atlanta has some upside relative to how much Steamer seems to hate their outfield and starting pitching.

This changed how my depth ranking compared to Jeff’s by making the Diamondbacks and Mets look pretty good depth-wise only due to a combination of okay backups mixed with pretty low overall front line WAR.  This is a limitation of the multiples I use as shrinking the numerator can make for a lower multiple if a bad team has a couple of decent bench players.  I will come back to the discussion of what is depth in a second.

Only one other team was ranked far away from Jeff, the Pirates, and they look a lot like the Yankees did in the AL.  In Pittsburgh, they have good players all over the front lines, but the team is going to depend on those guys a lot according to the projection.  Jeff is giving them credit for guys like Sean Rodriguez who could be capable fill-ins according to the projections, not a sentiment I necessarily disagree with and is something recommending the way he approached it.  So what is depth?

I think you can argue several different approached to depth.  Jeff is looking at total number of theoretically useful players, I am looking at a ratio of front line to second line performance to see how much the team is expected to lean on it’s front line, but I also think you could look at two approaches similar to these.  How many capable fill-ins and back-ups are there, Jeff’s number of players minus the number of starters in it would be a simple possible approach to look at how many holes are behind the first group.  Another would be total WAR drop from group 1 to 2 as a percent of front-line, or in other words how much worse is the second group in percent terms.  I could keep going as I have at least three other possibilities, but hopefully you get the point that depth is not a concrete concept just like what does valuable mean in MVP.

What I think might be the best statistical approach to this sort of problem is to have multiple independent people do what I and Jeff have already done and then aggregate the rankings.  Then our approaches can be biased by whatever version of depth we lean toward and let the problems with any given system of measurement be offset by the others.  This isn’t necessary to evaluate all teams, the Reds depth is bad period, but if you look at teams like the Yankees who I think are a little harder to project this year it could be useful.  Since I am a hobbyist who nearly no one knows or cares about, you can now disregard that pipe-dream, though I think over time a system like that would help in understanding how valuable depth is.


American League Team Depth

A couple of weeks ago Jeff Sullivan looked at a quick depth check for all the teams in baseball.  Depth is a hard thing to measure, so I would prefer to look at it in another way and see if anything else shows up or if I can corroborate what Jeff saw.  This is the result from the AL, as I got in an hour or two and realized I wouldn’t have time for all 30 teams this week, so I will get you the rest next week.

What I did was look at the front-line players for each team and their projected WAR from Steamer.  Then I looked at the backups to see theirs.  Front line includes all eight position players, DH, five starters and six relievers.  Second includes a backup at each position (sometimes one player for a couple), 6th and 7th starter, and three relievers beyond the first six.  Here are the outcomes:

Front Line Second
Angels 31.1 3.6
Astros 24.2 1.7
A’s 32 3.7
Blue Jays 33.8 1.6
Indians 30.1 2.3
Mariners 35.7 2.6
Orioles 31.8 2.8
Rangers 28 1.3
Rays 31.1 3.2
Red Sox 33.9 6
Royals 32.3 3.8
Tigers 33 1.4
Twins 22.7 2.7
White Sox 24.7 0.1
Yankees 33.5 1.4

From a depth perspective two things can be relevant, total production expected from the second line and the difference between the first and second lines.  For the difference I want to talk about the difference as the front line being a multiple of the second to keep from the absolute gap looking bad when it is only relative to a strong first string.

You can see what teams Steamer really likes, like the Mariners, who some might not have expected.  They have three high level front line players carrying them in Robinson Cano, Kyle Seager, and Felix Hernandez along with a bunch of 1 to 3 win guys in Hisashi Iwakuma, Austin Jackson, Nelson Cruz, etc.  I don’t like Logan Morrison as much as them but they do have a pretty good mix of talent.  Their second line is not as strong, but it is still around the middle of the pack but the bulk of that coming from Chris Taylor so maybe slightly misleading.

The Red Sox are the clear winners in the second line and the White Sox, who upgraded the front line considerably in the offseason, are clearly not deep based on Steamer’s assumptions.  The Red Sox have Xander Bogaerts backing up shortstop and third, Allen Craig for left and first base, and Ryan Hanigan at catcher.  Pitching is not nearly as deep for them, but their rotation is starting from a solid foundation and they have a reasonable front line bullpen.

In Chicago, injuries to front line starters are expected to be crippling.  Chris Sale, Jeff Samardzija, and Jose Quintana make for a good front of the rotation, but beyond them you are looking at John Danks, Hector Noesi, and Erik Johnson who combine for a negative WAR projection.  That is what makes their depth look so weak.  They are also missing a good backup everywhere except for Emilio Bonifacio who will help out at several positions.

I’m not going through each team, but I do want to match this up with what Jeff found in his.  I ranked them by the multiples method I already described, so the most depth would be the lowest multiple for front line over second.  Both systems put the Red Sox number one and the White Sox last.  Doing an AL ranking they also agree on the Twins (2nd), Orioles (7th), Blue Jays (11th), and Rangers (12th).  There are only a couple of teams on which we really disagree.

Jeff had the Yankees’ depth as 5th and my system had them at 14th.  They have 15 front liners above the 1 WAR threshold he used, but they have little else to go on so in my system they look pretty shallow.  The Royals are the other team on which we disagree.  Again, the Royals front line is full of useful players, but only one of their backups is above that level in Jarrod Dyson.  That gave them a middle of the pack ranking for Sullivan.  In mine Dyson’s rather large number for a second line player along with Erik Kratz, Christian Colon, Kris Medlen and a couple other little guys added up to a pretty decent set of second tier players.

Depth does not make a team good, but for some of the contenders this could become a very big deal.  I would be especially concerned as a fan for Detroit or Toronto who I would think are expecting to contend but have very little behind their studs.  A good team has more than depth, but a potential good team can be completely derailed without it.


When Teams Collapse

Watching a team struggle in key games in September is possibly the most painful part of being a baseball fan.  Sometimes they turn it around, but on some occasions a fan base watches a team go from a near certain playoff birth to watching October baseball.  If it looks like your team might fall apart what is it that should worry you most?  My guess is that it should be mental lapses, which would be the most likely thing to increase if the team is feeling pressure.

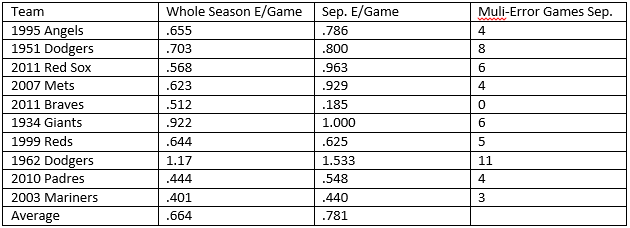
Mental lapses have a couple of possible proxies in baseball statistics, and one would be errors.  Teams that are on the path to collapse might be identifiable if they start having more blunders in the field than they had earlier in the year.  Historically it looks like this might be true.  Coolstandings has a list of some of the greatest collapses from a playoff odds standpoint.  Eight of the top ten collapses show an increase in errors during the month of September.

 photo Errors_zpsedfd5cd7.png


Only the 2011 Braves and the 1999 Reds had lower errors per game in September while collapsing and the Reds were pretty close to the same as the season as a whole.  These gaps are also somewhat conservative since I included September in the whole season number, so the differences from the rest of season would be greater.  Also, the September number includes regular season games that end up in October.  As you an see, the difference on average for the collapsing teams is .117 more errors per game or 17.6% more errors per game than their season as a whole.  The 2011 Braves might be the exception that proves the rule as they were way, way better in September at avoiding errors only having 5 the entire month.  If you take them out the average difference shows almost 25% more errors for collapsing teams in September.

This could be something other than mental issues.  It is possible that errors are higher in general in September due to things like expanded rosters, but of course contending teams aren’t going to be giving a lot of opportunities to unproven talent and shouldn’t be subject to that sort of thing.  Errors  don’t need to be the only proxy either, as I think making outs on the base paths or throwing to the wrong base/missing cutoff men sorts of mental lapses might work too.  Maybe it work better to add up all “mental mistakes” and then look for differences.  We could also look at it in a sort of contagion effect, but I am going to need a site to start giving monthly splits for all team data in an easily accessible way first.

Pressure and other intangible sorts of ideas are always hard to directly study, but we have all felt it manifest in our own lives so we can’t expect professional athletes to be immune to such things.  Watching the Royals the last two weeks or so I have felt like this is happening at times (though Lorenzo Cain literally just smashed a three run bomb off of Chris Sale).  Any Oakland fans feel like they have seen this too?


Team Similarity Scores and 2014 Contenders

Teams have both success and failure in quite a lot of ways, so I am playing with a way of showing what teams look the most alike.  To do this I have created a percent similar score as follows:

First I pulled team level WAR data split into what I am calling HWAR (position players/hitting) and PWAR (pitching) for all teams from 1947 to 2013.  I then converted each of those numbers into a percent above or below league average for that particular season.  For instance, the 2013 Rangers had 21.5 HWAR/19 HWAR league average minus one to convert to percentage, so they have an HWAR% of 13.1 or 13.1% better than average by cumulative war (actual HWARs above are not rounded in the data so it doesn’t round to 13.2% like it does in the example).  I did that for each team and also a PWAR% for each team in the same manner.

Next I compared each team to each other team with a giant 1610 by 1610 matrix, or a little over 2.5 million team pairs, to see how similar the teams were to each other.  The formula for this was 1/((1+ABS(HWAR%i – HWAR%j))*((1+ABS(PWAR%i-PWAR%j)), which gives a percent similarity based on nominal absolute deviation for each team from each other team multiplied together.  That way the deviations can’t cancel each other out and we are bounded between 0 and 1, and each team compared to itself will yield a similarity score of 100% as you would expect.

From this we can find some fun historic pairs, but also I will add 2014 YTD data and see who the best matches are for current teams and their results.  The two most similar teams out of the 2.5 million+ pairs were the 1999 Cardinals and the 2005 Nationals with a similarity score of 99.9%.  Both were slightly below-average teams.  The Cardinals were 15.5% below average by PWAR% and 9.6% below by HWAR%, and the Nats were 15.6 below and 9.5 below respectively.  That St. Louis team ended up going 75-86 on the season as we would expect from these numbers, but Washington managed to scrape by at an even .500 at 81-81.

On the other end of the spectrum, the least similar teams were the 1998 Braves and the 1979 Athletics.  That was a fantastic Braves team with PWAR 80.7% above league average and HWAR 97.5% above.  Meanwhile, the 1979 A’s were awful at 65% below average in PWAR and 151% below in HWAR, yes they had a negative HWAR as a team which is impressive if you like train wrecks.  These two teams had a similarity score of 11.7%, and their records show it.  That Braves team won 106 games and that A’s team lost 108 games, that is about as far apart as two teams can get.

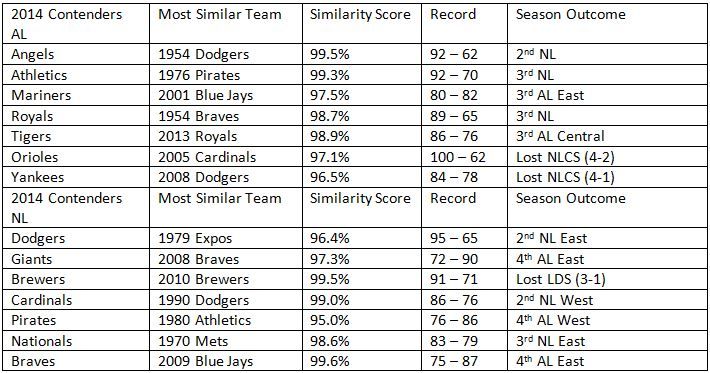
There are some legitimately useful things I am planning on doing with these scores down the road, but for today I also thought it might be fun to see who is most like the 2014 contenders and how their respective seasons turned out.

 photo 2014SimilarityTable_zpsd854702b.jpg


The teams in the best probability for the playoffs have the best comps as you would expect with the exception of the Nationals who drew a very mediocre 83 – 79 team as most similar.  Baltimore had the only 100-game winner , but there are plenty of good teams in the mix like the Dodgers comp of a 95-win Expos team.  The different eras prevent us from seeing a ton of playoff outcomes, but none of the comparable teams made it to the World Series.  This year’s lack of any dominant teams might make that an expected outcome, even Buster Olney on the Baseball Tonight podcast today was discussing this very topic.  Of course everyone expected this year’s Detroit team to look like last year’s Royals.

Anyway, this could be a good way to create groups of historical comparisons for teams and the methodology could be broken out more if you want to separate defense, base running, bullpen vs. starters, which could all be done.  How you multiply them together to get appropriate weighting would be the sticky part with that.  It is a simple way to look at teams that had similar outcomes, and WAR allows us to control for ballpark factors and such.  I welcome any comments on other things you think could make it work better.


Oakland is Fine Without Cespedes

I’ll try to avoid covering too much of the same ground covered right here on Wednesday, but talk about why the Yoenis Cespedes trade will still probably help Oakland this season.  The A’s are generally considered a pretty smart front office, and I think they saw a problem that needed fixing.  I also think that their offense is worse without Cespedes, so we will have to get to that too.

The main source of confusion in this trade stemmed from the fact that the pitching staff seemed to be a strength.  So why would a team trade away one of their middle of the order bats to bolster an already solid part of their team?  The answer is that the team wants to win in the playoffs, and the horses of the rotation for the first half were not going to continue their success.

Jesse Chavez had posted a 3.14 ERA prior to the All-Star break, and since then it has been 4.37 with most of that has been from the bullpen.  Cracks in his performance were showing in June and he was failing to get deep into games, so there was no way they were going to count on him as an option in the postseason.

Drew Pomeranz was showing some signs of being an option before he got hurt, but the injury cut short his opportunity and made him too big of a question mark to count on.

The most important guy in the equation was Sonny Gray.  He has been very good so far this year, but he is heading into uncharted territory fast and it is starting to show.  Last year Gray threw 182.3 innings between triple-A and the majors.  He is now at 162.7 with more than a month before the playoffs even start.  He was still going strong in July, but his velocity had peaked in late May and early June and has slowly been coming down ever since.  They were right not to trust him if August is any indication.  Since the trade Gray has posted a 4.94 ERA, his K-rate is down, and players are hitting him harder.

That all leaves Scott Kazmir and two players that had already been acquired in Jeff Samardzija and Jason Hammel.  Hammel has been bad since the trade with only one start where he made it 6 innings.  Honestly Samardzija’s been pretty bad as well, but prior to the Cespedes trade he had put together a couple good and a couple mediocre starts.  If your only two guys you trust going into October are Samardzija and Kazmir, things are probably not feeling very good.

All of this lead to Jon Lester who so far has been everything they want him to be except that the team has struggled during the time since his arrival.  The hitting collapsed with Coco Crisp, Jed Lowrie, Brandon Moss, and Derek Norris being especially bad.  Steven Vogt also came back to Earth a bit, and the Jonny Gomes/Sam Fuld replacement for Cespedes has under-performed so far.

The solid 3-4-5 of Cespedes, Josh Donaldson, and Brandon Moss lost a piece, and they don’t really have a great option to plug into the 5 hole consistently.  Josh Reddick has come on recently to help in a somewhat depleted offense, but they are keeping him at the bottom of the order since he has been anything but trustworthy over the past couple seasons.

This has hurt the offense for sure and simple confidence intervals of before and after the trade show a significant drop in output.  At the same time I assume they saw this coming to some extent.  Guys like Norris and Vogt were playing way over their heads and were likely to regress some.  Only the weird collapse of half the offense at one time has made it look as bad as it is.  It is unlikely that this rough stretch will be sustained.  It also didn’t help that the Royals, Rays, Braves, and Mets were all on the schedule and are above-average run-prevention teams.

If I were the A’s I would still be happy about this trade.  Lester, Samardzija, and Kazmir is a much better way to head into the post season.  Catching the Angels just became more likely due to the unfortunate loss of Garrett Richards too.  Billy Beane has been to the playoffs, and almost certainly will be again this season.  He wants to win in the playoffs, and this pitching staff gives him a good opportunity to do so.


Extreme Teams Past and Present

The way a team is built is always at the heart of discussions of free agent acquisition, trade analysis, optimal lineup construction, etc.  It is what general managers are paid to do, and there are some very divergent philosophies that are espoused by folks like Brian Sabean or Jeff Lunhow.  A few teams each year by happenstance or design end up having one unit, offense or pitching and defense (p/d), far outstrip the other in performance, and these are what I want to look it today.

In this instance I am stripping teams down to a function of two activities, how many runs do they score and how many do they give up.  Some teams have innate advantages to one or the other of these activities based on fun things like park effects or deep pocket books, but that’s okay.  What I did was pull the last ten full seasons (2004 through 2013) first and find out what the average runs scored/given up by a team was for that year.  Then for each team I gave them a plus minus for runs scored and given up so a team that scored 20 more runs than the average gets a +20 and if they also allowed 20 fewer runs than average they get another +20 and their extremeness rating is 20 – 20 = 0, so their units of offense and p/d are balanced and not extreme.  The most extreme differences for the two units over those ten years are as follows:

 photo ExtremeTeams_zps6989f530.jpg


What stands out is that the most extreme teams tend to not be very good because one unit tends to be very, very bad creating an insurmountable obstacle to success.  The Rangers of 2008 are by leaps and bounds the most extreme team because the had the best offense in major league baseball at 148 runs more than the average team, but they also allowed the most runs that year giving up 214 more than average and thus one 79 games and an extremeness rating almost 50% above second place.  The 2005 Red Sox are the only team that made the playoffs with one dominant unit, and their pitching staff was bad, but not extremely bad as we will see in a bit.  Their 2011 team was similar, but the 90 wins was not enough to get them into October.

Another interesting thing in this group is that almost all of them skew toward hitting.  Only the 2010 Mariners, and the Giants teams 2009 and 2011 were pitching oriented with no offense to speak of.  Also, 2005 was evidently the year for being extreme as there are three teams from that season in the top 10.  Now let’s look at teams that are most extreme in one or the other category rather than the combined.

If we look at just extreme offenses there is a lot of success.  The top offense of the last 10 seasons was the 2007 Yankees who scored 190 more runs than the average team that season.  I was looking at the top 15 offenses by this measure and the Yankees show up 6 times and Boston does 4 times.  Money can buy you a great offense, and it can get you to the playoffs.  A full 80% of the top 15 offenses above average made the playoffs with only the aforementioned 2008 Rangers and 2011 Red Sox along with the 2005 Rangers missing the postseason.  Those three teams all had negative p/d production relative to average that kept them out, though the Red Sox team was close.

Before moving to p/d extreme teams, I also looked at the records of these teams versus their Pythagorean expectation and they seem to perform as you would expect.  Seven of the 15 were below expectation, so conversely eight above and on average the actual and expected were very close to being the same.

The teams that were best by runs allowed look very different.  At +165, the 2011 Phillies’ “Best Rotation Ever”, was at least the best rotation of the past ten years by runs allowed versus the average.  The volatility of pitchers prevents particular organizations from dominating this list like the offensive list.  Only the Giants and Padres show up more than once with the three and two seasons respectively, thanks PECTCO!  That means the top 15 offenses of the past decade belong to only four organizations versus 12 different teams being represented on the pitching side.

This probably shows that teams are being smart (or unsuccessful) in trying to build a team with extreme pitching dominance too.  Only eight of the 15 best p/d teams made the playoffs, so better than naive probability of getting there, but a lot worse than the dominant hitting teams percentage at a little over 50% versus the 80 we saw before.  Three of the playoff teams did manage to cover up below-average offenses, but generally you need a decent offense to go along with dominant p/d.  A big reason for the difference is that the offenses tend to diverge from average to a greater extent as we can see in the top 2, top offense +190 and top p/d only +165.  This difference is consistent though decreasing in magnitude moving down the top 15s.

If you compare the pitching extreme teams’ actual wins versus their Pythagorean expectation it does not behave like the extreme offensive group did.  Out of the top 15 pitching extreme teams, 11 had fewer wins than expectation.  The two tail p-value on a paired t-test for actual versus expected is 10.4% which doesn’t make for a strong conclusion, but probably means this needs some more attention.  So what does all of this mean for this year’s playoff race?

The extreme run scoring teams for 2014 are Oakland, LA Angels, and the Blue Jays.  Detroit was close, but they also just traded away some offense, so I will save them for another day as I think they are interesting right now too.  Oakland is a lock for the playoffs and are the only team on pace to crack the top 15 of the past ten years with the offense trending toward being about 125 runs above average though the departure of Yoenis Cespedes may bring that back a little.  The Angels are also looking pretty good for the playoffs, but probably as a wild card due to Oakland.  Toronto is 2 games out of the wild card and needing to jump two teams, so they are in some trouble as their p/d is not doing so well.  Their only trade deadline move of note was to add Danny Valencia so they have not shored up the pitching much though Marcus Stoman and Aaron Sanchez have come up and maybe Daniel Norris will as well.

The extreme p/d teams so far this year are Seattle, Washington, Oakland again, and a couple of almost teams like Cincinnati and San Francisco.  Seattle is there with Toronto only flipped as they have a below average offense.  They added Kendrys Morales and Austin Jackson and Chris Denorfia to try and help, but all have struggled so far for the Mariners.  Oakland of course added lots of pitching in Jeff Samardzija and Jason Hammel and then Jon Lester, so don’t be surprised if they end up with the best offense and defense by the end of the year.  Washington added Asdrubal Cabrera to a very average offense and Matt Thornton to their bullpen, but since they are almost a lock for the playoffs they weren’t needing large upgrades.


Home Run Skewness, Babe Ruth, and Maybe PEDs

The breaking of baseball known as the dead-ball era is generally considered a phenomena of the 1919 Babe Ruth season where he hit a record 29 homers for the Red Sox.  That was a good year, but not something jaw dropping as three players had managed 25+ homers at that point and Ned Williamson’s record from 1884 was only two behind Babe.  The next season was the unprecedented explosion when Ruth redefined power posting 54 home runs doubling up anyone else who had ever played in the big leagues.

It only took a few years for the trajectory of offense, and especially home run production, to change drastically.  In 1922 Rogers Hornsby hit 42, Ken Williams 39, and Tilly Walker 37 all besting The Bambino’s paltry 35 that season.  Over the next several decades home run production shifted drastically as power re-shaped the game.

 photo HRSkew_zpsb90e19d4.jpg


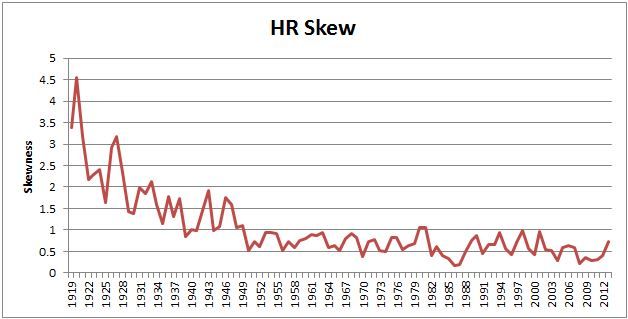
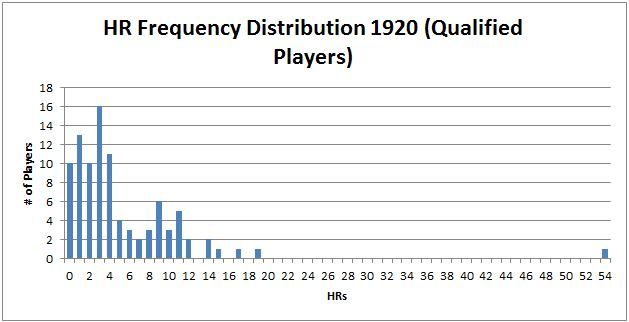
Skewness is based on the Excel formula where anything between -1 and 1 is not skewed, and since we have no negatives here we will focus on above 1 to start, or positive skewness (long right tail).  As you can see, the peak of skewness in HR production was that 1920 season where Ruth was an extreme outlier, see below:

 photo 1920HRs_zps20fcd686.jpg


You can see the skewness, a long right tail, and most of it is being driven by one observation.  Positive skewness was always present in early baseball due to the large cluster of players at or slightly above 0, but this took it to a new level.  If you go back to the previous chart though, you will see that as the league started hitting more long balls the skewness quickly dissipated, and by the late 40s went away.  Only twice since 1949 did we see a skewness above 1, in 1981 and 1981 where the skewness shows up as 1.05 and 1.04 respectively, so right on the dividing line between truly skewed or not.  Interestingly, the skewness leaves and stays away shortly after the talent pool widened with an influx from the Negro Leagues which may have cut out some of the lower end that was causing it.

One of the things to keep in mind for all of this is that a lot of people look at the steroid era as another period where baseball was broken with scientifically enhanced freaks blasting way more home runs than should be seen.  Yet, in the data we don’t see a large spike in skewness through that period, which of course leads to a lot of ambiguity and no answers as you could read it in multiple ways including the two extreme views:

1) See, EVERYONE was cheating in the steroid era, so the entire distribution shifted enough to prevent even 1998’s home run chase ending with two players breaking the all-time record from becoming a skewed distribution.

2) Despite the cheating nothing was all that greatly affected.  There happen to be  a couple of cheaters who succeeded, but mostly the cheaters stayed with the pack and thus we see no skewness.

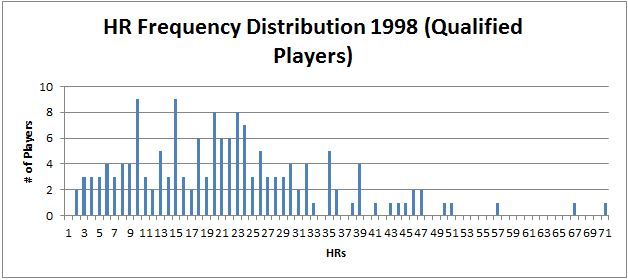
So what did the distribution look like in 1998?

 photo 1998HRs_zpsc52198d3.jpg

Rather than the highest frequencies being 0 to 4 home runs and then tapering off quickly like 1920, we now see that every qualified batter came up with at least 1 HR and that the largest mass is from 9 to 23 home runs.  This means that Mark McGwire’s 70 HRs was about 3.5 times the average and median which were 20.7 and 20 for the year.  In comparison, Babe Ruth hit 10 times the average of 5.3 HRs in 1920 and 18 times the median of 3, so you can see how much farther from the pack he was.

Whether or not PEDs broke baseball again is not something I am prepared to answer here, but we can at least say it didn’t break it to the degree that Babe Ruth did when he signaled the end of the dead-ball era.  What we can tell from home run production is that it seems to be distributed fairly evenly and has been for more than half a century of baseball in which time we have seen many changes to the game.  All that leaves me with is more questions in reality, and that is just fine by me.


Streakiness

Streaks in sports are looked at a lot, just Google hot hand baseball, basketball, etc.  There is a lot out there on whether or not players can actually get into a groove or if it is completely luck-based.  I want to look at team streaks though, not that this hasn’t been done before, and see which teams are the streakiest so far of 2014 to see which teams might have a run in them as they are chasing the playoffs.

To measure this I wanted to treat all games as part of a streak, so each game was given a value.  A loss is defined as -1 and a second loss in a row would then become -2 and so on until the team won which would then be given a value of 1 with additional wins adding on top of that until a loss occurred.  If you then just look at the standard deviations of each team by this measure it should be easy to see who has been the most streaky.  One of the expectations of this measure would be that this would lead toward higher values for teams farther away from .500 as you have to have to string together wins (losses) to diverge significantly above (below) that mark, but those teams also don’t tend to have long losing (winning streaks) so their one-directional streakiness keeps them from being at the top of the list.

Streakiest (St.Dev.)                                              Least Streaky (St.Dev.)

Tampa Bay (3.14)                                                  LA Dodgers (1.62)

Boston (2.89)                                                          Baltimore (1.89)

Kansas City (2.76)                                                 St. Louis (1.89)

Detroit (2.75)                                                         Pittsburgh (1.91)

Atlanta (2.70)                                                          Arizona (1.97)

*data through games on Sunday, July 27th

Streakiness, or lack thereof, does not make you a good or bad team.  Detroit and Atlanta are streaky and good, Boston is streaky and bad, and Tampa and KC are streaky and near .500 on the season.  On the not streaky side Arizona and the Dodgers are on extreme opposites of the spectrum.  Just to make sure the measure didn’t bias a lot as you moved away from .500 in either direction I modified it by taking the standard deviation as a percent of the greater of wins or losses.  The top 5 still included Tampa Bay, Boston, KC, and Detroit in a slightly different order with Atlanta falling to 6th and being replaced by Miami.  The low end behaved similarly, so I will stick with the first measure as it looks like there is no bias toward good or bad teams.

One of the other things I wondered was whether or not streaky teams had high volatility in their runs scored or given up.  Looking at both standard deviation of runs scored and allowed, and then those as a percentage of average runs scored/allowed it does not look like this is the case.  The correlations for volatility in runs scored or allowed with streakiness are low, so I took it a step farther and looked only at teams that have high relative volatility in both runs scored and runs allowed.  This group has an average streakiness rank of 11.3 versus and expectation of 15.5, so maybe there is something there, but it is not even close to convincing.  I am going to need a lot more than one partial season of data to see what makes a team streaky.

As we head into pennant chase season this idea of streakiness may make things more interesting.  For instance, Kansas City and Detroit are atop the AL Central and streaky, which could make that race a lot more fun to watch as the standings are likely to vacillate more than most, especially since Cleveland has been relatively streaky as well.  On the other hand, the Dodgers might be harder to make up ground on as they consistently avoid long streaks.  Tampa Bay and Baltimore are on opposite ends of the spectrum with Baltimore hoping the Rays will fall back into the negative streaks after gaining a lot of ground recently.  They of course have an average streakiness Yankee team and a little bit streaky Blue Jays team to worry about as well.


Changes ZiPS Believes In

Mitchel Lichtman’s projection pieces on hitters and pitchers for the rest of the season were discussed quite a lot last month starting with this.  It is hard when you are rooting for a team, and subsequently its players, not to buy in when someone is doing well or poorly.  So let’s look at the heartless projecting system ZiPS to see if it is actually buying into some of the performances of 2014 so far.

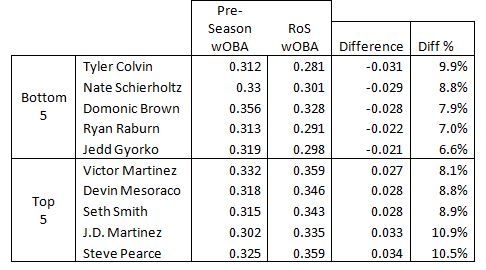
To do this I pulled the 2014 pre-season wOBA projections and compared them to the ZiPS (RoS), rest of season, projections.  If you take the RoS wOBA minus what ZiPS was expecting prior to 2014 you should be able to see which players are now expected to hit significantly better or worse the rest of the way.  Here are the top/bottom-five players:

 photo ZIPSros_zpsebe79a2a.jpg

The bottom five, with the exception of Colvin, have been very disappointing and their respective teams would love even the RoS numbers at this point.  The projection still believes Brown can be an above average offensive player despite his putrid play to this point of 2014, but it is starting to look like Raburn’s age might be catching up to him and Gyorko’s rookie year might have been a mirage.  Schierholtz makes less sense, but he has been so bad that ZIPS can’t ignore it, and he was never a great player to begin with.

Others names of note that are projected to finish the year worse may not be surprising.  Raul Ibanez looks done with eyes and statistics, Jean Segura’s lack of plate discipline has really caught up to him, and Brian McCann may not be aging particularly well despite being a lefty with power in the Yankees’ home park.

There are a lot of players on the positive side, and you can see that the nominal and percent wOBA changes are larger for the improvement group too.  There are 31 players with RoS wOBA at least 5% above their pre-season projection while only 17 projected to be 5% or more worse than expected.  Does this mean that ZiPS is actually an optimist?

The Padres believe in Seth Smith as well, having recently signed him to extension.  He is a righty masher, though they only rarely let him face same-handed pitching.  Victor Martinez is 35 years old and decided to have a renaissance, and may end up with his best hitting season ever.  Baseball is weird.  I’m not sure what to make of Steve Pearce.  He has been around since 2007 without ever accumulating more than 200 PAs, but this season he finally has and the Orioles are making out like bandits.  The other two are what you expect on such a list, young players taking a step forward.  JD Martinez was who I was thinking about when I started this.  I have seen him play several times recently, and he seems to put together a quality plate appearance every time up. Mesoraco, like Martinez, is 26 and has had a huge power spike along with a lot more strike outs to the point where he seems like a different player altogether.

Two Cleveland Indians just missed the top five improvers: Michael Brantley and Lonnie Chisenhall seem to have finally taken a step forward too.  There were two notable Brewers as well.  ZiPS seems to have finally decided to believe in Carlos Gomez and Jonathan Lucroy.

Yes, believing in projections sometimes means we need to temper our enthusiasm when a player we like breaks out or be patient with someone slumping.  It can also be a good way to see when players are truly locking into higher levels of play.  For the older players here it is likely that they will come back to the pre-season projections again next year because Victor Martinez is probably not going to turn into a much better hitter year after year at this age, but for the younger guys we may be starting to see who is taking a step forward.


Historic Lack of Positional Development All-Star Team

As a Royals fan, I have subject to a horrific progression of shortstops during my lifetime that seems to have finally come to an end with Alcides Escobar.  That’s good because I am not sure I could have taken any more Neifi Perez, Angel Berroa, Tony Pena Jr., or Yuniesky Betancourt seasons.  Only Freddie Patek accumulated more than 10 WAR in his Royals career for SS with more than 1000 PAs, and he of course retired the year before I was born.  All the shortstops who meet that criteria for the Royals added together have 59.9 WAR from 1969 through 2013, so for the Royals existence they are averaging about 1.3 WAR per season at short.  Is that the worst organization at SS ever?  Let’s find out.

I went position by position to find which organization is the most inept historically at each.  Only players who had 1000+ PAs for the team though they didn’t need to play exclusively at that position and I am not including anything in 2014.

Catcher –

The Rays put up an impressively bad 0.55 WAR/year at catcher, but in the end I am going to give the Astros the nod for the first position of my All-Star team.  Over a 52-year span, their organization’s best catcher was Alan Ashby who only managed 9.7 WAR for the team.  Not even one player in double digits of WAR in half a century is pretty impressive.  All told this group managed 48 WAR for a paltry 0.9 per season, or the value of Humberto Quintero last year as a back-up.  It is hard to keep up that bad of a pace for so long.

1B –

First base is traditionally manned by a large person who can mash.  That has not been the case for the Nationals/Expos.  The Diamondbacks gave them a run here, but Paul Goldschmidt kept them from taking the position.  The Nats/Expos best first baseman by accumulated WAR has been Ron Fairly at 17.5 total.  If your best 1B option in 45 years slugged .440 for you, basically Jorge Cantu or Brad Wilkerson, then you are doing something wrong.  They did have better players, but at the wrong time.  They had young Andres Galarraga and old Tony Perez who did most of their stat accumulation elsewhere, and of course the rented Adam Dunn for a couple years.  Still they have only managed 80.1 WAR for a traditionally big bopping position, and that is about 1.8 per season.

2B –

There were some solid contenders at second, but in the end the Rockies despite being relatively new were bad enough to get the spot thanks to Jim Gantner and Rickie Weeks being just good enough to save the Brewers.  The Rockies have been around for 21 years now, and in that time their best player by WAR at second base is Eric Young at 9.5 total.  Even that is cheating since he only played at 2B about half of the time, but my arbitrary parameters for the team allow all  to be counted.  In second for them is Clint Barmes at 3.9, so it is quite a steep drop-off from not so lofty heights.  Their second basemen have only managed 14.7 WAR total in over 2 decades for a rate of 0.7 per year.  Babe Ruth once put up more WAR than that in one season.

SS –

I was truly expecting the Royals to run away with this, but Patek was enough to keep them out of short, though they still managed to make the team.  In the end, the Padres were just too weak to ignore.  In 45 years the best they have been able to manage from a player at short is the 8.7 WAR that Khalil Greene managed to amass.  Their BEST player at the position had a career slash line of .245/.302/.422, which is not so good.  They had the first four years of Ozzie Smith’s career, so at one point they had a future Hall of Famer at the position, but they even managed to screw that up by trading him for which they received Gary Templeton (second to Greene at 8.4 WAR), Sixto Lezcano, and Luis DeLeon.  Ouch, how is this trade not discussed more for its awfulness?  Total Padre SS WAR of 42.5 gives them a 0.9 WAR/season.

3B –

This was the only position where I selected a team with more than 2 WAR per year, though how they got there makes it less impressive.  I went back and forth on this, but the Tigers ended up getting it due to the more than 100 years of marginal to terrible play at third.  That is a long time to fail to produce any good players.  Their WAR leader at the position is Miguel Cabrera, of course, at 35.1, so to get a good player at third they had to trade for a stud and then play him out of position for two years to get to the plate appearance level I set.  Before Miggy, the best they had managed at third was Travis Fryman followed closely by George Kell who put up 24.6 and 23.4 WAR respectively for Detroit.  Those aren’t terrible players, but again they had over 100 years and that is the best they could do.  With Cabrera they ended up at 231.5 WAR in 113 seasons for just over 2 WAR per year, but before he moved to 3B in 2012 they were at 1.8 per year.

LF –

Another corner position where you expect some power production…unless you are a Mets fan.  The Mariners do get a nod for having a slightly lower WAR per season figure, but the Mets extra decade and a half gave them the edge.  Cleon Jones topped the Mets LF list at 18.1 WAR, which is not awful.  He played 12 seasons, 8 of them as a full time player, and hit only 93 HRs.  At left field that is pretty mediocre production from your best ever.  Kevin McReynolds is their only player at the position to break the 100 homer mark.  Their total was 96.9 WAR in 52 years for a rate a little shy of 1.9 per year.

CF –

The Marlins looked like a slam dunk at first here with their top guy being Juan Pierre, seriously that should get you spot on the team shouldn’t it?  Then the Rangers came along and stole the spot out from under them.  Josh Hamilton got 1400+ PAs to keep this from being a complete disaster of a position for Texas.  His 21.8 WAR while he was with the team is almost double their second place center fielder, 11.1 for Don Lock.  Prior to Hamilton the Rangers had managed one double digit WAR player in center over a 53 year span.  With Hamilton their total and rate are 79.5 and 1.5 per year, but prior to Hamilton (pre-2008) it was 57.7 and 1.2 per season.

RF –

After shortstop was done I thought my team was in the clear.  Then we got to right field.  The Royals have had some decent right fielders like Jermain Dye and Al Cowens, but they have also had Jeff Francoeur and Jose Guillen.  Danny Tartabull is tops with 13.9 WAR, and is the only one in double digits and he was only a Royal for five seasons and fought injuries a lot in the final three years only playing in 133, 88, and 132 games those years.  Right fielders for the Royals have accumulated 59.9 WAR over 45 seasons for a rate 1.3 per year, and I am now convinced that Wil Myers was traded to avoid losing this distinction.

SP –

For pitching I looked at each teams top 5 starters by WAR all time.  There were only 3 contenders for sum of those 5 divided by years for the organization, and they were the Brewers, Padres, and Rangers.  The Rangers already have center field and the Padres shortstop so I thought about giving it to the Brewers for no repeats.  Instead I am going to make the rotation all three teams because I can.  Here are their respective rotations.

Brewers Padres Rangers
Ben Sheets (29.6 WAR) Jake Peavy (24.6) Kenny Rogers (26.1)
Teddy Higuera (28) Randy Jones (21.4) Charlie Hough (23.7)
Moose Haas (20.6) Andy Benes (21) Kevin Brown (22.3)
Chris Bosio (19.9) Andy Ashby (15.2) Fergie Jenkins (22.1)
Yovani Gallardo (16.9) Bruce Hurst (14.8) Nolan Ryan (21.6)

Texas gets the first spot in the rotation.  They are tied with the Padres for the worst 2.2 WAR/season of existence for their top 5, but what sets them apart is that three of their 5 are players from other organization so only Kenny Rogers and  Kevin Brown were developed by them.  The Padres top three were all drafted and developed in house, so they get to go second.  The Brewers rate was a bit better at 2.6 WAR per year and go third.  Only the Rangers have a real chance of escaping their current position if Yu Darvish can continue being awesome, he already has 13.4 WAR and is only 27, so he could pass Ryan in a couple more years.  The top of the other two rotations right now are Yovani Gallardo, currently 5th for the Brewers all time, but he is trending the wrong way and is only controlled through next year.  Ian Kennedy is at the top for San Diego right now, which explains a lot about their season.

There you have it, historic ineptitude by position.  I am going to go ahead and leave the relief pitchers alone.  That will be my fan vote I guess, so go figure out your favorite and comment below.