Author Archive

Breaking Down the Aging Curve Some More

Now that I have gone through the individual cohorts in parts 1, 2, 3, and 4 (click them if you need some background in what I am doing).  To start I will show you three charts with some simple, and I don’t think overly shocking, things to remember.  Then I will get into some regressions that will hopefully help explain what I think is going on.  Keep in mind throughout this that the groups that should be trusted most are the larger cohorts, 22 to 26 year old first full seasons, as the others might have some sample size issues and you will see in these charts that 19 and 20 year cohorts don’t behave well in almost all cases.

First up is this:

 photo 1stYearofMaxByCohort_zps2f9ded4d.jpg


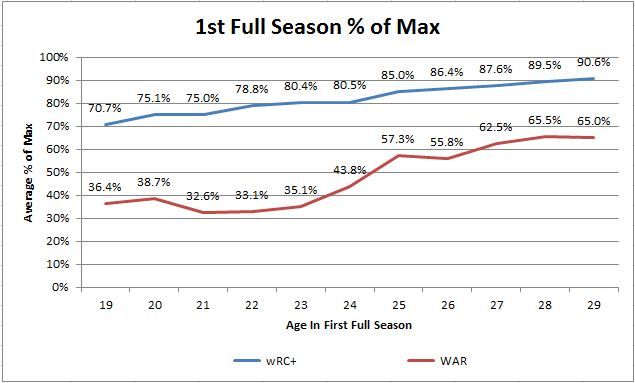
If you look at the average percent of max for each cohort in their first season, it shows an upward sloping line for both hitting skill and overall value.  The younger cohorts are therefore farther from their peak production when they show up in the league and should be expected to grow if they stick around.  You see a lot higher percentages for wRC+ versus WAR mostly from a scaling and volatility difference.  Going from 1 WAR to 2 WAR is a 100% improvement and not terribly hard to do.  Going from 80 wRC+ to 160 wRC+ is much, much harder, and 1 standard deviation for wRC+ is about 25% of the average while it is almost 100% of average for WAR so wRC+ is significantly less volatile relatively.

Those characteristics mean that randomness around your true talent level means that 50% of max WAR on average means that the cohort might already be at peak true talent level from 24/25 years old and due to volatility it is hard to get very close to 100%, but the hitting gets much closer.  Anyway, players coming up later are much closer to their peak on average and just don’t have much room to grow.  Next let’s look at the two stats, starting with wRC+, at overall level rather than percent of max production:

 photo 1stwRCVSmax_zpsb9114e86.jpg


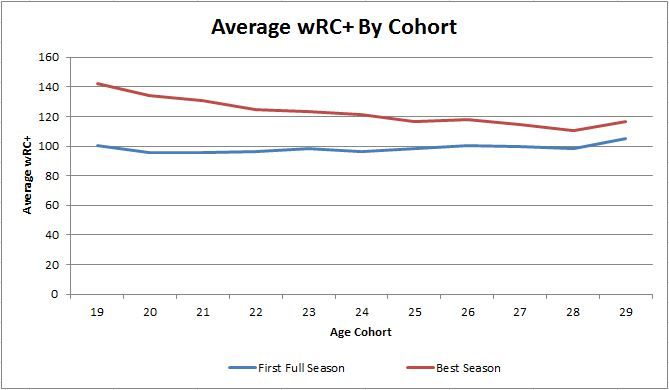
In the first full season each cohort performs at a very similar level, and the older cohorts might actually slightly outperform the younger.  That is a pretty flat line for first year average.  If you take each players best season though, the younger cohorts destroy the older cohorts.  Every cohort before age 25 has an average best of 120 wRC+ or better, so most of the players in those cohorts are going to put up at least one season in the Chase Utley of the last 2 years range, which is pretty good.  After that the difference between the average of the first full season and the peak shrinks down to 10 to 20 wRC+, well within one standard deviation, so the peak looks more like a season where luck pushed a player above average rather than a change in expected performance level.  That’s why we saw players in the cohorts after 24 seem to be at peak and only decline after entering the league.  WAR behaves similarly:

 photo 1stWARvsMaxWAR_zpsd7bc79b6.jpg


Again, 19 and 20 year olds are few and far between, but seriously and average best season of 5 to 6 WAR is pretty staggering as last year only 12 position players made it to 6 WAR or better.  On average the cohorts mostly show up around 1.5 WAR in their first season, and again the older cohorts probably are a little better in their first year.  The best season averages are again much better with a downward slope on the best season averages that starts to flatten out in the mid to late 20s, and I think it is easier to see on this chart than the first.  On average players enter the league at about the same level hitting and as overall producers, but those who can manage that at a younger age (before 25) generally go on to higher performance levels than the players who debut older.

Next I am going to show three regression outputs to try and explain what I think is important to remember for aging of players.  I will try to explain what I am doing so that if you don’t have a background in regression analysis you can still get the point.  If you do have a regression background, know that I am focusing on a couple of key ingredients so they are not intended to be perfect models.  Mostly I am trying to use data to illustrate a point.

 photo REG1_zps32536599.jpg


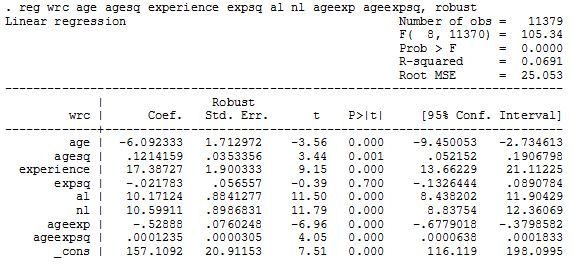
So first I went back to all data and ran this OLS specification with wRC+ as the dependent variable.  I was looking at two things, we expect age to affect players in a nonlinear fashion (aging CURVE) so I put in an age and age squared term and did the same for experience where 1st year in the big leagues is 1, 2nd is 2, etc.  AL and NL are probably not necessary but are controlled for in wRC+ and I just went ahead and stripped that part out since I had it there in dummy variable form.  Then I added interaction terms where I multiplied age and experience to see if the combination of the two is important rather than them acting independently.  The only term that came back insignificant was experience square which gave experience a purely linear relationship to hitting performance and also shows why this would be a bad model to lean on in predicting player performance.

The coefficient for experience is 17.4 so the model is saying each year of experience helps the player’s wRC+ increase by an average of that amount.  Other factors, age and age/experience interaction are negative and working against that, but this strong positive experience coefficient makes it so that if you model out a generic player of any cohort they get better at hitting for an unreasonable amount of time before the negative coefficients catch up because age*experience as a multiplier is getting bigger faster.  For the age 21 cohort the first year a player would start to decline would therefor be predicted in year 13 at age 33, and for the 27 cohort year 10 age 36 going against everything we know.

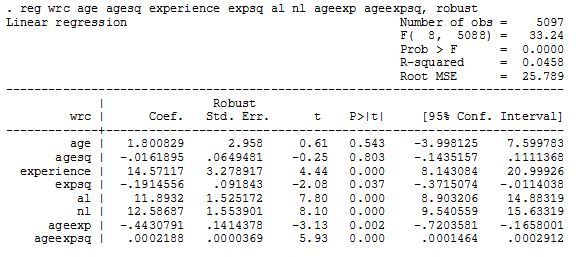
This is I think mostly due to survivor bias (I have discussed this before).  Let me show you what causes this with another regression output.  In this one I intentionally bias the sample by only including players who have 10 or more full seasons.  This reduces my original number of player from 2,054 down to 390, so about 19% of position players that get a full season end up with 10 or more for their career according to this set of players and they have an inordinate effect on a regression of the whole group.

 photo 10plusyearREG_zps46d068c3.jpg


In the first regression there were 11,379 observations (player years), but 5,097 came from this group of players that made it 10+ years.  That means 19% of the players are making up almost 45% of data being used!  They are also in general the best players, which is why they stuck around for so long and thus made it look like experience was a huge positive above.  Within just these players you see that effect is still strong with an experience coefficient of 14.6, but it is no longer linear as experience squared is now a significant negative showing the curve I would expect of experience.  Experience, at least in my expectation, should be beneficial to a player, but have diminishing returns (less effect in each year of experience) and this model shows that.  If you play this model out for the same cohorts I did before it does a better job of showing the peak in the mid 20s, but then continuing production for a lot longer than we would expect for an average player.  That’s fine, I just wanted to show why it is hard to tell how the general player ages because of the undue power of the players who stick around for so long.

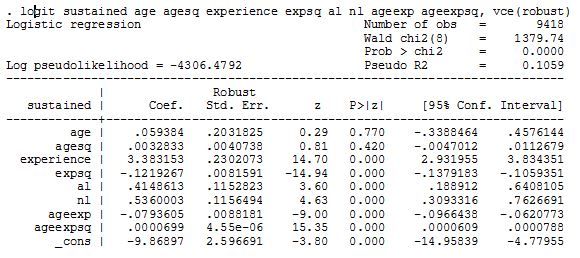
Finally, I want to show you one more regression and discuss some things I think are important for aging in baseball players.  In this one I focused on differencing of wRC+ (e.g. year 2 minus year 1) and created a variable called sustained.  Sustained is a dummy variable that shows years in which a player was better than a previous wRC+ level in two consecutive years.  So if a player had a wRC+ of 100, then 112 the next year and 108 the next it was sustaining higher performance.  Also, since I am using differences in wRC+ instead of the values themselves all 1st year player data is gone since there is nothing to difference it from.  This could be considered as biasing data again, but since we are looking at aging curves players need to stick in the league to see anything so I am doing a study only on those players rather than one and dones.  Here is the output, then more discussion:

 photo REGlogit_zpscaff049a.jpg


Sustained is now the dependent variable, and it is a binomial variable, so I had to move to a logit model.  That means the coefficients are now hard to directly interpret them since they are log odds of the sustained outcome rather than actual units of wRC+ as before.  This model does show what I believe to be the case after breaking all of the aging curve into age cohorts.  It does not show age or age squared as significant, it is showing that experience matters and that the interaction of experience and age matters.  Players who can get major league experience benefit most from getting that experience younger.  There is an obvious endogeneity issue here that that it may be the other way around, players that can get to the majors younger are better players.  I think there is truth in both statements though.

Yes, a player who can handle playing at the major league level at a younger age is likely better and should have a higher expected peak.  On top of that though, the model here is showing that the experience for such a player may also matter.  Playing against better competition makes players better, this is a commonly held belief and there is research to back it up if you want to go over to Google Scholar if you want to search around and read some formal pieces on that topic.  For an anecdotal example let’s look at a couple of players. Jose Guillen came up at 21 and muddled around for several years posting 82, 83, 67, and 88 wRC+ numbers in from 1997 through 2000, only got 145 and 259 plate appearances the next two years, and then finally put up a 138 wRC+ followed by three more above average seasons.  Around the same time there was a guy named Travis Lee who was not in the majors until 23 and posted a 102 wRC+ as a rookie.  He hung around for awhile with a peak of 112 wRC+ in 2003, but had a pretty unspectacular career.

Would Travis Lee have been able to put up an 82 wRC+ a couple years before his 102 at age 23?  I have no idea, but it is possible that if he had, and had two more years experience before that 1998 season that was his rookie year that he might have developed very differently.  The interaction term of age and experience is therefore very important in my opinion.  The model shows that experience is an arc that first increases, peaks, and then decreases in probability of reach new sustained performance levels.  If you look at it in conjunction with the age times experience and squared term of age and experience it shows that the probability of reaching a new and higher level of production is higher for a younger cohort (I’ll forgo posting the numbers for expediency), peaks in the mid 20s, and then drops off fairly quickly.  That is what the aging curve probably looks like based on all I have done so far.

Breaking Down the Aging Curve: Late 20s

This will cover the last set of cohorts, click the links for parts 1, 2, and 3 if you want more info on what I am doing or read on if you are already up to speed.

Age 27 Cohort:

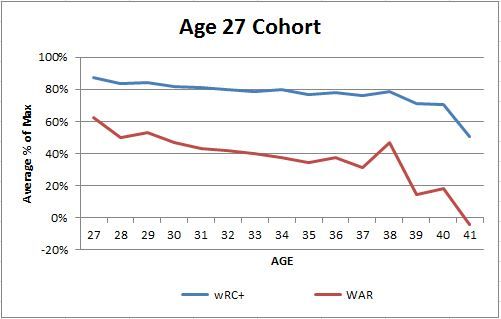
This group started at 173 players with 54 only playing one season leaving 119 for my purposes, and they averaged 5 full seasons each.  Out of the 119, 49 (41%) maxed out their wRC+ in their first full season and 44 (37%) maxed WAR.  Both of the groups that maxed out in year one averaged 3.2 full seasons in the big leagues.

 photo 27percentofmaxchart_zps5e6fb276.jpg


The same thing we have seen since the age 25 cohort continues, a clearly declining performance trend in aggregate from the time they show up until they leave.  In year 1, these players are hitting on average at nearly 90% of their max, so there is almost no chance of a large increase in subsequent seasons.

Age 28 Cohort:

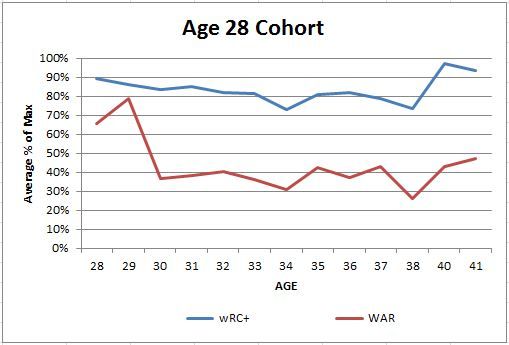
Sample sizes are going to start becoming a big issue again as only 110 started and 38 only played one 300+ PA season.  The remaining 72 averaged only 3.7 full seasons.  For those that were maxing wRC+ or WAR in year one, both groups included 32 of the 72 (44%) and averaged 2.7 seasons and 3 full seasons respectively.

 photo 28percentofmaxchart_zpsa53fa5a4.jpg


The chart does show an increase in WAR from year 1 to 2 do to an anomaly, but the hitting shows the 90% of peak on average and decreasing from there.  You can ignore the spikes in age 40 and 41 seasons as there was only one player accounted for there, Davey Lopes, who happened to hit pretty well those two seasons.  Without him it drops off like all of the others and ends at age 38.  You can see that by WAR the entirety of their decline is pretty much done by 30 years old, only their third seasons and thus the short careers.

Age 29 Cohort:

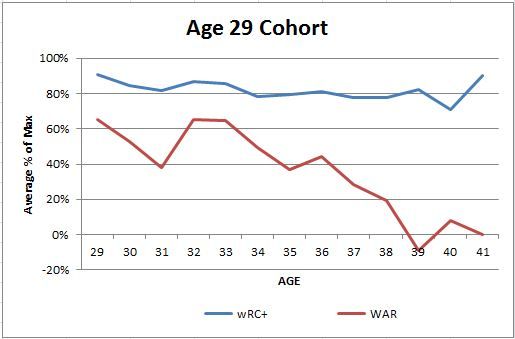
This group is nearing the point where it might be worth ignoring anything you see with a starting group of 62 that gets whittled down to 41 players with more than one full season.  Those 41 averaged 4.6 full seasons in their careers, longer than the 28-year-olds because of a few guys that hung around awhile and the small sample.  One was Hideki Matsui who was a professional long before 29, but not in the United States.  I will discuss two others in a moment.  Out of our 41 players here 23 (56%) had their max wRC+ in their first full season, and almost 50%, 20 out of the 41 had their best WAR.  At a coin flip for whether we have seen their best or not immediately we have definitely hit the point where any real growth as a player is unlikely or purely luck driven.  Those two groups of year one max wRC+ and WAR had average career lengths of 3.7 and 3.1 years respectively.

 photo 29percentofmaxchart_zpsb8acfefc.jpg


Like the last group we see a little uptick at the end, and these were two of the odd players from this group that hung around.  Actually, Raul Ibanez is still hanging around currently in Minnesota with the Royals, and the other is a former Royal too in Matt Stairs.  Again, in reality this group is pretty much all declining from year 1 on and almost all are finished by their late 30s.  There is a large spike in WAR for ages 32 and 33 and a smaller corresponding one in wRC+ because 4 players had their best season at 32 and 5 players at 33 which is a significant amount out of a pool of 41 players.  Those two years along with the first full season of the cohort comprise over 70% of the players and so it is probably just a sample size issue that we see the early 30s uptick here.

I am done with the cohorts, or at least running through them all the first time.  Players that play their first full season at 30 or older were mostly ignored.  There were 92 of them total and about 80% of them maxed in year one or only had one full season, so to chart a growth pattern would be ludicrous for the other 18 to 20 players who didn’t all come up at the same age.  Next I will summarize this all and try and point out several other things that I learned from breaking these cohorts apart so that you can get the full picture, or at least as much of the picture as I have managed to see.


Breaking Down the Aging Curve: Mid 20s

In case you missed parts 1 and 2, you can follow the links especially back to one if you want to see what I am doing.  Otherwise it is time to look at the 24 year old cohort:

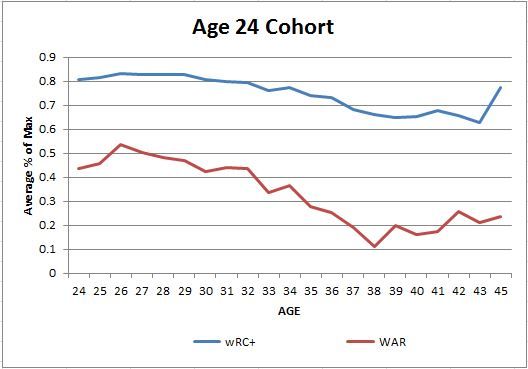
There were 362 players in this group, 64 of which only had one season of 300+ PAs, leaving us with 298 in the sample.  Those 298 averaged 7.2 years of full seasons.  Almost 21% of them (62 total) had their best season in year one according to wRC+, and for war it was just below 20% (59).  For those players the average career length was 4.3 and 4 years respectively.  I’m going to start speeding up the discussion only highlighting things of interest so that we can get to a more comprehensive picture.
 photo 24percentofmaxchart_zps0b3bf593.jpg
The 24 cohort chart shows a couple of years of modest improvement before starting their decline though wRC+ stays pretty flat until age 30 or so.  We have seen some similar patters up to this point, but those are going to end with the next group.

Age 25 Cohort:

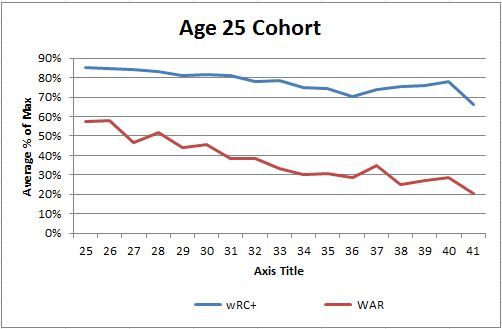
This group was comprised of 343 players in total.  After taking out the 59 that only had one season I had 284 left at an average number of 5.9 full seasons.  About 30% of those players had their best season in their first full big league chance (86 for wRC+ and 87 for WAR) with average length of career for the 1st year max group of 4 years for wRC+ and 3.7 for WAR.

 photo 25percentofmaxchart_zps0e1b58f0.jpg


This is where this cohort is getting more interesting.  They seem to only decline as a group after their first full season.  There doesn’t seem to be any appreciable increase in hitting or overall performance throughout their careers.  You will also see that they are therefore nearer their max as a group out of the gate as well.  Once I am through all of the cohorts we can discuss overall threshold of performance relative to these which will help us understand everything that is going on hopefully.

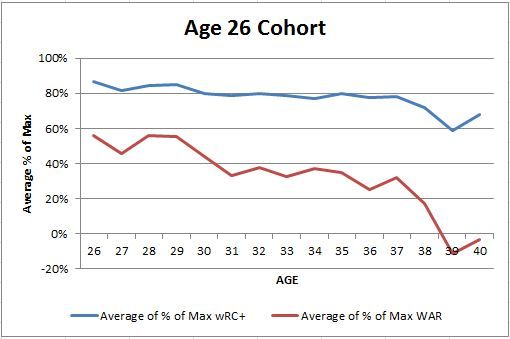
Age 26 Cohort:

Here is where the sample sizes start to shrink again as we get to ages where a lot of players have either quit or will never make it.  There are still 238 players in this group so it is relatively large (4th largest cohort), and 64 had only one full season leaving a group of 174 players who on average had 5.2 full seasons.  65 (37%) maxed out their wRC+ in year 1 along with 54 (31%) maxing WAR right off the bat.  Those groups averaged 3.6 full seasons and 3.3 respectively.

 photo 26percentofmaxchart_zps7e58f79d.jpg


Like the last group, this group seems to max out on average in their first year and are declining by their late 20s.  They keep up 80 or near 80% of their max in hitting into their mid 30s, but that I think is going to prove out as being two things.  The first will be survivorship issues since on average most of this group retired or were forced out of the game around age 31, and the second being that their starting threshold won’t be as high and will be easier to stay near.

We are getting close.  I will try and blow through the late 20s before the end of the week so I can summarize and give some things that I think are of interest overall.


Breaking Down the Aging Curve: Early 20s

If you missed the first part and want a little more explanation about what I am doing click here.  I am going to start getting into the meat today with larger sample sizes and more typical groups of players.

Age 21 cohort:

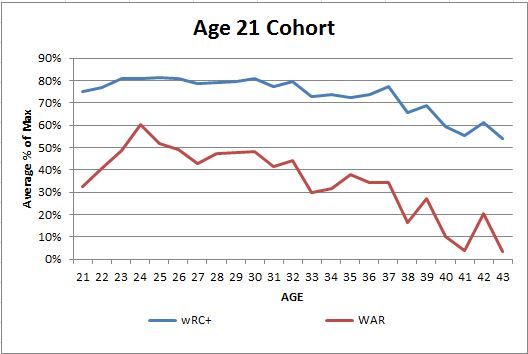
There were 102 players in this group, three played only 1 season and were removed.  This is not as necessary with this group, but it becomes pretty important in the later cohorts as you will see.  The main thing is that for the max % part it is automatically 100% for the first year for any player with only one full season.  The 99 players left have an average number of 10.3 full seasons in the majors, so less than the previous cohorts as expected but still long careers on average.  There were 10 players that posted their max wRC+ in that first full season, and 9 posted their max WAR.  Said another way, about 90% of the players went on to have their best season later in their careers making it unlikely that a 21 year-old reaching the 300 PA plateau minimum is showing you a career year.  Again, part of this is that they on average have 9+ seasons to go so they have a lot of opportunities to have better years which the older cohorts will not have.

We also start to see something else I was expecting.  The players who max out in their first year tend to have shorter careers because they are not as good of players on average and that first year max was not very high.  Those that maxed wRC+ averaged only slightly over 4 years of 300+ PAs, and the ones that maxed WAR were only 3.25 years on average (with one active player in the group.  There is some overlap, but the two groups are different and will be for every cohort.  It is likely the trend here continues as well.  If you max WAR your first season it means you are not showing overall improvement later and leave the league quickly.  Those that max wRC+ but not WAR are likely getting more playing time later due to defense or other peripheral skills that are making them better players overall.  On to the max % chart:
 photo 21percentofmaxchart_zps33a3ba20.jpg

It looks like there is some slight improvement in the first couple of years in hitting.  The increase is more drastic in WAR, partly because those that stick in the majors get more playing time and thus accumulate more WAR, but the increase might be more than that especially if the slight uptick in hitting is for real, though I will spend more time trying to tease that out after I have this base run through all the cohorts done.  You will notice that these players peak younger than our traditional understanding of peaks.  The group peak is around 24 and hitting stays around that level until their early 30s, but the WAR starts dropping the next season.

Age 22 cohort:

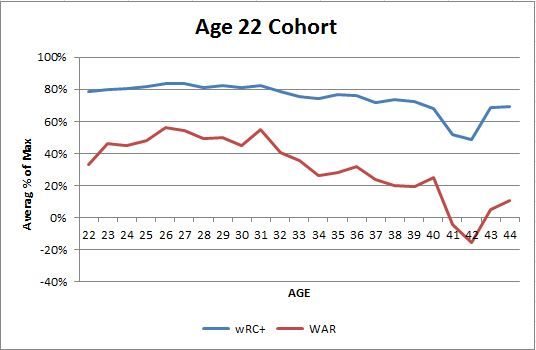
This group started with 200 players of which 41 only played 1 season and were removed.  The one season group in this case held a lot of current young players such as Wil Myers and Yasiel Puig, so this might be an interesting group to follow over the coming years.  The average tenure of the remaining 159 players was 8.6 full seasons.  Of those 159, 27 had their best wRC+ in their first season and 26 had their best WAR.  Now instead of 90% having better seasons later in their careers, we are down to 83 or 84%.  About one out of every six 22 year-olds never improve on their first full season.  The average number of full seasons for those that did max in year 1 was 4 years for both wRC+ max and the WAR max group with the second being only a few hundredths of years below the first.
 photo 22percentofmaxchart_zps34ed058b.jpg

The chart shows a less distinct increase in the first few seasons, but is upward sloping for both wRC+ and WAR until the age 26 season.  There is a similar decline pattern to the 21 year-old group.  The 21 cohort just had a steeper early incline and younger peak.

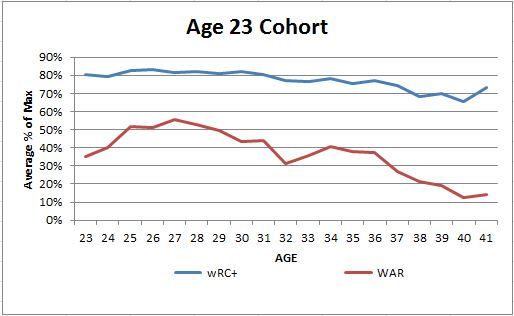
Age 23 cohort:

Now we start getting into the largest cohorts.  The most likely time for a player to get their first full season is from ages 23 through 25, and if you haven’t made it by then your odds as a player of ever getting a full season in the majors start to drop off.  This age group started with 320 players total and 43 were removed as one year players like before 7 of which are active players.  Of the 277 left they average number of full seasons played was 7.6 and now 56 had max wRC+ in year 1 and 52 a max WAR.  That is nearing the mark where a full quarter of the players are never better than their first full season.  Of those that maxed in year 1, the wRC+ group had an average of 4.3 full seasons and the WAR group was 3.9 years.  Frank Thomas was in the max WAR group, so despite playing 14 more seasons above the 300+ PA  level after 1991 (only 240 PAs in 1990) he never posted a higher WAR.  He had 2 seasons where is wRC+ were equal or greater than that first one, but didn’t amass enough PAs to accumulate more WAR, though in 1997 he tied the WAR and wRC+ of that first full season.  Anyway, chart time:

 photo 23percentofmaxchart_zps2715039d.jpg

It’s harder to see much of any improvement in hitting with this group. There might be a slight improvement peaking in the 26 season again.  WAR shows an increase that is fairly steady until age 27 and then another similar decline phase.  Another thing to note, the hitting % of peak average at its peak is consistently in the low 80%.  For WAR it is declining so far.  If you look at the WAR line on the three charts, the first hits a peak of 60.3%, the second at 56.4%, and the third at 55.8% and might be worth keeping an eye on as we go on to the next set of cohorts.  For now though I will wrap it up rather than going on for the 3 or 4 thousand words all of the cohorts and summaries might take.


Breaking Down The Aging Curve

Ever since I read Jeff Zimmerman’s aging curve article in December I have been thinking more about aging curves in general.  That has lead me to take a step back and start digging through players in a different way.  Jeff gave a couple of plausible reasons for the difference in aging curve, teams are developing players better prior to appearing in the majors and that they are doing a better job of identifying when they are ready.  I’ll throw another out there before I start this.  MLB has gotten younger recently and to do that you need to be pulling in more young players.  In general you would expect players first pulled up at each age point are in the farthest region of the right tail of the talent distribution and then you move left as you add more players from that group.  Maybe a larger percentage of the younger players being brought up just are not as good and won’t ever thrive at the big league level.  Anyway, let’s get to what I have started working on to see if breaking things apart can shed any light on the subject.

To start I pulled every position player year for rookies in the expansion era (after 1960) and ended up with 2,054 players and 11,585 player seasons including active players not just completed careers.  Then I broke players into age cohorts with when they played their first season with at least 300 plate appearances which I will refer to as full seasons the rest of the way.  I will be working through to see if players age differently based on what age they reach the majors and get regular playing time.  To do this I will mostly be looking at percent of peak wRC+ and WAR.  For this post I am only doing the first couple of cohorts and then I will work through more in the coming weeks.

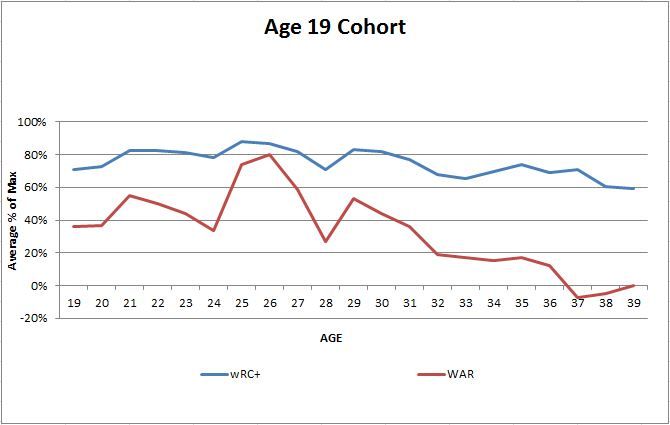
The first cohort I broke down was the age 19 group.  Only one player amassed the 300 plate appearances necessary at age 18, Robin Yount, so there is not much to learn there except that if you can hack it at the big leagues when you are 18 you are probably really, really good.  That will be true for the 19 and 20 year-olds as well, but there are more of them.  The age 19 cohort is also small with only 8 players; Ken Griffey Jr., Edgar Renteria, Bryce Harper, Cesar Cedeno, Tony Conigliaro, Ed Kranepool, Jose Oquendo, and Rusty Staub.  This will be the only cohort small enough that I will list everybody.  Interestingly the age 20 cohort has a lot more star power as Griffey is the only Hall of Famer (I know he isn’t in yet, but he will be on the first ballot).

Of the seven 19 year-olds that have retired, the average number of full seasons played is almost 13, so they did have long careers as you would expect.    None of the players peaked in wRC+ or WAR in their first full season, which is not surprising.  The more seasons you are in the majors, the lower the probability that the first season will be the best one just because you have more opportunities to best it.  Harper actually put up a better wRC+ in year 2, though his rookie WAR was better and this year isn’t looking like a new high for him so far.  If you take their average percent of peak at each age and chart it this is what you get:
 photo 19percentofmaxchart_zps8c04fc32.jpg
The sample size here is so small I wouldn’t want to believe it too much, but we might see some improvement for this cohort early in their careers.  The peak, if there is one, looks like 25 to about 27 especially in WAR.  Then it is all decline.  Again, these are players from the ERA that showed this before, not from players in the last 10 years that are not showing improvement in Jeff’s article.

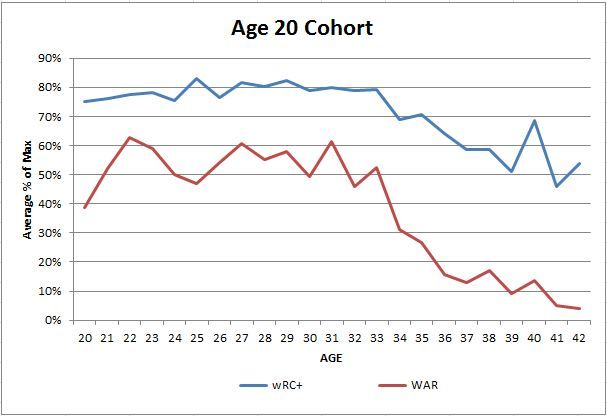
Let’s move on to a bigger group and see what happens.  The age 20 cohort includes 37 players with 10 current players.  There are Hall of Fame or near HoF players all over.  Rickey Henderson, Roberto Alomar, Ivan Rodriguez, and Johnny Bench are in along with Alex Rodriguez, Joe Torre, Andruw Jones, Gary Sheffield, Alan Trammel, Adrian Beltre, and Miguel Cabrera.  Mike Trout  is the only young guy I would assume has to eventually make it, but there are a couple others there that might eventually be that good too.  In my opinion, about a third of this group are HoF caliber or will be after their career is done.  That is 1 out of every 3 players that stick in the bigs at age 20 will be good enough to make it to Cooperstown.  Way better than the 19 year olds.  The average career length for those that are not active was over 11 years, so again most should not max out in their first year.

Only three players had their best hitting season as a rookie, but it was because all three of them had their only 300+ plate appearance season at age 20 so it was the only season in the sample.  Danny Ainge was one of the three though, so we could go see when his basketball career peaked instead maybe.  All three therefore also had their best WAR season at 20, but there was a fourth player who had his max WAR in that first full season, Claudell Washington.  Washington had 14 full seasons as a major leaguer and his best by WAR was year 1, and he had only one wRC+ better than that first year.  If we look at the chart for the age 20 cohort chart it looks way different than the 19 cohort.
 photo 20percentofmaxchart_zpse95fa760.jpg
Again, this is not a large sample, and it is overwhelmed by extremely good players.  There seems to be an increase in the first couple of seasons followed by a long, flat peak that for wRC+ goes all the way into their early 30s.  WAR is more volatile and might start declining a couple of years sooner.

I expect that this will get more informative as we get into more normal players and larger samples, but it is fun to look at elite players.  I’ll break down a couple of more age groups in the near future, and eventually try and build a regressed model for the bigger cohorts to control for the era and some of the other effects that aren’t rolled into wRC+ or WAR.


Over and Under-Performances in Baserunning

Right now Eric Hosmer is the worst base runner of 2014 by a decent margin over Adam Dunn.  This makes very little sense, well not the Adam Dunn part, but Eric Hosmer is an athletic player and not your traditional base clogging oaf.  For his career, Hosmer’s Spd rating is 4.4, which says he is right at average for speed overall.  Last year he was 11 of 15 on stolen base attempts and the year before he stole 16 bags in 17 tries.  You expect that the best base runners are fast and the worst are slow, and generally that seems to be true.  When it is not true though, there is an interesting difference in the groups.

I went out to look for two groups.  The first was a group of really fast players who had bad years on the base paths.  The cut-offs for them were an Spd rating of 7 or higher, considered excellent speed, and a negative Bsr and were therefore a liability on the bases despite their speed.  For Spd below average is 4.0, so for the second group I looked for players below that who managed to have great base running years, anything above 5 Bsr.

The total sample went back through the 1980 season for batting title qualified players, which included 5049 player years.  The group of fast players who had bad base running looks like this:

Year Player
1993 Al Martin
2003 Alex Sanchez
1984 Bill Doran
1983 Brett Butler
1991 Dan Gladden
1996 Fernando Vina
1982 Garry Templeton
1990 Lance Johnson
2001 Luis Castillo
1994 Luis Polonia
1984 Rudy Law
1990 Sammy Sosa
1991 Steve Finley

There are a lot of good players in there, and one legitimate superstar in Sammy Sosa.  You will notice that none of them repeated the feat either.  Only once in their careers did they manage to have the combo of excellent speed with negative base running value.  Most of them were just not very good base runners consistently and happened to have an especially bad year to get on the list.  Luis Castillo and Lance Johnson were decent on the base paths most years and had a few really good seasons.  Rudy Law had a Bsr of 10.6 the year before, by far the best season of any of these players, so I don’t know what happened in 1984.

Now to the group of over achieving base runners.  It is a small and accomplished list:

Season Name
2003 Albert Pujols
2008 Joe Mauer
2009 Ryan Zimmerman
2009 Scott Rolen

Again, no players repeated the feat, but this time the caliber of player jumps up.  Albert Pujols is an all time great.  Scott Rolen is a likely Hall of Famer, and Joe Mauer will probably get there.  The only one that isn’t likely to get to Cooperstown is Ryan Zimmerman, but it isn’t inconceivable that he could get there if he can get healthy and put some good seasons up through his 30s.  Even when they were young, none of these guys were particularly fast though Rolen managed to get a Spd of 6.1 once.  For all of these guys you can Google and quickly find things about their great work ethic and/or leadership qualities, so maybe only the truly diligent can make up for their lack of speed by being hard working students of the game.


Old Player Premium

One of Dave Cameron’s articles a while back showed payroll allocations by age groups, and it shows that over the last five years or so more money is going to players in their prime years while less is being spent on players over 30.  That seems to be a logical thing for teams to do, but that trend can only continue for so long.  Eventually a point will be reached where older players are undervalued, and it might be possible that we are already there.

There are several things to keep in mind when comparing these age groups, and one of the biggest is the survivorship bias.  There is a natural attrition over time for players in general.  Let’s look at an example, and for all the following I will be using 2012 versus 2013 as a way to see what happens from year to year.  To look at survivorship, I looked at all position players in 2012 and then their contribution in 2013 to see how many disappeared the next year.  The players that were not in the 2013 year could be due to retirement, demotion, injury, etc.  I also took out a small group that played in both seasons, but were basically non-factors in 2013, for example Wilson Betemit played in both seasons, but in 2013 he only had 10 plate appearances.  The attrition rate for the age groups looks like this:

Age Group % of 2012 Players That Did Not Contribute in 2013
18-25 22.2%
26-30 25%
31-35 29.3%
36+ 38.9%

As you would expect, the attrition rate increases over time.  Players in their late teens and early 20s who make it to the majors are likely to be given opportunities in the near future, but as the age increases the probability of teams giving up on the player, major injury, or retirement goes up.  Players who make it from one group to the next have survived, and that is where the bias comes in.  By the time you get to the 36+ group a significant number of the players are really good because if they weren’t they would not have made it so far.  This ability to survive is also a reason why they should be getting a good chunk of the payroll.  As I will show you, it leads to steady play which teams should pay a premium for.

The next step is looking at performance risk among the groups.  To look at this I took each group’s performance in 2012 and compared it to the group’s performance in 2013, again only with survivors from year to year.  I looked at both wRC+ and WAR just to see if only the hitting component or overall performance behaved differently.

Further, to calculate a risk level I looked at the standard deviations of the differences (2013 minus 2012) for each player, but those are not directly comparable.  Standard deviation is higher for distributions with higher averages due to scaling issues.  For instance, the average 36+ player had a 95 wRC+ in 2012 versus, which is more than 10 wRC+ above the average 18 to 25 year old in the same year.  A 10% drop or increase  in production is therefore a larger absolute change for the 36+ player, so they naturally end up with a higher standard deviation.  To take care of this I calculated the standard deviation of the difference as a % of 2012 average production as the overall riskiness measure.

Age Group wRC+ Risk WAR Risk
18-25 56.5% 167.7%
26-30 48.3% 118.9%
31-35 46.4% 140.7%
36+ 35.2% 92.8%

Don’t compare the wRC+ to WAR figures as there are again scaling issues, but look at the age groups.  A one standard deviation change is most volatile for the youngest age group, so the younger players are the most uncertain or most risky.  That is what we would expect as we have all seen prospects flame out.  The middle two groups are similarly volatile with the 31 to 35 group have a slightly lower risk level in the hitting for this sample and slightly higher overall play according to the WAR risk.  More years might need to be compared to see how consistent those groups are relatively.  The 36+ players are significantly less risky than the other ages.  If they decline by 1 standard deviation it will mean a smaller reduction in performance, less volatile and less risky.

The only thing that really hurts the older players is the aging curve.  They are more likely to see a decline in performance.  From the youngest group to oldest the percent of players who were worse in 2013 than they were in 2012 by wRC+ was 52.3%, 54.5%, 64.4%, 63.6%, and for WAR 52.9%, 48.7%, 56.7%, and 81.8%.  So it is more likely that the older players will see performance worse than the previous year, but again a drop for them will likely be smaller due to lower volatility and it is on average from a higher level of performance to begin with.

Older players are like buying bonds for your investment portfolio, you have a pretty good idea of what there going to pay in the next period with occasional defaults.  Younger players are more like growth stocks, you aren’t sure when or if they are going to pay dividends but when they do you can make huge returns.  Investors pay a premium for bonds (accept a lower rate of return) due to their stability, and teams pay more for older players than maybe their production seems to warrant for the same reason.

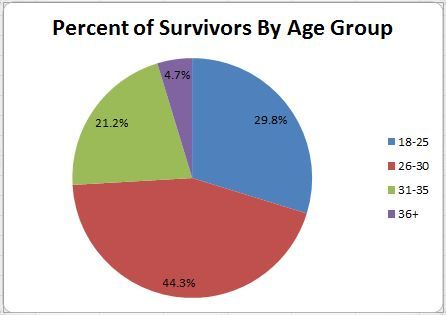
 photo Survivor_zpsee696878.jpg

If you go back to the payroll allocation, part of the shift is in the number of players in each group.  The 31-35 year-olds no longer get the largest chunk of payroll in part because there are more 26 to 30 year-old players.  Baseball is getting younger overall, so a larger portion of the money going to younger players is inevitable.  The 18 to 25 group isn’t getting a large change in payroll allocation because they are generally under team control, but the teams are extending the players at that age with the money showing up as they get into the next couple age groups.  Like Chris Sale, who is making $3.5 million this year on the extension he signed (he’s 25), but when he is 26, 27, and 28 he will make 6, 9.15, and 12 million respectively.

So the 36+ group, as you can see only 4.7% of the players, used to make about 20% of the total salaries paid, but now they make 15 or 16% (I don’t have Dave’s exact numbers).  Is that premium fair, four times more of the allocation than they make up of the overall player pool?  That is a tough question, and one I am working on.  If anyone can give me tips on how to dump lots of player game logs, that is probably what I am going to do next, but haven’t figured out how to do it without eating up my entire life.  Being more certain on this sort of thing, and having a relative risk measure for players could make contracts a lot easier to understand and predict.


Home-Run Environment And Win-Homer Correlation

Home runs are good, I think we can all agree on that, and in the presumably post-steroid environment they have been in decline.  Does that make the home run more or less important?  It is hard to say.  In some ways it means that they are more scarce, and you might expect that home run hitting teams might be at a larger advantage than previously.  On the other hand, teams that don’t hit a lot of balls out of the park will not be as far behind their peers if said peers are not taking the ball yard quite so frequently.  So which is it?

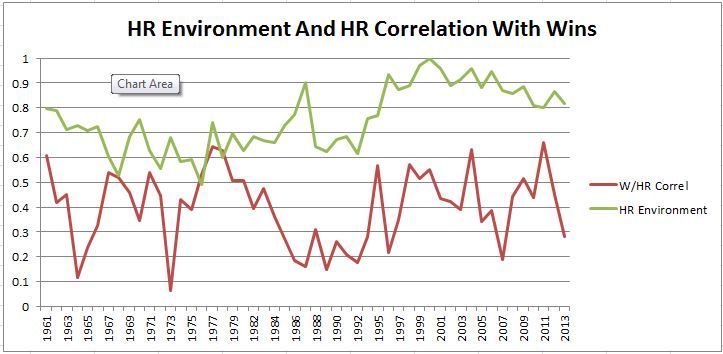
FanGraphs, of course, can give the answer.  I took every team in the expansion era (1961 and on) and then tracked two things year over year.  The first was how far each team was from the average home runs for a team, just home runs for a team minus the average of all MLB teams.  From there I calculated the correlation of those differences with the wins that the team accumulated in that year.  Then I tracked that correlation versus the overall home run environment.  To get them in the same scale I tracked home run environment as a percent of the max average home runs per team, so 2000 became 100%, or peak home run environment, as it was the highest average per team and every other year the average was some percent below that with the average in 2000 as the denominator.

I did omit 1994 and 1981 due to how much the seasons were shortened by strikes.  It made the overall graph harder to read.  The results look like this:


 photo HRenvironment_zps35a42fa7.jpg


And the answer is…it doesn’t matter!  Home runs are always positively correlated with wins, meaning it is never advantageous for a team to be below average when it comes to hitting home runs.  That correlation over time has a best fit line with a near zero slope.  Home runs are equally valuable with respect to winning in lower home run environments and the more recent high ones.  You can also see that the correlation is rather volatile ranging from barely positive to about .65 which is a fairly strong positive relationship.  Volatile, but never negative, so there are no years where a bunch of below average home run hitting teams took the league by storm.

The home run environment last year was back to 81.9% of the peak in 2000, and this year’s pace is a little slower than last with home runs in 2.38% of plate appearances rather than 2013’s 2.52%, which could reduce the total home runs hit by more than 8 per team for the year, though the heat of summer will probably close that gap up some.  It is likely though that the overall home run environment will be down to the levels we saw in 2011 and 2012, and maybe the drop off from 2000 has flattened out.

Anyway, I know everyone hates a non-result, there are published papers that have been published about the bias against them even, but this is still interesting to at least me.  You always want to hit home runs, we already knew that, but the value of the home runs should not be increased in times when they are scarce and they don’t become even more necessary during a homer boom.  This means that teams shouldn’t for instance overpay for a guy like Giancarlo Stanton right now because his power bat is more valuable in the current home run environment.  It means they should overpay so that their fans can enjoy the majestic blasts and feel content knowing they will be just as valuable as ever.