Baseball Analytics, Arthritis, and the Search for Better Health Forecasts
This article originally appeared on my blog “Biotech, Baseball, Big Data, Business, Biology…”
It’s Fourth of July weekend in Seattle as I write this. Which means it’s overcast. This was predictable, just as it’s predictable that for the two months after July 4th the Pacific Northwest will be beautiful, sunny and warm. Mostly.
Too bad forecasting so many other things–baseball, earthquakes, health outcomes–isn’t nearly as easy. But that doesn’t mean people have given up. There’s a lot to be gained from better forecasting, even if the improvement is just by a little bit.
And so I was eager to see the results from a recent research competition in health forecasting. The challenge, which was organized as a crowdsourcing competition, was to find a classifier for whether and how rheumatoid arthritis (RA) patients will respond to a specific drug treatment. The winning methods are able to predict drug response to a degree significantly better than chance, which is a nice advance over previous research.
And imagine my surprise when I saw that the winning entries also have an algorithmic relationship to tools that have been used for forecasting baseball performance for years.
The best predictor was a first cousin of PECOTA.
PECOTA*, for those less versed in baseball performance forecasting, is the name of an algorithm invented by Nate Silver for Baseball Prospectus in 2002-2003. The algorithm was created from the concept that how a given player will perform can be estimated based on that player’s most similar contemporary and historical peers. So, for example, to do a forecast of player X’s performance in the coming season, his physical characteristics and performance to the present would be compared to thousands of ballplayers that came before him. The most similar players would then be used to develop an individualized forecast model.
How does that apply to forecasting disease?
First, some background.
Crowdsourcing has been trending in science. Research organizations have been trying different tools and approaches to get groups of people working together to solve specific scientific problems such as the folding of proteins or the distribution of birds. In this case, Sage Bionetworks and the DREAM** consortium are running a crowdsourcing competition in biology and big data. Periodically these groups release challenges in which a large biological dataset and a corresponding biomedical question are released to the public. Any research team can enter the challenge, download the data, and try to find the best answer to the question.
As a reward the winning team gets a guaranteed research paper in a high-profile academic journal, as well as the prestige of winning and exposure to the larger analytical community. This is what incentivizes scientists. Not all that different from other fields, really, where the reputation economy is king. Or queen.
The groups that contribute the raw data will (hopefully) get a better answer to a knotty biomedical question. There are leaderboards that are updated in real time (gamification!) and completely transparent methodology, meaning anyone can build off the current best source code as well as exploring her or his own approach.
The biomedical question for this competition focused on response to drug therapy in RA. If a person with RA is not responding to first-line therapy–generally methotrexate and anti-inflammatories–she*** is prescribed a drug known as a tumor necrosis factor (TNF)-inhibitor, or anti-TNF. These drugs are expensive. They have list prices in the US of tens of thousands of dollars a year, and they also don’t always work. In general 20-30% or more of patients won’t benefit. And we don’t know why.
This is a problem for many reasons, not least of which is that hundreds of thousands of patients will take an expensive drug for two to three months with no benefit. This costs the world’s healthcare systems millions every year. RA is also a progressive, degenerative disease. During the time that it’s not controlled by medications, bone and joint destruction proceed and the damage is irreversible. You know when grit gets into the crank on your bike and wears down the bearings until you have to replace them? Like that.
So, a pretty big health problem. One in need of better forecasting.
The big data set used for this challenge consisted of genome variation data**** from over 2000 patients (the training set). Entrants used that data to build a forecasting algorithm to predict drug response. To test each entry and make sure the method was generally applicable and not over-fitted, every algorithm was applied to an independent dataset (the testing set) to see how well the algorithm performed. The result as described by the correlation between the predicted and the actual disease response, and by the area under the curve (AUC) for Receiver Operating Characteristic and Precision-Recall curves, were used as each entrant’s score.
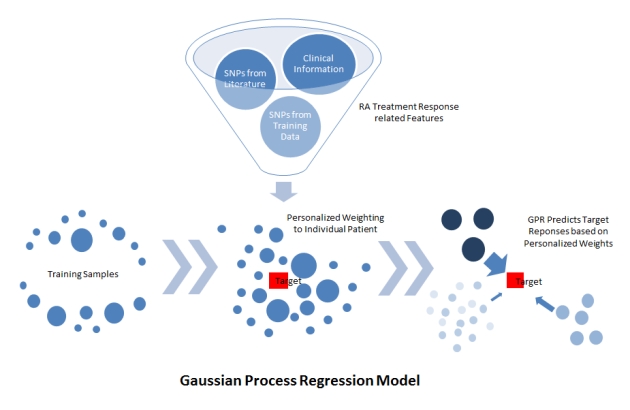
The two winning entries (the Guan lab at the University of Michigan and the Structural Bioinformatics Lab at the University of Pompeu Fabra, led by Dr. Baldo Oliva) both used the approach of Gaussian Process Regression. Rather than creating an algorithm that simply split the initial training set into patients for whom the TNF-inhibitor did or did not work (responders and non-responders), the winning approaches created a similarity metric and asked: for each patient which other patients were most similar to her.
Figure 1: Schematic of Gaussian Process Model methodology used by the Guan Lab (from https://www.synapse.org/#!Synapse:syn2368045/wiki/)
The responses to TNF-inhibitor therapy of those, most similar patients were weighted more heavily to create a forecast for each specific patient.
Like PECOTA.
So, some observations:
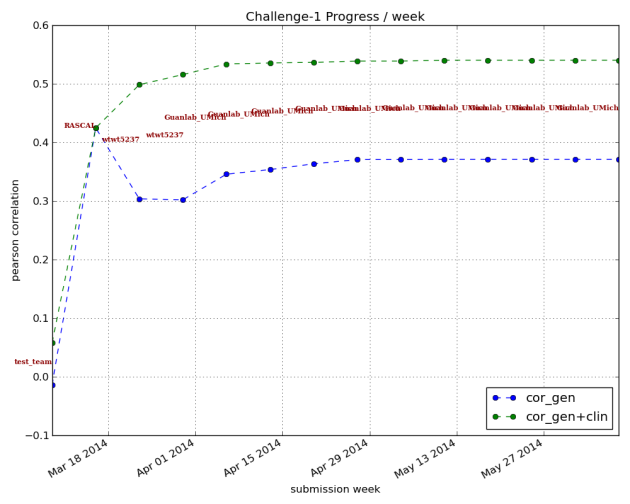
The first is that the forecasts still aren’t good enough. Here’s a graph showing the correlation between the prediction and the actual changes in disease score for the training study. The correlation using genetic information alone tops out at about 37-38%; when adding clinical information, the correlation is about 54%.
Figure 2: Pearson correlation scores over time for teams submitting algorithms for prediction of treatment response. Correlation is how closely prediction matched actual recorded changes in disease activity upon anti-TNF therapy. Blue line represents classifiers using genotype information alone; green line represents results using genetic and clinical information. Graph from https://www.synapse.org/#!Synapse:syn1734172/wiki/62593.
The guidance for when and how to apply different kinds of clinical tests in medical practice is necessarily a fuzzy thing. Beyond the basic statistical and technical questions of what are the false positive and false negative rates, tests occur in the context of medical care, treatment regimens, incidence within a population, disease severity and cost. One can see this in recent debates about medical testing. For example, when should women start getting regular mammograms?
Do mammograms detect potentially cancerous lesions? Yes. But given the normal age at which most women with breast cancer first develop the condition, the emotional and monetary cost of a false-positive result, and the question of how much early detection helps survival, and the cost and time involved, application of mammography to women is hardly clear-cut.
The winning classifiers for RA patient non-response to TNF-inhibitors are still not strong enough to guide medical treatment. And that means for now these classifiers may give us insights into how and why people respond (or don’t) to TNF-inhibitors, but won’t affect patient standard of care. Here we might say baseball is ahead of medicine in finding good algorithms to forecast the future.
This is not meant to be a slam at biomedical researchers, or a paean to SABRmetrics. Rather it’s a recognition of complexity. I would argue that athletic output on the baseball diamond is subject to fewer internal and external influences than drug response in RA, and therefore is simpler to model. In a biological situation like drug response in RA, there are a multitude of factors that play a role. Some of these may not have been measured in the current studies because we don’t know what they are or measuring them is too invasive, expensive, or impractical. The impact of factors may themselves be context dependent.
Given this, an additional important finding is that all the winning algorithms performed better when clinical data was added to the genetic data (compare the green line to the blue line above). That is, knowing more about individual patients improved predictive power.***** No one was suggesting genetics would provide the only answer, but it’s fascinating to see that demonstrated so clearly. We also don’t know enough about to what degree randomness plays a role. The timing of onset of diseases like RA has a healthy random component; it wouldn’t be surprising if the same is true for drug response. If randomness is a big enough component of the equation, knowledge and measurements may not ever provide enough power to predict drug response in a clinically meaningful way.
Again, not to say people shouldn’t try. The Sage/DREAM challenge is entering its second phase, where they’re trying to improve on the current winning algorithms. Here they’re doing another interesting twist on crowdsourcing. One of the anecdotal observations about crowdsourcing competitions across multiple fields is that, often, while the crowd as a whole contributes, a few members of the crowd stand out from the rest.
In the second phase which is starting now, the folks running this challenge are inviting specific research groups, including the winners, to work as a kind of “super-team” in classifier development. The Miami Heat (circa 2012-2013) version of bioinformatics if you will. So, in addition to creating algorithms that handily beat what had come before, phase one of the challenge also served as a kind of American Idol to find the groups doing the best work in this field. It’ll be interesting to see if they can improve on the current winners.
I’ll just mention briefly another caveat: I would not be surprised if these algorithms, trained on a Caucasian population, show even more limited forecasting ability when applied to patients from other ethnic groups.
So where we’re at now is, this has been a terrific improvement on previous work, and there’s still a lot more to be done. I suspect that, as with baseball research, the search will continue for different kinds of measurements (Food intake? Microbiome? Recent infections?) that can add additional forecasting power to algorithms. Possibly historical patterns of different drug regimens and individual patient response might be incorporated in a predictive way, although the data is currently probably not granular enough. I’m a proponent of the Quantified Self (QS) approach, and it may be that patients’ groups will take it upon themselves to begin collecting granular, QS data that can eventually be incorporated into forecasting tools.
There’s that saying, “everybody is a special snowflake.” What the success of PECOTA-like approaches to forecasting drug response may be telling us is that there’s also a lot of value in figuring out which snowflakes are most alike.
*PECOTA stands for Player Empirical Comparison and Optimization Test Algorithm. I work for an industry (Biopharma) that just looooves its algorithms. Clearly we, the military and the government are not the only ones.
**DREAM stands for Dialogue on Reverse Engineering Assessment and Methods. This group began organizing crowdsourcing competitions using large-scale datasets in 2006. Their hope is to leverage (friendly) competition across research groups to make faster progress in translating large datasets into biological insights.
***And it’s often a she, RA affects far more women than men. About 3:1.
****The dataset consisted of single nucleotide polymorphism (SNP) information across the genome for each of >2000 patients. This means for each patient, the specific nucleotide at more than a million places in the genome was measured. Patient clinical data was also included.
*****One of the nice things about building algorithms is it’s one way to overcome the paradox of choice problem with decision making. More data is handled via an algorithm rather than by the human brain, removing some of the subjectivity from the decision on whether to treat a patient or not.

