Automate the Strike Zone, Unleash the Offense

Hello World! As a software developer, automation is my way of life. It kills me to see the tedious yet important job of calling balls and strikes performed at less than 90% accuracy. Worse, catcher framing is now a thing, which is essentially baseball’s equivalent of selling the flop.

Today, I want to talk about how automating the strike zone would affect the MLB run-scoring environment. Don’t we all want to save the environment?

Let’s pretend that before the 2014 season, home plate umpires were fitted with earpieces giving them a simplified Pitch f(x) feed of balls and strikes. They heard a high beep for a strike, a low beep for a ball. They then called balls/strikes exactly as they were told, resulting in a perfect zone.

Experiment 1: Walks/Strikeouts overturned

The most damaging ball/strike errors happen when ball 4 or strike 3 was thrown but not called. Sometimes the umpire is redeemed by luck, and a walk/strikeout happens eventually anyway, but not nearly every time. Think of how many times you’ve seen a 3–0 count where a ball was called a strike, only to have the hitter swing and ground out harmlessly on the 3–1 pitch.

For these experiments, let’s look at short description of the situation, the number of instances of that situation in 2014, and net runs that would have been added if a perfect zone had been called.

Data courtesy of Baseball Savant; click on a situation to see the query I used.

Situation Instances Net Runs (Rough)
Strike 3 thrown, batter safe 146 -88
Ball 4 thrown, eventual out 691 415
Difference 545 327 (.07 team runs per game)

Are you surprised? The umpires made 545 more extra outs than extra ‘safes’. Using a rough walk minus out run differential of 0.6 runs, we see that a perfect zone would have added 0.07 runs per game. Interesting, but not huge.

But think again—this effect isn’t limited to plate appearances that should have ended with a bad call. We all know that the count affects the expected run value all on its own. So let’s expand this to all ‘bad calls’ in 2014.

Experiment 2: All balls/strikes called correctly

Balls and strikes don’t obviously translate to runs. So I’ll use someone else’s much more careful research and use a ball minus strike run value of approximately 0.14 runs. Here’s what happens when we apply a perfect zone to all balls and strikes. Brace yourself!

Situation Instances Net Runs (Rough)
Strike thrown, ball called 8724 -1212
Ball thrown, strike called 40557 5633
Difference 31833 4422 (.91 runs per game per team)

Whoa. Are you kidding me? If we’d run last season with a perfect strike zone, the run environment would go from 4.07 runs/game to nearly 5! That’s the highest level since 2000. I know what you’re thinking: this is crazy, and probably wrong.

Sanity checking

I also found this result to be larger than expected, to say the least. So let’s back up, check the mirrors, and look at the frequency of called strikes vs. balls.

Called Ball 233421
Called Strike 123922
Difference 109499

There are a ton more called balls than called strikes. This makes sense because batters are more likely to swing at strikes. But the ratio of balls to strikes is only about 2:1, that doesn’t account for the 5:1 ratio among ‘mistaken’ balls/strikes! How do we account for this?

A possible explanation

Here we dive into speculation, but stay with me for a minute. Maybe there’s a logical explanation.

What sequence of events must occur in order for a Pitch f(x) strike to become a ball?

  1. Pitcher throws in strike zone: ~45% (Zone %)
  2. Hitter takes said pitch in the strike zone: ~35% (100% – Z-Swing %)
  3. Umpire makes bad ‘ball’ call: ~10%

By this ridiculously rough method, we would expect bad ‘ball’ calls about 1.5% of the time (0.10 * 0.35 * 0.45). Compare that with the observed value of 1.2%

Conversely, the sequence for a Pitch f(x) ball becoming a called strike is as follows:

  1. Pitcher throws out of zone: ~55% (100% – Zone %)
  2. Hitter takes said pitch outside the strike zone: 70% (100% – O-Swing %)
  3. Umpire makes bad ‘strike’ call ~15%

We therefore expect bad ‘strike’ calls about 5.7% of the time (0.15 * 0.7 * 0.55). Again, compare that to the observed value of, wait for it, 5.7%. Boom!

More reasons to automate

  1. Automatic things happen faster. As a professional automator, I guarantee this will speed up play, by more than you think. I bet the umpire thinks for about 1 second on every pitch. That’s just the obvious part.
  2. Set the umpires free. Focusing on something as difficult as calling balls/strikes squeezes out the umpire’s attention on other important matters, such as enforcing pace of play.
  3. Crazy cool things will happen. For example, we will finally see what happens to an insane control pitcher’s K-BB%. V-Mart might never strike out!

I welcome your comments, criticisms, or even praise 🙂


Changes in WAR from 2000 to 2014 (Part 4)

If you haven’t read Part 1, Part 2, and Part 3, you may want to go back and check them out.

After looking in-depth at 2014 WAR, I thought it would be interesting to compare 2014 WAR with WAR totals from 2002. Baseball scoring has dropped considerably since 2002 and I wondered how this would be reflected in WAR, either at the positional level or the age level or both.

Here is a comparison of hitting statistics from 2002 and 2014:

YEAR R/G AVG OBP SLG wOBA ISO BABIP BB% K%
2002 4.62 .261 .331 .417 .326 .155 .293 8.7% 16.8%
2014 4.07 .251 .314 .386 .310 .135 .299 7.6% 20.4%

Twelve years ago, hitters put up a higher batting averages, on-base percentages, slugging percentages, and isolated slugging. They walked more and struck out less.

But,we pretty much knew this. Did this difference in the level of offense affect the WAR accumulated at each position?

Position Players

The following table shows WAR for each position with 2002 on top and 2014 below.

If we look at the comparison of WAR/600 PA for the premium hitting positions (DH, 1B, RF, LF, 3B), we see that all except third base accumulated more WAR in 2002 than in 2014. On the other end of the fielding spectrum, the key defensive positions (C, SS, 2B, CF) all had more WAR in 2014, when offense was down.

This table shows a comparison of the traditionally offense-oriented positions versus the positions historically known more for their glove work in the two different run-scoring environments of 2002 (4.62 R/G) and 2014 (4.07 R/G).

In 2002, the offense-oriented positions averaged 2.2 WAR/600PA. In 2014, these positions average 1.8 WAR/600 PA. The more defensive-oriented positions averaged 1.9 WAR/600 PA in the higher run-scoring environment and 2.4 WAR/600 PA when runs were more scarce.

This shift of WAR from more hitter-heavy positions to the better fielding positions has been a general trend over the last thirteen years, particularly so in the last four years as run scoring has dropped significantly.

Consider the table below. The column to the far right shows the difference between WAR for the hitting positions and fielding positions each year:

The biggest change has been over the last four years, as run scoring has dropped down below 4.3 runs per game after being in the range of 4.6 to 4.8 runs/game in the 2000s. Teams are getting more WAR/600 PA from the defensive-oriented positions than the bat-first positions. The 2014 season saw the biggest gap in the last thirteen years, with glove-first positions averaging 0.6 more WAR/600 PA than the bat-first positions.

Changing distribution of playing time and WAR based on age

Along with the change in WAR for the hitting positions versus the defense-oriented positions, there has been a shift in WAR and playing time based on age. From 2000 to 2005, position players 33 and older had more plate appearances than players 25 and under. Beginning in 2006, position players 25 and under have had more plate appearances each year than players 33 and older. Since 2010, this difference has accelerated, as the graph below shows:

In 2000, players 33 and older had 40,626 plate appearances and players 25 and under had 38,919. Last year, players 33 and older had dropped to 29,191 plate appearances and players 25 and under were up to 45,439 plate appearances.

Plate Appearances by Age Group
Year 25 & under 33 & older
2000 38,919 40,626
2014 45,439 29,191
Difference 6,520 -11,435

With increasing playing time, players 25 and under have seen their total WAR go up, while WAR for players 33 and older has gone down:

The difference in WAR is not just a playing time difference, though. Older players have not only seen less playing time, they’ve also been less productive, as this graph of WAR/600 PA demonstrates:

In 2000, players 33 and older averaged 1.7 WAR/600 PA, while players 25 and under averaged 1.4 WAR/600 PA. The older group of players maintained their lead until 2003, when the two groups were essentially even. Since then, younger players have out-produced older players. Last year, the gap was 0.5 WAR/600 PA in favor of the younger group of players.

Starting Pitchers

For starting pitchers, there are some differences. Innings pitched by starting pitchers 25 and under have fluctuated quite a bit over the last 15 years. Since 2000, starting pitchers age 25 and under have thrown a high of 10,268 innings (2002) and a low of 6,663 innings (2005). Starting pitchers 33 and older have a narrower range of innings pitched per season, with a very slightly downward trend over the last thirteen years, as shown by this graph:

While their innings pitched has been fairly consistent since 2000, starting pitchers 33 and older have been less productive. The following graph shows the WAR/150 innings pitched for starting pitchers 25 and under compared to those 33 and older. The “33 and older” group has dropped from a high of 2.5 WAR/150 IP in 2000 to a low of 1.2 WAR/150 IP last season.

From 2000 to 2007, pitchers 33 and older were more productive per inning than pitchers 25 and under. Since then, young pitchers have been more productive, except for that 2012 season. The gulf has widened between these two groups over the last two years.

Relief Pitchers

Finally, let’s look at relief pitchers. Since 2000, relief pitchers 33 and older have seen their innings pitch per year rise from around 3,000 in 2000 to a high of 3,951 in 2005, but have steadily dropped since then. In 2014, they pitched a 15-year low of 2,063 innings. Relief pitchers 25 and under saw a sharp increase in innings pitched from 2004 to 2006, and have bounced around a bit since then, but have generally seen a drop in the amount of innings they’ve pitched since then.

When it comes to production, older relief pitchers have followed a different pattern than their counterparts. Position players and starting pitchers 33 and older have seen their production drop (using WAR per playing time), while relief pitchers 33 and over have held steady. Older relievers are pitching fewer innings each year but they are still as productive (and have a slight increase in WAR/50 IP over the last 15 years).

Final Thoughts

Baseball has evolved over the last 15 years from a high-offense, slugging game to a low-offense, pitching-and-defense game and WAR reflects those changes. The offense-oriented positions (1B, RF, LF, 3B) used to accumulate more WAR each season, but no longer do so. Older players were once more likely to sustain their production into their mid-30s, but no longer play as much or as well as they once did at an advanced age.

Looking to the future, we have to wonder what’s to come. Will offense continue to drop or has it bottomed-out and now due for a rebound? Will MLB do something to raise the level offense (adjust the strike zone, perhaps?)? If offense makes a comeback, how will that be reflected by WAR?


The Grandyman (Still) Can

For every Dontrelle Willis–who continues to get looks from Major League teams despite over eight years of complete ineptitude–there exists a handful of other players who fade into relative obscurity only a year or two removed from a dominant season. All it generally takes is a down year resulting from–or paired with–an injury to send a guy spiraling below the radar. These are often the players that can return the most value during fantasy drafts if you can make the distinction between a year that’s an aberration, and one that is a bellwether for a significant, irreversible decline in skills.

While I can’t say with complete confidence that Curtis Granderson’s 2014 doesn’t fall into the latter category, there were a couple of encouraging things going on below the subpar surface stats that make me think he can return some solid value this year, especially considering where he’s going in most drafts.

Granderson was 33 last year and coming off an injury-shortened season. He was also trading a left-handed pull hitter’s haven in Yankee Stadium for the cavernous confines of Citi Field. All things considered, it was natural to expect some significant regression. And when he hit .136 through his first 100 at-bats of the season, it seemed like the Mets might have had a disaster of Jason Bay-like proportions on their hands.

Fortunately for them, Granderson managed to right the ship to an extent, putting together a couple of excellent months. His final line of .227/.326/.388–dragged further down by a nightmarish .037 ISO, 16-for-109 August–wasn’t spectacular by any stretch. But there were some nice takeaways buried in there.

For one, his bat speed doesn’t seem to have slowed enough to justify the statistical hits he took across the board. Despite seeing 56.3% fastballs–the most he’s seen since 2010 by a wide margin–his Z-Contact % of 85% was in line with his 85.8% career average, and not far removed from the league average of 87%. I suspect the uptick in fastballs resulted from opposing teams banking on an age-slowed swing, but Granderson’s contact rates on high velocity pitches in the zone didn’t suffer for it.

Granderson also set a career high in O-Contact % with a 62.7% rate. This could usually indicate a lack of plate discipline as much as it could a sustained bat speed, except that Granderson’s O-Swing % of 26.2% is roughly the average of what he did in the four years prior. He also managed to post the second-highest walk rate of his career (12.1%) and his lowest strikeout percentage since 2009 (21.6%). These are not particularly impressive rates in their own right, but in the context of Granderson’s career they do help to dispel the notion that last year was the beginning of the end for his hitting ability.

That is not to say, of course, that I foresee a return to the 40 home run, .260+ ISO form that he flashed in his early Yankee years–there’s no way he ever touches the absurd 22 HR/FB% that sustained that run. But with the right field fences at Citi Field moving in–a change that apparently would have resulted in 9 more home runs for Granderson had it been done last season–and some improvement on last year’s uncharacteristically bad .265 BABIP, I would not be at all surprised to see a home run total between 25 and 30 to go along with double-digit steals and a batting average that won’t kill you. And that has value when it is being drafted as low as Granderson currently is.


A Historical Study of the Strike Zone and the Offensive Environment

As offense is continuously decreasing, a popular suggestion to increase the offense has been the shrinking of the strike zone. Primarily discouraging the low strike — since the implementation of QuesTec and later Zone Evaluation, the low strike is being called more and more often. All it really is is the enforcement of the strike zone or the rule of the strike zone. The solution that many have proposed is to reduce the low strike, which would require a changing in the wording of the strike zone. This in theory would increase the offense, which would increase the popularity of the game.

This may be a surprise to some but the re-wording of the strike zone is a common occurrence throughout the history of the game. Ok, maybe not common but it does happen on occasion. The first implementation of a strike zone was in 1887. Before 1887 batters would ask where they wanted the ball delivered and pitchers had to throw it there. There was no official definition of the strike zone.

The main question I tried to answer was how did the re-wording of the strike zone affect the run environment, if at all? There is no guarantee that it has, or that there is a correlation between the change in strike zone rules and the run environment. I think it’s a good theory and I would tend to believe that it would affect the run environment; that being said there are many factors that go into the run environment, and the strike zone is merely one of them.

The first chart is a representation of the run environment leading up to 1887, when the strike zone was officially defined. The definitions of the strike zone were found on Baseball Almanac. The data for all the charts was provided by baseball-reference. The X-axis for all the upcoming charts is the year and the Y-axis is the average runs per game.

m1

Take this data for what you will. I personally don’t think it truly reveals a ton about the strike zone’s effect but it is a data point.

“A (strike) is defined as a pitch that ‘passes over home plate not lower than the batsman’s knee, nor higher than his shoulders.”

m2

After 1887 there was a relatively steep drop in the run environment before it went back up. I’m not entirely sure the data reveals anything; the chart is rather noisy. In this chart, probably other factors were conducive to the fluctuation in run environment.

“A fairly delivered ball is a ball pitched or thrown to the bat by the pitcher while standing in his position and facing the batsman that passes over any portion of the home base, before touching the ground, not lower than the batsman’s knee, nor higher than his shoulder. For every such fairly delivered ball, the umpire shall call one strike.”

m3

This chart again isn’t precisely indicative that the change in strike zone had an impact on the run environment. The modern game was still in its infancy and there was a lot of fluctuation before things stabilized in the mid 1900s.

“The Strike Zone is that space over home plate which is between the batter’s armpits and the top of his knees when he assumes his natural stance”.

m4

This data point gives us more information. There was a pretty drastic drop from 1950-1952 in offense. In fact it was almost an entire run of offense that dropped and it makes sense. This was the first time there was a concrete definition of the strike zone. The umpires now had something to go on. Before there was a general idea of what strike and ball was. This was the first acknowledgment that there was a concrete zone pitchers had to throw into. The run environment did stabilize though until1963, where there was a slight drop in offense, obviously unrelated to the strike zone.

“The Strike Zone is that space over home plate which is between the top of the batter’s shoulders and his knees when he assumes his natural stance. The umpire shall determine the Strike Zone according to the batter’s usual stance when he swings at a pitch.” This rule was implemented in 1963.

22222

As you can see there is no real change or effect from the rule change or the re-working of the rule. What you will also be able to conclude from the upcoming charts is that the re-wording of the strike zone doesn’t exactly have any effect on the offensive environment.

The strike zone was then again altered in 1969; “The Strike Zone is that space over home plate which is between the batter’s armpits and the top of his knees when he assumes a natural stance. The umpire shall determine the Strike Zone according to the batter’s usual stance when he swings at a pitch.”

iiiiiii

“The Strike Zone is that area over home plate the upper limit of which is a horizontal line at the midpoint between the top of the shoulders and the top of the uniform pants, and the lower level is a line at the top of the knees. The Strike Zone shall be determined from the batter’s stance as the batter is prepared to swing at a pitched ball”

312

“The Strike Zone is expanded on the lower end, moving from the top of the knees to the bottom of the knees (bottom has been identified as the hollow beneath the kneecap).”

ppppp

The offense as you can see does take a rather significant and consistent dip after 1996. This, however, is probably not due to the re-working of the strike zone or rather one cannot tell that it is due to the re-working of the strike zone from this chart.

There is, as we all know, another element to this strike zone saga and it’s the implementation of QuesTec. QuesTec was implemented in 2002 and was not well received by umpires. They actually filed a grievance in 2003, about the use of QuesTec, which was resolved in 2004.

55555

The evidence displayed by the data above doesn’t suggest that QuesTec had a direct link to offensive production. What it rather indicates is there was a drastic shift in offensive production after 2006. 2006 was the year where Zone Evaluation was implemented in baseball. Zone Evaluation was deemed to be a more accurate way of judging the strike zone. Its implementation also has a direct correlation with a constant decrease in offense, which has not ended. The goal was to force umpires to be more accurate and to adhere to the definition of the strike zone, which was last altered in 1996. In 1996 the definition explicitly dictated that the strike zone should expand downward from the top of the knees to the bottom of the knees. This seems to perhaps be the biggest impact against offense.

There are obviously other extreme factors to consider. For example, the aggressive testing of steroids and other performance-enhancing drugs. It seems most of us including myself like to believe that we are playing in a much cleaner game, which has affected the offense as a whole. Pitchers are throwing harder than ever and if that wasn’t enough most advanced metrics seem to favor pitching and defense. These are all elements to consider that have affected the offense.

That being said there is an undeniable connection between the enforcement of the strike zone and the drastic drop in offense. In previous years, when the strike zone was re-worked, there were no real correlations with regards to offense, apart from 1950, where the strike zone was initially defined. The correlation is rather with technology and the strike zone. It’s highly probable that the umpires in years past ignored or disregarded the changes with the rule. They just kept calling the strike zone, like they always did. The implementation of Zone Evaluation forced them to change, which had a direct effect on the offense. Changing the strike zone should have a rather drastic affect on offense, especially now that we have Zone Evaluation to keep umpires accountable.


Hardball Retrospective – The “Originals” 1922 Browns

In “Hardball Retrospective: Evaluating Scouting and Development Outcomes for the Modern-Era Franchises”, I placed every ballplayer in the modern era (from 1901-present) on their original team. Consequently, Joe L. Morgan is listed on the Colt .45’s / Astros roster for the duration of his career while the Angels claim Wally Joyner and the Diamondbacks declare Carlos Gonzalez. I calculated revised standings for every season based entirely on the performance of each team’s “original” players. I discuss every team’s “original” players and seasons at length along with organizational performance with respect to the Amateur Draft (or First-Year Player Draft), amateur free agent signings and other methods of player acquisition.  Season standings, WAR and Win Shares totals for the “original” teams are compared against the “actual” team results to assess each franchise’s scouting, development and general management skills.

Expanding on my research for the book, the following series of articles will reveal the finest single-season rosters for every Major League organization based on overall rankings in OWAR and OWS along with the general managers and scouting directors that constructed the teams. “Hardball Retrospective” is available in digital format on Amazon, Barnes and Noble, GooglePlay, iTunes and KoboBooks. Additional information and a discussion forum are available at TuataraSoftware.com.

Terminology 

OWAR – Wins Above Replacement for players on “original” teams

OWS – Win Shares for players on “original” teams

OPW% – Pythagorean Won-Loss record for the “original” teams

Assessment 

The 1922 St. Louis Browns                        OWAR: 45.8     OWS: 247     OPW%: .532 

“Gorgeous” George Sisler carried a .351 lifetime batting average into the 1922 campaign along with the Major League record for hits in a single-season (257 in 1920). He ravaged rival hurlers and topped the leader boards with 246 base knocks, 134 runs, 18 triples and a career-high 51 swipes to complement a .420 BA. Sisler claimed the MVP award but later fell ill and missed the entire 1923 season due to acute sinusitis.

Marty McManus established personal-bests with 189 safeties and 109 RBI while batting .312 with 34 doubles, 11 triples and 11 round-trippers. Del Pratt pounded a career-high 44 two-baggers and knocked in 86 runs. Pat Collins (.307/8/23) split the catching chores with Verne Clemons and Muddy Ruel. 

Sisler ranked 24th among first sackers in “The New Bill James Historical Baseball Abstract.” Pratt (35th) and McManus (58th) placed in the top 100 at the keystone position while Ruel finished fifty-first among backstops.

LINEUP POS WAR WS
George Maisel RF/CF -0.89 0.49
Del Pratt 2B 1.74 17.78
George Sisler 1B 7.36 29.39
Marty McManus DH/2B 1.74 20.29
Muddy Ruel C 0.37 9.29
Cedric Durst CF -0.01 0.2
Burt Shotton LF -0.22 0.01
Gene Robertson 3B 0.08 0.83
Doc Lavan SS -0.5 2.97
BENCH POS WAR WS
Pat Collins C 0.97 6.36
Verne Clemons C 0.04 4.24
Ray Schmandt 1B -1.55 5.8

Missouri native Elam Vangilder (19-13, 3.42) delivered career-bests in victories and WHIP (1.208). Jeff Pfeffer (19-12, 3.58) matched Vanglider’s win total and paced the mound crew with 261.1 innings pitched and 32 starts. Wayne “Rasty” Wright held the opposition at bay with a 2.92 ERA and a WHIP of 1.286. Ray “Jockey” Kolp compiled a record of 14-4 while left-hander Earl Hamilton contributed an 11-7 mark. In his rookie season Hub “Shucks” Pruett fashioned an ERA of 2.33, saved 7 contests and topped the League with 23 games finished.

ROTATION POS WAR WS
Elam Vangilder SP 5.26 21.14
Jeff Pfeffer SP 3.96 20.15
Rasty Wright SP 2.72 12.53
Ray Kolp SP 1.74 10.86
Earl Hamilton SP 1.2 10.62
BULLPEN POS WAR WS
Hub Pruett SW 2.07 11.42
Bill Bayne SP 0.51 4.29
Dutch Henry RP -0.04 0.1
Heinie Meine RP -0.08 0.06
Bill Bailey RP -0.33 0.62
Allan Sothoron SP -0.43 0.44
Tom Phillips SP -0.58 1.52

The “Original” 1922 St. Louis Browns roster

NAME POS WAR WS
George Sisler 1B 7.36 29.39
Elam Vangilder SP 5.26 21.14
Jeff Pfeffer SP 3.96 20.15
Rasty Wright SP 2.72 12.53
Hub Pruett SW 2.07 11.42
Del Pratt 2B 1.74 17.78
Marty McManus 2B 1.74 20.29
Ray Kolp SP 1.74 10.86
Earl Hamilton SP 1.2 10.62
Pat Collins C 0.97 6.36
Bill Bayne SP 0.51 4.29
Muddy Ruel C 0.37 9.29
Gene Robertson 3B 0.08 0.83
Verne Clemons C 0.04 4.24
Cedric Durst CF -0.01 0.2
Dutch Henry RP -0.04 0.1
Heinie Meine RP -0.08 0.06
Burt Shotton LF -0.22 0.01
Bill Bailey RP -0.33 0.62
Allan Sothoron SP -0.43 0.44
Doc Lavan SS -0.5 2.97
Tom Phillips SP -0.58 1.52
George Maisel CF -0.89 0.49
Ray Schmandt 1B -1.55 5.8

Honorable Mention

The “Original” 1916 Browns                         OWAR: 41.4     OWS: 266     OPW%: .550

Jeff Pfeffer (25-11, 1.92) logged 328.2 innings pitched while establishing personal-bests in virtually every major pitching category. Carl Weilman completed 19 of 31 starts and recorded an ERA of 2.15 along with a 1.134 WHIP. Burt Shotton coaxed 110 bases on balls, pilfered 41 bags and tallied 97 runs.

The “Original” 1983 Orioles                          OWAR: 42.6     OWS: 255     OPW%: .604

Cal Ripken (.318/27/102) led the Junior Circuit with 211 base hits, 121 runs scored and 47 doubles. He appeared in his first All-Star contest and achieved MVP honors along with the Silver Slugger Award. “Steady” Eddie Murray (.306/33/111) registered 115 tallies and placed runner-up to Ripken in the AL MVP balloting. Mike Boddicker accrued 16 victories with a 2.77 ERA in his inaugural campaign.

On Deck

The “Original” 1980 Royals

References and Resources

Baseball America – Executive Database

Baseball-Reference

James, Bill. The New Bill James Historical Baseball Abstract. New York, NY.: The Free Press, 2001. Print.

James, Bill, with Jim Henzler. Win Shares. Morton Grove, Ill.: STATS, 2002. Print.

Retrosheet – Transactions Database – Transaction a – Executive

Seamheads – Baseball Gauge

Sean Lahman Baseball Archive

Shatzkin, Mike. The Ballplayers. New York, NY. William Morrow and Co., 1990. Print.


Rickie Weeks’ Value in Disguise

Rickie Weeks going to the Mariners moved a lot of eyebrows, raising some, furrowing others. Weeks’s deal will be worth $2 million for one year, according to Jim Bowden. To the casual fan, this move might seem a little unnecessary: Seattle already has a pretty good second baseman in Robinson Cano. If you take a closer look, however, there are some hidden metrics that would point to Weeks having a resurgence.

Let’s first look at this acquisition from the position of the casual fan. Weeks is coming off a 2014 season wherein he only had 286 plate appearances, and saw a substantial reduction in power. Long story short, Weeks was a singles hitter last year. In those 286 trips to the plate, Weeks had 41 singles. In 2013, Weeks had 42 singles in 113 more plate appearances. While this helped his overall batting average get back on track, from .209 in 2013 to .274 in 2014, it did nothing to increase his power numbers.

Weeks is also a below-average fielder. Scratch that, Weeks is the worst fielder at the second base position in all of baseball, and he has been for some time now. If we are going by FanGraphs’s UZR, Weeks has a career total UZR of -56.5 for his career. That puts Weeks right at the bottom as far as second baseman who have played more than 5,000 innings since 2005 (Week’s first full season). Below are the bottom five second baseman according to UZR in that same time frame. Recognize anyone?

Notice that current Seattle second baseman Robinson Cano is four from the bottom. This really doesn’t tell us anymore than that Seattle does not put a premium on defense, and we might have suspected this all along if we had first taken a look at team UZR from the last two seasons.

There we have it. A match made in heaven. It is no coincidence that two of the bottom five defensive teams over the last two years contained two of the bottom five defensive second basemen, in Cano and Weeks. So what does this all have to do with Seattle and their recent free-agent acquisition of Mr. Weeks?

Ceteris paribus. All other things being equal, meaning if we take defense out of the evaluation (because Seattle is not focusing on defense at the time), we can better understand what Seattle saw in this now 32-year-old utility man.

Our answers lie within the batted ball statistics. Over his career, Weeks has had a fly ball percentage of 35-36% consistently. Even in 2013 it was 32.7%. Last season that percentage sunk dramatically to a career low of 25%. This may or may not be a bad sign. We will come back to the fly ball percentage shortly. Now let us look at the HR/FB ratio statistic.

Last season Weeks saw a spike in his HR/FB ratio. It reached an all time high of 17.8%.  His career average for that metric is 14%. Knowing that his fly-ball percentage was at an all time low, with his HR/FB ratio at an all time high we can reasonably expect those two metrics to meet somewhere in the middle this upcoming season.

There is one last measurement we should look at in order to fully understand Weeks’s value possibility. Jeff Zimmerman and Bill Petti, of FanGraphs fame, run their own website, baseballheatmaps.com, where one can look at batted-ball distance for any player going back to 2007. When we look at Rickie Weeks, we see that he has a career average fly-ball distance of 292 feet. Last year, his average fly-ball distance was 285 feet. This slight decline is understandable due to the age factor. Weight this how you wish, but it doesn’t seem like Weeks is going through any more of a power decline than other professionals have gone through at his age.


Putting it all together, if Weeks starts to hit more fly balls, and (if nothing else) maintains his career average HR/FB ratio, the Mariners will reap the full value of his services. His defense is subpar at best, but Seattle does not seem too concerned about that. Right-handed power seems to be scarce at the moment, especially at the second base position. Rickie will add depth to Seattle, but the real value might come during the season when teams start looking for power to boost their playoff lineups—that is, if Weeks can deliver.


2014 WAR Breakdown by Age and Position (WAR, Part 3)

If you haven’t read Part 1 and Part 2, you may want to go back and check them out. If you would prefer not to, this is a reminder of where these numbers came from:

Using FanGraphs’ terrific leaderboard tools, I found statistics for all players who played at each position in 2014. The following numbers apply only to the time spent at that position. Buster Posey, for example, accumulated 462 plate appearances at catcher, 128 at first base, and 9 at DH, so his plate appearances in those amounts are included for those positions in the table below.

For position players, I calculated WAR per 600 plate appearances. For starting pitchers, I used WAR per 150 innings pitched. For relievers, I used WAR per 50 innings pitched.

In this installment of 2014 WAR Breakdown, players at each hitting position are split into six different age groups. All “small sample size” warnings apply.

CATCHER

CATCHER N PA% PA WAR% WAR%dff WAR WAR/600 PA AVG OBP SLG
<23 8 5.4% 1040 3.2% -2.1% 2.6 1.5 .227 .275 .354
24 to 26 27 24.9% 4829 23.1% -1.8% 18.6 2.3 .246 .301 .391
27 to 29 24 27.5% 5331 34.7% 7.2% 27.9 3.1 .252 .321 .403
30 to 32 26 29.2% 5666 36.8% 7.6% 29.6 3.1 .253 .319 .385
33 to 35 13 8.5% 1655 3.7% -4.8% 3.0 1.1 .220 .310 .307
36 and up 4 4.5% 870 -1.6% -6.1% -1.3 -0.9 .218 .263 .300
C 102 19391     80.4 2.5 .245 .309 .380


The most productive age groups for catchers were the “27 to 29” and “30 to 32” age groups, with both groups averaging 3.1 WAR/600 PA. Not surprisingly, the production by catchers really starts to dwindle as they move into their mid-30’s. The “30 to 32” age group hit a combined .253/.319/.385, while the “33 to 35” age group hit just .220/.310/.307. Russell Martin will be 32 next year and just signed a 5-year, $82 million contract with the Blue Jays. Here’s hoping he ages better than most catchers, for the Blue Jays’ sake.

Best Catcher 23 and under: Mike Zunino, 23 (1.7 WAR)

Best Catcher 24 to 26: Devin Mesoraco, 26 (4.1 WAR)

Best Catcher 27 to 29: Jonathan Lucroy, 28 (6.3 WAR)

Best Catcher 30 to 32: Russell Martin, 31 (5.4 WAR)

Best Catcher 33 to 35: Carlos Ruiz, 35 (3.2 WAR)

Best Catcher 36 and up: David Ross, 37 (0.2 WAR)


FIRST BASE

FIRST BASE N PA% PA WAR% WAR%dff WAR WAR/600 PA AVG OBP SLG
<23 5 2.2% 446 -3.4% -5.5% -1.7 -2.3 .177 .276 .347
24 to 26 41 22.2% 4552 34.0% 11.8% 17.2 2.3 .270 .340 .449
27 to 29 57 25.0% 5143 27.3% 2.2% 13.8 1.6 .247 .328 .429
30 to 32 40 28.7% 5906 36.6% 7.8% 18.5 1.9 .263 .336 .424
33 to 35 20 19.6% 4028 9.3% -10.3% 4.7 0.7 .253 .329 .421
36 and up 8 2.3% 473 -3.8% -6.1% -1.9 -2.4 .199 .281 .299
1B 171 20548     50.6 1.5 .255 .331 .426


In 2014, first baseman aged 24 to 26 were the most productive group at the position, averaging 2.3 WAR/600 PA. The “30 to 32” group was next, at 1.9 WAR/600 PA, with the group in the middle (“27 to 29”) finishing third in this metric. The small sample sizes of young (23 and under) and old (36 and older) were quite unproductive, both averaging negative WAR per 600 PA and hitting under .200.

Best First Baseman 23 and under: Will Myers, 23 (0.0 WAR in just 3 PA)

Best First Baseman 24 to 26: Anthony Rizzo, 24 (5.6 WAR)

Best First Baseman 27 to 29: Jose Abreu, 27 (4.4 WAR)

Best First Baseman 30 to 32: Miguel Cabrera, 31 (4.9 WAR)

Best First Baseman 33 to 35: Justin Morneau, 33 (2.5 WAR)

Best First Baseman 36 and up: Raul Ibanez, 42 (0.3 WAR in 20 PA)


SECOND BASE

SECOND BASE N PA% PA WAR% WAR%dff WAR WAR/600 PA AVG OBP SLG
<23 21 12.0% 2450 9.8% -2.2% 6.5 1.6 .246 .289 .371
24 to 26 43 24.4% 5000 21.1% -3.4% 14.0 1.7 .270 .321 .377
27 to 29 44 25.3% 5173 26.8% 1.5% 17.8 2.1 .244 .312 .375
30 to 32 26 23.5% 4802 30.1% 6.6% 20.0 2.5 .270 .321 .386
33 to 35 14 11.1% 2281 12.5% 1.3% 8.3 2.2 .251 .314 .356
36 and up 8 3.7% 764 -0.2% -3.9% -0.1 -0.1 .219 .285 .307
2B 156 20470     66.5 1.9 .256 .313 .373


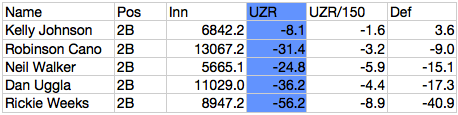
The most productive group of second basemen skewed older than you might expect. The group aged 30 to 32 had the highest WAR/600 PA and best hitting line. Overall, the three age groups ranging from age 27 to age 35 were the most productive.

Best Second Baseman 23 and under: Kolten Wong, 23 (1.8 WAR)

Best Second Baseman 24 to 26: Jose Altuve, 24 (5.0 WAR)

Best Second Baseman 27 to 29: Brian Dozier, 27 (4.6 WAR)

Best Second Baseman 30 to 32: Ian Kinsler, 32 (5.5 WAR)

Best Second Baseman 33 to 35: Chase Utley, 35 (4.2 WAR)

Best Second Baseman 36 and up: Brian Roberts, 36 (0.3 WAR)


THIRD BASE

THIRD BASE N PA% PA WAR% WAR%dff WAR WAR/600 PA AVG OBP SLG
<23 15 10.2% 2067 4.4% -5.8% 3.3 1.0 .250 .292 .401
24 to 26 41 28.6% 5806 20.6% -8.0% 15.6 1.6 .250 .304 .392
27 to 29 48 34.7% 7052 38.5% 3.8% 29.2 2.5 .256 .323 .405
30 to 32 26 16.8% 3405 20.7% 3.9% 15.7 2.8 .266 .330 .375
33 to 35 12 6.5% 1320 12.8% 6.3% 9.7 4.4 .307 .358 .431
36 and up 6 3.2% 652 3.0% -0.2% 2.3 2.1 .265 .315 .396
3B 148 20302     75.8 2.2 .259 .318 .397


Production at third base in 2014 skewed older. Third basemen 23 and under and 24 to 26 were the two least productive groups. The “33 to 35” group had the highest WAR/600 PA, but this was due mainly to just two players—Adrian Beltre and Juan Uribe.

Best Third Baseman 23 and under: Nolan Arenado, 23 (3.1 WAR)

Best Third Baseman 24 to 26: Kyle Seager, 26 (5.6 WAR)

Best Third Baseman 27 to 29: Josh Donaldson, 28 (6.5 WAR)

Best Third Baseman 30 to 32: Chase Headley, 30 (4.4 WAR)

Best Third Baseman 33 to 35: Adrian Beltre, 35 (5.7 WAR)

Best Third Baseman 36 and up: Aramis Ramirez, 36 (2.2 WAR)


SHORTSTOP

LEFT FIELDER N PA% PA WAR% WAR%dff WAR WAR/600 PA AVG OBP SLG
<23 20 11.0% 2197 11.5% 0.5% 8.4 2.3 .248 .302 .362
24 to 26 32 28.5% 5696 19.6% -8.9% 14.4 1.5 .254 .305 .353
27 to 29 39 26.3% 5261 28.6% 2.3% 21.0 2.4 .252 .308 .374
30 to 32 19 25.9% 5169 32.5% 6.6% 23.8 2.8 .264 .319 .384
33 to 35 8 4.6% 923 7.1% 2.5% 5.2 3.4 .244 .325 .371
36 and up 6 3.7% 737 0.7% -3.0% 0.5 0.4 .261 .314 .331
SS 124 19983     73.3 2.2 .255 .310 .368


At the shortstop position, the age 24 to 26 group had the largest percentage of playing time of any group, but a lower WAR/600 PA than any group except the “36 and up” group. In the “27 to 29” age group, Troy Tulowitzki had 5.2 of the group’s 21.0 WAR (24.8%) despite getting just 372 of the group’s 5261 plate appearances (7%).

Best Shortstop 23 and under: Jose Ramirez, 21 (2.1 WAR)

Best Shortstop 24 to 26: Starlin Castro, 24 (2.8 WAR)

Best Shortstop 27 to 29: Troy Tulowitzki, 29 (5.2 WAR)

Best Shortstop 30 to 32: Jhonny Peralta, 32 (5.3 WAR)

Best Shortstop 33 to 35: Jimmy Rollins, 35 (3.5 WAR)

Best Shortstop 36 and up: LittleNicky Punto, 36 (0.4 WAR)


LEFT FIELD

LEFT FIELD N PA% PA WAR% WAR%dff WAR WAR/600 PA AVG OBP SLG
<23 16 6.2% 1267 10.9% 4.7% 6.4 3.0 .265 .332 .387
24 to 26 52 27.3% 5588 27.3% 0.0% 16.0 1.7 .263 .320 .428
27 to 29 65 26.8% 5500 26.8% 0.0% 15.7 1.7 .256 .314 .396
30 to 32 44 23.7% 4852 28.7% 5.0% 16.8 2.1 .255 .332 .393
33 to 35 24 14.6% 2997 8.5% -6.1% 5.0 1.0 .254 .328 .396
36 and up 7 1.4% 288 -2.2% -3.6% -1.3 -2.7 .211 .248 .292
LF 208 20492     58.6 1.7 .257 .322 .402


Thanks to Christian Yelich, the most-productive group of left fielders in WAR/600 PA was the group of player’s aged 23 and under. It’s interesting to see the WAR/600 PA drop-off from the “30 to 32” group to the “33 to 35” group. The “33 to 35” group hit nearly as well as the younger group, but they had a couple of particularly bad fielders (Rajai Davis and Matt Holliday) who brought their WAR total down.

Best Left Fielder 23 and under: Christian Yelich, 22 (4.2 WAR)

Best Left Fielder 24 to 26: Justin Upton, 26 (4.1 WAR)

Best Left Fielder 27 to 29: Michael Brantley, 27 (4.5 WAR)

Best Left Fielder 30 to 32: Alex Gordon, 30 (6.6 WAR)

Best Left Fielder 33 to 35: Matt Holliday, 34 (3.8 WAR)

Best Left Fielder 36 and up: Endy Chavez, 36 (0.1 WAR)


CENTER FIELD

CENTER FIELD N PA% PA WAR% WAR%dff WAR WAR/600 PA AVG OBP SLG
<23 21 16.8% 3523 22.8% 6.0% 22.3 3.8 .265 .325 .426
24 to 26 36 21.0% 4395 17.7% -3.2% 17.3 2.4 .266 .316 .365
27 to 29 43 39.3% 8231 41.9% 2.6% 40.9 3.0 .264 .327 .405
30 to 32 25 18.4% 3859 16.3% -2.1% 15.9 2.5 .268 .330 .383
33 to 35 12 4.4% 919 1.5% -2.8% 1.5 1.0 .259 .330 .378
36 and up 3 0.2% 32 -0.3% -0.5% -0.3 -5.6 .167 .192 .167
CF 140 20959     97.6 2.8 .265 .325 .394


Mike Trout had 664 of the 3523 plate appearances (19%) credited to players 23 and under, but 34% of the WAR for this group. With Trout, Billy Hamilton (3.5 WAR) and Marcell Ozuna (3.4 WAR) all in the 23 and under group, this was the most productive collection of players of any of the age groups in WAR/600 PA. Center field is a young person’s position. Just 4.6% of the plate appearances by center fielders went to players 33 and over.

Best Center Fielder 23 and under: Mike Trout, 22 (7.5 WAR)

Best Center Fielder 24 to 26: Juan Lagares, 25 (3.8 WAR)

Best Center Fielder 27 to 29: Andrew McCutchen, 27 (6.8 WAR)

Best Center Left Fielder 30 to 32: Jacoby Ellsbury, 30 (3.9 WAR)

Best Center Fielder 33 to 35: Rajai Davis, 33 (1.0 WAR)

Best Center Fielder 36 and up: Reed Johnson, 37 (0.0 WAR)


RIGHT FIELD

RIGHT FIELD N PA% PA WAR% WAR%dff WAR WAR/600 PA AVG OBP SLG
<23 23 11.6% 2403 7.4% -4.2% 4.7 1.2 .248 .317 .391
24 to 26 50 21.8% 4509 34.2% 12.4% 21.6 2.9 .260 .327 .428
27 to 29 50 18.4% 3802 19.3% 0.9% 12.2 1.9 .261 .315 .410
30 to 32 45 23.2% 4794 14.6% -8.6% 9.2 1.2 .254 .315 .388
33 to 35 22 15.3% 3159 22.0% 6.7% 13.9 2.6 .274 .353 .435
36 and up 10 9.7% 2003 2.4% -7.3% 1.5 0.4 .271 .316 .418
RF 200 20670     63.1 1.8 .261 .324 .411


Players 23 and under had 4.7 WAR as a group in 2014. Yasiel Puig had 3.7 of that total. In the “30 to 32” age group, Hunter Pence (4.7 WAR) had more than half of the total WAR (9.2) for the group.

Best Right Fielder 23 and under: Yasiel Puig, 23 (3.7 WAR)

Best Right Fielder 24 to 26: Giancarlo Stanton, 24 (6.2 WAR)

Best Right Fielder 27 to 29: Mat Kemp, 29 (2.4 WAR)

Best Right Fielder 30 to 32: Hunter Pence, 31 (4.7 WAR)

Best Right Fielder 33 to 35: Jose Bautista, 33 (6.1 WAR)

Best Right Fielder 36 and up: Marlon Byrd, 36 (1.9 WAR)


DESIGNATED HITTER

DH N PA% PA WAR% WAR%dff WAR WAR/600 PA AVG OBP SLG
<23 20 3.2% 326 15.6% 12.3% 1.4 2.6 .287 .347 .461
24 to 26 62 9.1% 927 -15.6% -24.7% -1.4 -0.9 .224 .284 .397
27 to 29 72 24.8% 2510 11.1% -13.7% 1.0 0.2 .248 .307 .412
30 to 32 58 22.7% 2304 -7.8% -30.5% -0.7 -0.2 .237 .311 .381
33 to 35 32 25.1% 2547 91.1% 66.0% 8.2 1.9 .256 .341 .466
36 and up 17 15.0% 1518 5.6% -9.4% 0.5 0.2 .238 .312 .424
DH 261 10132     9.0 0.5 .247 .317 .420


There wasn’t much WAR accumulated by players at the DH position in 2014. It’s hard to produce WAR with no defensive value and a strong positional adjustment.

Best DH 23 and under: Kennys Vargas, 23 (0.7 WAR)

Best DH 24 to 26: Yan Gomes, 26 (1.0 WAR)

Best DH 27 to 29: Chris Carter, 27 (2.2 WAR)

Best DH 30 to 32: Adam Lind, 30 (0.9 WAR)

Best DH 33 to 35: Victor Martinez, 35 (3.9 WAR)

Best DH 36 and up: David Ortiz, 38 (2.7 WAR)


PITCHER (HITTING)

PITCHERS N PA% PA WAR WAR/600 PA AVG OBP SLG
<23 32 9.6% 527 0.9 1.0 .138 .167 .182
24 to 26 109 27.6% 1516 0.2 0.1 .123 .154 .159
27 to 29 78 27.6% 1515 -0.4 -0.2 .121 .157 .151
30 to 32 48 17.3% 950 -1.6 -1.0 .119 .147 .147
33 to 35 26 10.6% 580 -0.5 -0.5 .130 .154 .148
36 and up 15 7.3% 403 -1.2 -1.8 .097 .121 .114
PITCHERS 308 5491 -2.6 -0.3 .122 .153 .152


Ha! Pitchers hitting. That’s funny.

Best Pitcher (hitting) 23 and under: Shelby Miller, 23 (0.5 WAR)

Best Pitcher (hitting) 24 to 26: Madison Bumgarner, 24 (1.2 WAR)

Best Pitcher (hitting) 27 to 29: Travis Wood, 27 (1.0 WAR)

Best Pitcher (hitting) 30 to 32: Zack Greinke, 30 (0.7 WAR)

Best Pitcher (hitting) 33 to 35: Dan Haren, 33 (0.3 WAR)

Best Pitcher (hitting) 36 and up: Bronson Arroyo, 37 (0.1 WAR)


PINCH-HITTER

PH N PA% PA WAR WAR/600 PA AVG OBP SLG
<23 57 4.9% 271 0.9 2.0 .268 .318 .362
24 to 26 157 24.8% 1361 -0.3 -0.1 .216 .280 .325
27 to 29 165 29.1% 1598 1.4 0.5 .214 .292 .333
30 to 32 114 22.1% 1211 1.8 0.9 .212 .302 .336
33 to 35 53 11.3% 620 -1.8 -1.7 .174 .264 .270
36 and up 28 7.7% 422 0.2 0.3 .226 .310 .284
PH 574 5483 2.2 0.2 .213 .291 .322


Pinch-hitters hitting are only slightly less funny than pitchers hitting. Players 23 and under were better pinch-hitters than any other age group.

Best Pinch-Hitter 23 and under: Cory Spangenberg, 23 (0.3 WAR)

Best Pinch-Hitter 24 to 26: Lonnie Chisenhall, 25 (0.4 WAR)

Best Pinch-Hitter 27 to 29: Delmon Young, 28 (0.6 WAR)

Best Pinch-Hitter 30 to 32: John Mayberry, Jr., 30 (0.8 WAR)

Best Pinch-Hitter 33 to 35: Jeff Baker, 33 (0.3 WAR)

Best Pinch-Hitter 36 and up: Lyle Overbay, 37 (0.4 WAR)


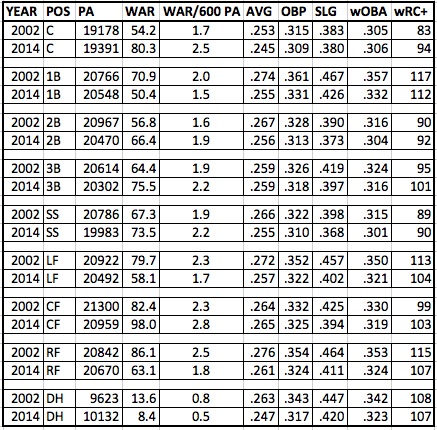
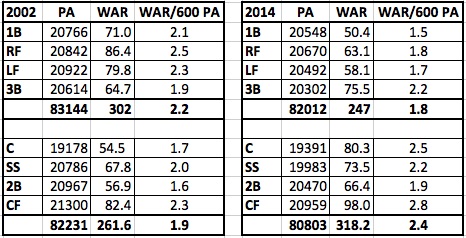
Next up is a comparison of WAR in 2014 to WAR in 2002.


The Method to the Yankees’ Madness

Last week Miles Wray examined an emerging spending pattern of the New York Yankees, suggesting that the club’s approach to free agent spending varies, depending possibly on how many dollars had recently come off their books: They appear to spend each offseason either signing seemingly every premium free agent available (2008-9, 2013-4) or they limit themselves to the bargain bin, focusing on late-offseason signings, reclamation projects, and trades.

While this description is certainly accurate, at least since 2008-9 when this pattern began to emerge, there’s little discussion of why a team would choose to invest in free agency this way.  Presumably, teams like the Yankees, the Dodgers, or the Red Sox, which are capable of fielding significantly higher payrolls than any other team in the league, would prefer to do the opposite: Selecting from a much more limited subset of free agents would limit the advantage gained over other teams.  It’s also not inconceivable that a team with as much money as the Yankees might have concerns that they’d be driving up the entire market, increasing their own cost of acquiring talent.  This approach also has very real impacts on team age and roster flexibility as an entire free agent crop begins to enter their decline years together.

Moreover, the Yankees may very well not be the only team taking this approach.  An argument can be made that the Boston Red Sox are following a similar strategy, albeit at a pace accelerated by their shorter duration contracts they signed in the 2012-3 offseason and their salary-dump trade with the Dodgers four months earlier.  The team signed both Hanley Ramirez and Pablo Sandoval, arguably the two top hitters available in free agency, only a year after they signed precisely one free agent, Mike Napoli, who was their own.

So what does a team gain by going on spending sprees followed by (relative) austerity?  I submit they pursue this approach to gain one thing: draft picks.

Consider for the moment what happens in the case where the Yankees are not following this feast/famine strategy in free agency, and instead they sign a premium free agent each year.  In 2009-10 they might’ve signed Matt Holliday or Jason Bay.  2010-1, Carl Crawford or Jason Werth.  In 2011-2, Fielder/Pujols/Reyes.  In 2012-3 Upton/Hamilton/Bourne/Grienke.  All were free agents tied to compensation, meaning in addition to the dollar-cost of signing that player, the signing team also forfeited a draft pick.  (It’s probably also worth noting how godawful most of those signings look today, but that’s the nature of free agency – The last couple of years are almost always ugly.)  The mechanics of where those picks go have changed since the 2012-3 offseason but the cost to the signing team remains the same: A first round draft pick, or a later round pick if the first round pick is already spoken for.

Instead of signing those players, over that span the New York Yankees signed only a single draft-pick-compensation free agent, Rafael Soriano, 2010-11, and it was over the objections of Brian Cashman.  They kept their first-round draft picks in 2010, 2012, and 2013, and picked up a few compensation picks from departing free agents like Nick Swisher, Javier Vázquez and Soriano.

As Miles points out, however, the Yankees simply can’t stockpile picks and rebuild like a normal team.  This restraint is made possible by lavish spending in the 2008-9 offseason, where the Yankees signed pretty much everybody and then went out and won the World Series.  Signing Teixeira, Sabathia, and Burnett means the Yankees not only forfeited their first round draft pick, but their second and third round draft picks as well.

When viewed in the whole, however, this doesn’t appear to be that bad of a deal for the Yankees.  By moving their spending forward into the 2008-9 offseason instead of spreading it out over four years, they essentially traded their second and third round draft picks in 2009 for first-round draft picks in 2010, 2012, and 2013.  They repeated this approach 2013-4, signing Brian McCann, Jacoby Ellsbury, and Carlos Beltran, and while the early returns from those transactions are not promising, it should be noted that the McCann and Ellsbury deals, at least, were considered sound at the time they were signed.  Beltran?  Not so much.  With the last free agent with draft pick compensation attached off the board, they’re keeping their 2015 first round pick as well.

At a time when the aging curve for older players have suddenly become unforgiving, the value of young players is certainly up, and the Yankees appear to be maximizing their chances of acquiring young talent in the draft by minimizing the draft pick cost of signing free agents.  This approach is remarkably similar to their strategy in the international market, where they’ve determined the best way to acquire talent is not to stick to a limited bonus pool each year, but to sign ten or eleven of the top thirty international free agents, (and possibly one more.)  This approach costs them a great deal of money in luxury tax and international bonus pool “overage” tax, but may make sense given how much surplus value an above-average, cost-controlled young player generates.  Now, if only they could do something with all those draft picks


Why Did Xander Bogaerts Stop Walking?

For most of his baseball career Xander Bogaerts has been an extremely successful player, whether it’s been in the low or high minors. He’s also always been a highly touted prospect, primarily praised for his ability to hit the baseball all the while playing reasonably good defense as a shortstop. It’s not simply Bogaerts’ ability to impact the baseball that made him such a touted prospect, but also his approach. In his brief stint in the majors, in 2013, Bogaerts was lauded for his impeccable plate discipline, especially in the playoffs. As he should have been; in 2013, Bogaerts had a 10% walk rate, and in the postseason it skyrocketed to 17.6%.

This, however, was in a small sample size; Bogaerts only had 50 plate appearances in the majors in 2013, and only 34 in the playoffs. In 2014, Bogaerts, got off to a very strong start. He didn’t hit for much power at the beginning of the year but he walked an awful lot and the power was slowly starting to creep up. Around the end of May, Bogaerts had close to a 400 OBP.

The wheels though fell off after that. Bogaerts simply stopped walking and hitting well. He basically struggled the rest of the year apart from September where he did show signs of improvement. Bogaerts’ failures though went almost side by side with his walk rate apart from the last month of the season where he did have a spike in BABIP. Below is a chart of Bogaerts’ walks per month displayed by Baseball Savant.

Untitled.popopo

As you can see Bogaerts’ walks just took a huge dip after May. So what happened — why did Bogaerts just stop walking? Well there are a number of factors to consider here. First I think it’s important to look at how Bogaerts was pitched — did pitchers make a sudden adjustment? Below is a chart of hard, breaking, and off-speed pitches used against Bogaerts in 2014. Provided by Brooks Baseball.

loolololo

What is primarily noticeable is that pitchers, as the year went on started throwing fewer hard pitches and more breaking pitches. This, however, only shows us that pitchers made an adjustment to Bogaerts it doesn’t show us the full story; it doesn’t show us how Bogaerts reacted to the adjustments the pitchers were making.

There are many factors that can indicate how a player reacts to pitching adjustments. We can look at his swing rate or his whiff rate but the question, which we are really trying to answer, is: did something change in the player’s approach? Below I think is the most accurate example of how Bogaerts changed his approach at the plate and why he started walking a lot less. It’s a chart provided by Brooks Baseball that examines a player’s aggressiveness and passiveness, essentially his plate approach on hard, breaking, and off-speed pitches.

Untitled

As you can see Bogaerts early on in the year was a very patient hitter but as the season went on he became increasingly aggressive at the plate. In fact he didn’t just start getting more aggressive on one type of pitch, but rather in general. He went away from what made him successful on the outset and began his prolonged slump throughout the year. What can be rather alarming is that it wasn’t just a one or two-month spike in aggressiveness, but rather trend in increased aggressiveness throughout the year.

Xander Bogaerts is still a very young player — he’s going into his age 22 seasons and this breakdown by no means should be taken as a prediction for future failures. This is really just part of maturing as a young athlete, getting better and making adjustments. Bogaerts went through the highs and lows of a baseball season in 2014. While I don’t expect him to be a superstar next year, I do expect that we will see significant improvement in not just his stats but his approach at the plate. My advice to Bogaerts on this behalf would be to look back at what made him successful in the first two months of the 2014 season and try and replicate that. Don’t be so aggressive at the plate, just wait for your pitch and when you get it, put a good swing on it. This is of course an annoying cliché but I do think it applies in Bogaerts’ case.


National League Team Depth

Last week I looked at the AL, so it is time to talk about the Senior Circuit depth. After that I will discuss the limitations that I think exist in both my approach and Jeff’s, part of which could be a new form of MVP debates. What is depth?

Again, I started with a rough look at front line versus second for the teams:

Team Front Line Second
Dbacks 18.2 3.8
Cubs 24.3 4.1
Mets 21.4 2.8
Brewers 24 2
Padres 20.1 2.3
Dodgers 37.4 3.8
Rockies 23.6 2.3
Cards 33.9 3.3
Marlins 25.6 1.1
Pirates 28.1 1.1
Giants 28.9 1.1
Braves 18.8 0.6
Nats 42.1 1.3
Phils 14.3 -0.5
Reds 28.5 -1.3

I had to adjust my method of using the multiple of using front divided by second line a little bit to account for the Reds and Phillies who have negative second line projections by using absolute values.  The National League is structured in a more stars and scrubs way this year versus the American League where there are no teams that you point at and think they will be horrible.  In Philadelphia, Atlanta, and Arizona things are looking pretty grim on the front lines though I could argue that Atlanta has some upside relative to how much Steamer seems to hate their outfield and starting pitching.

This changed how my depth ranking compared to Jeff’s by making the Diamondbacks and Mets look pretty good depth-wise only due to a combination of okay backups mixed with pretty low overall front line WAR.  This is a limitation of the multiples I use as shrinking the numerator can make for a lower multiple if a bad team has a couple of decent bench players.  I will come back to the discussion of what is depth in a second.

Only one other team was ranked far away from Jeff, the Pirates, and they look a lot like the Yankees did in the AL.  In Pittsburgh, they have good players all over the front lines, but the team is going to depend on those guys a lot according to the projection.  Jeff is giving them credit for guys like Sean Rodriguez who could be capable fill-ins according to the projections, not a sentiment I necessarily disagree with and is something recommending the way he approached it.  So what is depth?

I think you can argue several different approached to depth.  Jeff is looking at total number of theoretically useful players, I am looking at a ratio of front line to second line performance to see how much the team is expected to lean on it’s front line, but I also think you could look at two approaches similar to these.  How many capable fill-ins and back-ups are there, Jeff’s number of players minus the number of starters in it would be a simple possible approach to look at how many holes are behind the first group.  Another would be total WAR drop from group 1 to 2 as a percent of front-line, or in other words how much worse is the second group in percent terms.  I could keep going as I have at least three other possibilities, but hopefully you get the point that depth is not a concrete concept just like what does valuable mean in MVP.

What I think might be the best statistical approach to this sort of problem is to have multiple independent people do what I and Jeff have already done and then aggregate the rankings.  Then our approaches can be biased by whatever version of depth we lean toward and let the problems with any given system of measurement be offset by the others.  This isn’t necessary to evaluate all teams, the Reds depth is bad period, but if you look at teams like the Yankees who I think are a little harder to project this year it could be useful.  Since I am a hobbyist who nearly no one knows or cares about, you can now disregard that pipe-dream, though I think over time a system like that would help in understanding how valuable depth is.