Why Did Xander Bogaerts Stop Walking?

For most of his baseball career Xander Bogaerts has been an extremely successful player, whether it’s been in the low or high minors. He’s also always been a highly touted prospect, primarily praised for his ability to hit the baseball all the while playing reasonably good defense as a shortstop. It’s not simply Bogaerts’ ability to impact the baseball that made him such a touted prospect, but also his approach. In his brief stint in the majors, in 2013, Bogaerts was lauded for his impeccable plate discipline, especially in the playoffs. As he should have been; in 2013, Bogaerts had a 10% walk rate, and in the postseason it skyrocketed to 17.6%.

This, however, was in a small sample size; Bogaerts only had 50 plate appearances in the majors in 2013, and only 34 in the playoffs. In 2014, Bogaerts, got off to a very strong start. He didn’t hit for much power at the beginning of the year but he walked an awful lot and the power was slowly starting to creep up. Around the end of May, Bogaerts had close to a 400 OBP.

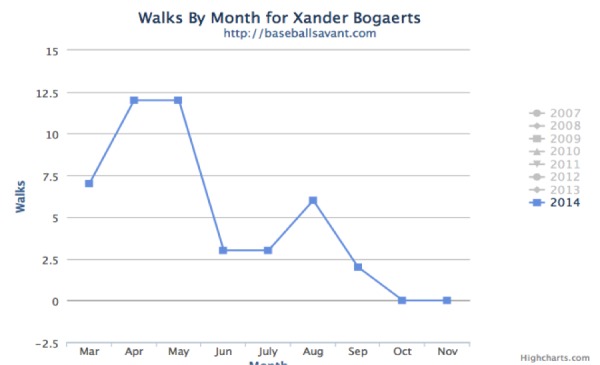
The wheels though fell off after that. Bogaerts simply stopped walking and hitting well. He basically struggled the rest of the year apart from September where he did show signs of improvement. Bogaerts’ failures though went almost side by side with his walk rate apart from the last month of the season where he did have a spike in BABIP. Below is a chart of Bogaerts’ walks per month displayed by Baseball Savant.

Untitled.popopo

As you can see Bogaerts’ walks just took a huge dip after May. So what happened — why did Bogaerts just stop walking? Well there are a number of factors to consider here. First I think it’s important to look at how Bogaerts was pitched — did pitchers make a sudden adjustment? Below is a chart of hard, breaking, and off-speed pitches used against Bogaerts in 2014. Provided by Brooks Baseball.

loolololo

What is primarily noticeable is that pitchers, as the year went on started throwing fewer hard pitches and more breaking pitches. This, however, only shows us that pitchers made an adjustment to Bogaerts it doesn’t show us the full story; it doesn’t show us how Bogaerts reacted to the adjustments the pitchers were making.

There are many factors that can indicate how a player reacts to pitching adjustments. We can look at his swing rate or his whiff rate but the question, which we are really trying to answer, is: did something change in the player’s approach? Below I think is the most accurate example of how Bogaerts changed his approach at the plate and why he started walking a lot less. It’s a chart provided by Brooks Baseball that examines a player’s aggressiveness and passiveness, essentially his plate approach on hard, breaking, and off-speed pitches.

Untitled

As you can see Bogaerts early on in the year was a very patient hitter but as the season went on he became increasingly aggressive at the plate. In fact he didn’t just start getting more aggressive on one type of pitch, but rather in general. He went away from what made him successful on the outset and began his prolonged slump throughout the year. What can be rather alarming is that it wasn’t just a one or two-month spike in aggressiveness, but rather trend in increased aggressiveness throughout the year.

Xander Bogaerts is still a very young player — he’s going into his age 22 seasons and this breakdown by no means should be taken as a prediction for future failures. This is really just part of maturing as a young athlete, getting better and making adjustments. Bogaerts went through the highs and lows of a baseball season in 2014. While I don’t expect him to be a superstar next year, I do expect that we will see significant improvement in not just his stats but his approach at the plate. My advice to Bogaerts on this behalf would be to look back at what made him successful in the first two months of the 2014 season and try and replicate that. Don’t be so aggressive at the plate, just wait for your pitch and when you get it, put a good swing on it. This is of course an annoying cliché but I do think it applies in Bogaerts’ case.


National League Team Depth

Last week I looked at the AL, so it is time to talk about the Senior Circuit depth. After that I will discuss the limitations that I think exist in both my approach and Jeff’s, part of which could be a new form of MVP debates. What is depth?

Again, I started with a rough look at front line versus second for the teams:

Team Front Line Second
Dbacks 18.2 3.8
Cubs 24.3 4.1
Mets 21.4 2.8
Brewers 24 2
Padres 20.1 2.3
Dodgers 37.4 3.8
Rockies 23.6 2.3
Cards 33.9 3.3
Marlins 25.6 1.1
Pirates 28.1 1.1
Giants 28.9 1.1
Braves 18.8 0.6
Nats 42.1 1.3
Phils 14.3 -0.5
Reds 28.5 -1.3

I had to adjust my method of using the multiple of using front divided by second line a little bit to account for the Reds and Phillies who have negative second line projections by using absolute values.  The National League is structured in a more stars and scrubs way this year versus the American League where there are no teams that you point at and think they will be horrible.  In Philadelphia, Atlanta, and Arizona things are looking pretty grim on the front lines though I could argue that Atlanta has some upside relative to how much Steamer seems to hate their outfield and starting pitching.

This changed how my depth ranking compared to Jeff’s by making the Diamondbacks and Mets look pretty good depth-wise only due to a combination of okay backups mixed with pretty low overall front line WAR.  This is a limitation of the multiples I use as shrinking the numerator can make for a lower multiple if a bad team has a couple of decent bench players.  I will come back to the discussion of what is depth in a second.

Only one other team was ranked far away from Jeff, the Pirates, and they look a lot like the Yankees did in the AL.  In Pittsburgh, they have good players all over the front lines, but the team is going to depend on those guys a lot according to the projection.  Jeff is giving them credit for guys like Sean Rodriguez who could be capable fill-ins according to the projections, not a sentiment I necessarily disagree with and is something recommending the way he approached it.  So what is depth?

I think you can argue several different approached to depth.  Jeff is looking at total number of theoretically useful players, I am looking at a ratio of front line to second line performance to see how much the team is expected to lean on it’s front line, but I also think you could look at two approaches similar to these.  How many capable fill-ins and back-ups are there, Jeff’s number of players minus the number of starters in it would be a simple possible approach to look at how many holes are behind the first group.  Another would be total WAR drop from group 1 to 2 as a percent of front-line, or in other words how much worse is the second group in percent terms.  I could keep going as I have at least three other possibilities, but hopefully you get the point that depth is not a concrete concept just like what does valuable mean in MVP.

What I think might be the best statistical approach to this sort of problem is to have multiple independent people do what I and Jeff have already done and then aggregate the rankings.  Then our approaches can be biased by whatever version of depth we lean toward and let the problems with any given system of measurement be offset by the others.  This isn’t necessary to evaluate all teams, the Reds depth is bad period, but if you look at teams like the Yankees who I think are a little harder to project this year it could be useful.  Since I am a hobbyist who nearly no one knows or cares about, you can now disregard that pipe-dream, though I think over time a system like that would help in understanding how valuable depth is.


Was Clay Buchholz Ever That Good?

This might be a scary thought to consider if you’re a Red Sox fan or if you’re a member of the Red Sox front office. Most of us including myself perceive Buchholz to be a really good pitcher who just happened to have a terrible year in 2014, which he did. Buchholz last year finished with a 5.34 ERA, which was the worst ERA of his career. His peripherals were better — that being said they were not great — his FIP was 4.01 and his xFIP was 4.04. The problem is that I think the Red Sox are banking or hoping that Buchholz has a bounce back year in 2015 and finds the “Cy Young” caliber form he displayed in 2013.

Buchholz in 2013 posted a great ERA at 1.74, and his FIP was really good too at 2.78. The problem was that he just couldn’t stay healthy throughout the year only pitching 108 innings. This has been a chronic problem for Buchholz throughout his career. Buchholz has never pitched 200 innings in a season; the most he’s ever pitched was in 2012, where he threw 189.1 innings. The other problem is that Buchholz performance has always been very volatile, one year he has a good ERA and then the next he has a bad ERA.

So let’s take a look at Buchholz’s underlying numbers to try and get a better understanding of his erratic performance records. First let’s look at 2013, where he conceptually had the best year of his career. He as I’ve already mentioned posted a great ERA though in a limited sample size. His BABIP that year was also very low at .254. What, however, was most alarming was his left on base percentage (LOB%). His LOB% in 2013 was at 83.7%, which is extremely high. A normal or league average LOB% is normally around 72%, Buchholz that year was well above that and quite frankly unsustainably high. Then if we look at his HR/FB ratio, at 4.5%, it’s also at an unsustainable rate. If you combine these factors, the low innings pitched, the BABIP, the HR/FB, and the LOB% for Buchhotlz great 2013 ERA, it’s easy to see why he had such a low ERA and why that probably was just a fluke.

Now let’s look at his 2010 season, which was considered by most to be his breakout year. In 2010 as you might have guessed Buchholz had a great ERA at 2.33, which probably gave the impression that he had a great year. His FIP however was at 3.61, which is above average, but his xFIP was at 4.07. His BABIP and HR/FB were also at unsustainable rates that year. His BABIP was .261 and his HR/FB ratio was at 5.6% creating his low ERA.

Finally let’s take a look at his 2012 season, the year where he pitched the most innings of his career, 189.1. I think this is the year that best describes Buchholz’s true value and not the skewed value of his 2010, 2013, and 2014 seasons (If you’re wondering what about 2011? Well he only pitched 82.2 innings so I pretty much discounted that year from the analysis). In 2012, Buchholz finished with a 4.56 ERA, his FIP was 4.65, and his xFIP was 4.43. These are not good numbers, in fact they’re well below-average numbers. This is a scary scene especially if you’re the Red Sox and hoping that Buchholz will bounce back. The essential problem is that the only year where Buchholz’s ERA lined up perfectly with his peripherals, the numbers weren’t pretty. His LOB% granted was a little bit low at 69.7% but his BABIP was also low at .283.

This is not a welcoming sight. I’m not actually certain that Buchholz was ever that good of a pitcher or rather a top of the rotation starter. It for the most part seems that his good years or good ERAs were merely a product of low BABIPs and good luck. It’s also not like he’s ever been a pitcher with a high strikeout to walk rate. His career K/9 is at 6.88 and his BB/9 is at 3.33. His K/9 and BB/9 have also always remained around his career average, with not much fluctuation, so it’s not like he’s been trending upward in that regard. Who I really think got Buchholz’s value just about right is Steamer. In 2015 Steamer projects him to finish with a 4.19 ERA and a 4.06 FIP, which is right around where I think Buchholz true talent and value lies. For those who think Buchholz has the great potential of a top of the line starter, well I’m sorry but at this point I just don’t see it; I think he’s probably more of a mid to back of the rotation starter. A useful piece in the rotation but definitely not someone who you should count on.


How to Use LABR Mixed Draft to Your Benefit

The 15-team LABR Mixed Draft is the most exciting of the expert fantasy drafts each year. Amateur fantasy owners from all over the globe tune into the live spreadsheet broadcast and debate each one furiously on social media.

Most of these amateurs are looking for expert guidance to help them in their own draft. They see a player getting drafted well above their ADP and they often move the player up on their own personal big board.

I do not think this is the best way to approach and absorb the most information out of LABR. When one expert reaches on a pick, we have no idea if there is a consensus. It could have been just one expert making a stand on a player he himself feels strongly about, or there could have been several owners who felt the same way about that player. We just don’t know.

What we do know is that when certain players drop well below their public rankings, there is an agreement of pessimism. That is the information that could be significant for the rest us. Every owner in the league letting a player fall well below their ADP is the expert consensus we should be looking for.

Here’s a quick look at nine players who the experts are cool on.

Read the rest of this entry »


2014 WAR Breakdown by Age (WAR, Part 2)

If you haven’t read Part I, you should consider doing so. For those who would prefer not to, this is a reminder of where these numbers came from:

Using FanGraphs’ terrific leaderboard tools, I found statistics for all players who played at each position in 2014. The following numbers apply only to the time spent at that position. Buster Posey, for example, accumulated 462 plate appearances at catcher, 128 at first base, and 9 at DH, so his plate appearances in those amounts are included for those positions in the table below.

For position players, I calculated WAR per 600 plate appearances. For starting pitchers, I used WAR per 150 innings pitched. For relievers, I used WAR per 50 innings pitched. Here is the table:

The table below shows a combination of all position players split into different age groups. The PA% column shows the percentage of plate appearances for each age group out of the total plate appearances for all hitters. As you can see, the 27 to 29 age range had the largest percentage of plate appearances and the “36 and up” group had the lowest. Similarly, the WAR% shows the percentage of total WAR accumulated by each age group. The column labeled “W%-PA%” shows the difference between the WAR% and the PA% columns. A positive difference is good. This means that age group was responsible for a higher percentage of WAR than their percentage of plate appearances.

POSITION PLAYER BREAKDOWN BY AGE

HITTERS N PA% PA WAR% W%-PA% WAR WAR/600 PA AVG OBP SLG wRC+
<23 238 9.0% 16518 9.7% 0.7% 55.1 2.0 .247 .303 .384 92
24 to 26 650 24.0% 44181 23.0% -1.0% 131.1 1.8 .253 .309 .387 94
27 to 29 685 27.8% 51118 31.5% 3.7% 179.7 2.1 .249 .314 .391 98
30 to 32 471 23.3% 42920 26.1% 2.7% 148.6 2.1 .255 .320 .384 99
33 to 35 236 11.4% 21029 10.0% -1.4% 57.2 1.6 .253 .326 .394 102
36 & up 112 4.4% 8162 -0.3% -4.7% -1.6 -0.1 .236 .292 .353 80


The meaty production for position players comes in the two age groups spanning ages 27 to 32. Players in this age range accounted for 51.1% of the total plate appearances and 57.6% of the total WAR. This age group didn’t hit as well as the “33 to 35” age group, but accumulated more WAR/600 PA, mainly due to the difference in the defensive component of WAR.

In news that should not surprise anyone, the “36 and up” age group was the worst, accumulating 4.4% of the total plate appearances but finished with -1.6 WAR with a wRC+ of 80.

Have you heard that on base percentage is an “older player’s skill”? Well, this table backs that up, as OBP increases for each age group from the “under 23” group up to the “33 to 35” group. That skill only lasts for so long, though, as offensive production plummets across-the-board in the “36 and up” age group.

STARTING PITCHER BREAKDOWN BY AGE

SP N IP% IP WAR% W%-IP% WAR WAR/150 IP ERA WHIP K/9 BB/9
<23 35 9.0% 2621.3 8.8% -0.2% 30.4 1.7 4.03 1.31 7.4 3.1
24 to 26 104 29.9% 8657.0 31.5% 1.6% 108.7 1.9 3.81 1.28 7.3 2.8
27 to 29 68 26.4% 7657.3 31.9% 5.5% 110.0 2.2 3.65 1.23 7.8 2.5
30 to 32 43 17.8% 5167.0 16.7% -1.1% 57.8 1.7 3.79 1.28 7.4 2.7
33 to 35 26 11.4% 3312.0 6.9% -4.5% 23.9 1.1 4.04 1.31 6.6 2.6
36 & up 13 5.4% 1577.3 4.2% -1.3% 14.4 1.4 4.00 1.30 6.8 2.5


In the hitter’s breakdown by age, the two most productive age groups spanned the ages from 27 to 32. For starting pitchers, the two most productive age groups were from age 24 to 29, with the “27 to 29” group being the most productive. This “27 to 29” age group had the best ERA, WHIP, and K/9. For starting pitchers, the “36 and up” age group was actually better than the “33 to 35” group, although the sample size was small, including just 13 pitchers 36 and older.

Strikeouts are important for every pitcher and the above chart shows how strikeouts dwindle as a pitcher ages. The “27 to 29” group has a K/9 of 7.8. This drops to 7.4 K/9 for the “30 to 32” group, then to 6.6 K/9 for the “33 to 35” age group.

RELIEF PITCHER BREAKDOWN BY AGE

RP N IP% IP WAR% W%-IP% WAR WAR/50 IP ERA WHIP K/9 BB/9
<23 50 5.0% 737.3 6.8% 1.8% 5.8 0.4 3.55 1.26 8.7 3.2
24 to 26 178 28.7% 4200.7 27.5% -1.3% 23.3 0.3 3.58 1.31 8.7 3.7
27 to 29 157 31.5% 4602.3 40.9% 9.4% 34.7 0.4 3.45 1.24 8.8 3.1
30 to 32 90 20.6% 3016.7 11.1% -9.5% 9.4 0.1 3.72 1.28 8.1 3.2
33 to 35 33 7.2% 1048.0 6.6% -0.6% 5.6 0.3 3.66 1.27 7.6 3.1
36 & up 29 6.9% 1015.0 7.1% 0.1% 6.0 0.3 3.76 1.27 8.0 3.2


For relief pitchers, the bulk of the production is right there in the “27 to 29” age group. This group accounted for 31.5% of the relief pitcher innings and 40.9% of relief pitcher WAR. They also were tops among all groups in ERA, WHIP, and K/9. The next-oldest group of relievers (“30 to 32”) was the worst, accumulating 20.6% of the relief pitcher innings but just 11.1% of relief pitcher WAR. This looks like the age where strikeouts drop precipitously. Relief pitchers aged 27 to 29 averaged 8.8 K/9 as a group, while those in the “30 to 32” age group had just 8.1 K/9.

The information above is the big picture breakdown by age group for all hitters, starting pitchers, and relief pitchers. Part 3 of this series will show the age group breakdown for each position.


Contact Quality (CQ)

Set forth below is a description of a short-hand stat designed to measure how well a batter hits when he hits a fair ball.  I call it “Contact Quality” or “CQ.”

Obviously, BABIP is the most common measure of hitting balls-in-play.  But BABIP excludes home runs, and doesn’t otherwise distinguish between singles and extra-base hits.  One possible approach would be to compute slugging average on fair balls (“fair balls” refers balls-in-play plus home runs).  However, the weights used in slugging average do not accurately reflect the value of different types of base hits.

CQ uses the weights from wOBA, in a simplified fashion, before the adjustment to normalize the scale to OBP.  Rounding the weights, I assign 0.8 for a single, 1.1 for a double, 1.4 for a triple, and 1.7 for a home run.  Or, in other words, 0.5 for a hit and 0.3 per total base.

So, the formula is:  (0.5*H+0.3*TB)/(AB-K)

Interestingly, the average CQ in 2014 was .312, as compared to an average OBP of .314.

CQ is intended to be a simple stat that, together with K% and BB%, gives a pretty good profile of any batter.

If a batter’s CQ is above .400, he is considered a member of Mensa (contact quality division).  In 2014, among qualified batters, the following were Mensa members:

1. Giancarlo Stanton (.453)
2. Mike Trout (.450)
3. Jose Abreu (.435)
4. Chris Carter (.407)
5. Justin Upton (.405)
6. Andrew McCutchen (.404)
7. Matt Kemp (.403)

Rounding out the top 10:

8. Miguel Cabrera (.388)
9. Anthony Rizzo (.387)
10. Marlon Byrd (.386)


Breaking Down 2014 WAR (Part 1)

What better to do in the middle of winter when there are still a couple weeks until pitchers and catchers report than to look at WAR. In particular, I was curious about WAR in 2014. What positions had the most WAR? What age group? How did younger pitchers compare to older pitchers? So many WAR questions…

I started with the breakdown of WAR by position.

Using FanGraphs’ terrific leaderboard tools, I found statistics for all players who played at each position in 2014. The following numbers apply only to the time spent at that position. Buster Posey, for example, accumulated 462 plate appearances at catcher, 128 at first base, and 9 at DH, so his plate appearances in those amounts are included for those positions in the table below.

For position players, I calculated WAR per 600 plate appearances. For starting pitchers, I used WAR per 150 innings pitched. For relievers, I used WAR per 50 innings pitched. Here is the table:

HITTERS

POS N PA WAR WAR/600 PA AVG OBP SLG wOBA wRC+
C 102 19391 80.3 2.5 .245 .309 .380 .306 94
1B 171 20548 50.4 1.5 .255 .331 .426 .332 112
2B 156 20470 66.4 1.9 .256 .313 .373 .304 92
3B 148 20302 75.5 2.2 .259 .318 .397 .316 101
SS 124 19983 73.5 2.2 .255 .310 .368 .301 90
LF 208 20492 58.1 1.7 .257 .322 .402 .321 104
CF 140 20959 98.0 2.8 .265 .325 .394 .319 103
RF 200 20670 63.1 1.8 .261 .324 .411 .324 107
DH 261 10132 8.4 0.5 .247 .317 .420 .323 107
P 308 5491 -3.8 -0.4 .122 .153 .152 .141 -19
PH 574 5483 -0.9 -0.1 .213 .291 .322 .275 74


PITCHERS

SPs N IP WAR WAR/150 IP ERA WHIP K/9 BB/9 HR/9
SP 289 28992.0 345.2 1.8 3.82 1.27 7.4 2.7 0.9


RPs N IP WAR WAR/50 IP ERA WHIP K/9 BB/9 HR/9
RP 537 14620.0 84.8 0.3 3.58 1.28 8.5 3.3 0.8


Some things that stand out for me are listed below. These aren’t earth-shattering insights, but interesting nonetheless:

  • You can see the influence of the positional adjustment and defensive value by comparing some positions. For example, left fielders and center fielders had similar offensive numbers in 2014 (LF: .321 wOBA, 104 wRC+; CF: .319 wOBA, 103 wRC+), yet there was a 1.0 difference in WAR/600 PA.
  • The three weakest-hitting spots—catcher, second base, and shortstop—make up for it with their defensive chops and the defensive adjustment.
  • Players at first base had the best hitting numbers (.332 wOBA, 112 wRC+) but the lowest WAR total among all position players (DH not included).
  • Players in the Designated Hitter spot accounted for just 8.4 WAR and three players accounted for 8.8 WAR (the rest accumulated negative WAR): Victor Martinez (3.9 WAR), David Ortiz (2.7 WAR), and Chris Carter (2.2 WAR).
  • Starting pitchers had a better ERA than relievers (3.82 to 3.58), which isn’t surprising, but relievers had a higher WHIP (1.28 to 1.27), which did surprise me. Relievers struck out more batters (8.5 K/9 to 7.4 K/9) but also walked more (3.3 BB/9 to 2.7 BB/9).


NEVER TRUST ANYONE OVER 30

The following tables show the breakdown for all hitters, starting pitchers, and relief pitchers by age; specifically, the group of players aged 29 and younger compared to the “30 and over” group.


HITTERS N PA% PA WAR% W%-PA% WAR WAR/600 PA AVG OBP SLG wRC+
<29 975 60.8% 111817 64.2% 3.4% 365.8 2.0 .250 .310 .388 95
30 & up 535 39.2% 72111 35.8% -3.4% 204.2 1.7 .252 .319 .383 98
SPs N IP% IP WAR% W%-IP% WAR WAR/150 IP ERA WHIP K/9 BB/9
<29 207 65.3% 18935.7 72.2% 6.8% 249.1 2.0 3.78 1.27 7.5 2.7
30 & up 82 34.7% 10056.3 27.8% -6.8% 96.1 1.4 3.90 1.29 7.0 2.6
RPs N IP% IP WAR% W%-IP% WAR WAR/50 IP ERA WHIP K/9 BB/9
<29 385 65.3% 9540.3 75.2% 10.0% 63.8 0.3 3.51 1.27 8.7 3.4
30 & up 152 34.7% 5079.7 24.8% -10.0% 21.0 0.2 3.71 1.28 8.0 3.1


Not surprisingly, players 29 and under were better than players 30 and over and this was true for hitters and pitchers. There was a big difference in the magnitude, though. For hitters, the difference was about 0.3 WAR/600 PA. This is true even though the older group of hitters had a better wRC+. Defense matters.

For starting pitchers, the difference was 0.6 WAR/150 IP, with starting pitchers 29 and under accumulating 65.3% of the innings pitched by starting pitchers and 72.2% of starting pitcher WAR. Starting pitchers 29 and younger had a K/9 of 7.5, while those 30 and older saw their K/9 drop to 7.0.

Relief pitchers showed the greatest difference between the two age groups in WAR% – IP%, with the younger group finishing at +10.0% (65.3% of the innings pitched, 75.2% of the WAR). There was a big difference in strikeout rate for the two groups, with the younger relief pitchers getting more strikeouts (8.7 K/9 to 8.0 K/9).

POSITION BREAKDOWN BY AGE (29 AND UNDER vs. 30 AND OVER).

C N PA% PA WAR% W%-PA% WAR WAR/600 PA AVG OBP SLG
<29 59 57.8% 11200 61.1% 3.3% 49.1 2.6 .247 .308 .394
30 & up 43 42.2% 8191 38.9% -3.3% 31.2 2.3 .243 .311 .360


Young catchers had 0.3 more WAR/600 PA than older catchers. On the offensive side, young catchers outslugged older catchers (.394 to .360) but had a lower OBP (.308 to .311).

Best catcher 29 and under: Jonathan Lucroy, 28 (6.3 WAR)

Best catcher 30 and older: Russell Martin, 31 (5.4 WAR)

Dishonorable Mention: Jose Molina, 39 (-1.3 WAR)


1B N PA% PA WAR% W%-PA% WAR WAR/600 PA AVG OBP SLG
<29 103 49.4% 10141 57.9% 8.6% 29.2 1.7 .254 .331 .434
30 & up 68 50.6% 10407 42.1% -8.6% 21.2 1.2 .256 .331 .417


First base had a near 50-50 split in plate appearances for players 29 and under and 30 and over, but the younger players were 0.5 WAR/600 PA better.

Best first baseman 29 and under: Anthony Rizzo, 24 (5.6 WAR)

Best first baseman 30 and older: Miguel Cabrera, 31 (4.9 WAR)

Dishonorable Mention: Jon Singleton, 22 (-1.1 WAR)


2B N PA% PA WAR% W%-PA% WAR WAR/600 PA AVG OBP SLG
<29 108 61.7% 12623 57.6% -4.1% 38.2 1.8 .255 .311 .375
30 & up 48 38.3% 7847 42.4% 4.1% 28.2 2.2 .259 .315 .370


Second base was one of four positions (DH included) at which players 30 and over had more WAR/600 PA than the younger group.

Best second baseman 29 and under: Jose Altuve, 24 (5.0 WAR)

Best second baseman 30 and older: Ian Kinsler, 32 (5.5 WAR)

Dishonorable Mention: Stephen Drew, 31 (-1.0 WAR)


3B N PA% PA WAR% W%-PA% WAR WAR/600 PA AVG OBP SLG
<29 104 73.5% 14925 63.5% -10.1% 48.0 1.9 .253 .311 .399
30 & up 44 26.5% 5377 36.5% 10.1% 27.5 3.1 .276 .335 .392


Third base had the biggest discrepancy between players 29 and under and 30 and over when it comes to WAR/600 PA, with a difference of 1.2 WAR/600 PA in favor of the older group, even as the younger group had almost three times as many plate appearances.

Best third baseman 29 and under: Josh Donaldson, 28 (6.5 WAR)

Best third baseman 30 and older: Adrian Beltre, 35 (5.7 WAR)

Dishonorable Mention: Matt Dominguez, 24 (-1.7 WAR)


SS N PA% PA WAR% W%-PA% WAR WAR/600 PA AVG OBP SLG
<29 91 65.8% 13154 59.8% -6.1% 43.9 2.0 .252 .306 .363
30 & up 33 34.2% 6829 40.2% 6.1% 29.6 2.6 .261 .319 .377


Shortstop was another position at which players 30 and over had more WAR/600 PA, thanks in part to a better hitting line across the board.

Best shortstop 29 and under: Troy Tulowitzki, 28 (5.2 WAR)

Best shortstop 30 and older: Jhonny Peralta, 32 (5.3 WAR)

Dishonorable Mention: Josh Rutledge, 25 (-0.8 WAR)


LF N PA% PA WAR% W%-PA% WAR WAR/600 PA AVG OBP SLG
<29 133 60.3% 12355 65.2% 4.9% 37.9 1.9 .260 .318 .410
30 & up 75 39.7% 8137 34.8-% -4.9% 20.2 1.5 .253 .328 .390
CF N PA% PA WAR% W%-PA% WAR WAR/600 PA AVG OBP SLG
<29 100 77.1% 16149 82.5% 5.4% 80.7 3.0 .265 .324 .398
30 & up 40 22.9% 4810 17.5% -5.4% 17.3 2.1 .265 .329 .381
RF N PA% PA WAR% W%-PA% WAR WAR/600 PA AVG OBP SLG
<29 123 51.8% 10714 61.0% 9.2% 38.5 2.2 .258 .321 .413
30 & up 77 48.2% 9956 39.0% -9.2% 24.6 1.5 .264 .327 .409


You can see how youth plays a role in the different outfield positions by observing the plate appearance percentage for each position. In left field, the split is roughly 60-40 in favor of players 29 and under. In centerfield, where speed is more important, 77% of the plate appearances were given to player 29 and under. In right field, it was much closer to 50-50. All three outfield positions saw more WAR/600 PA from the younger group of players in 2014.


Best left fielder 29 and under: Michael Brantley, 27 (4.5 WAR)

Best left fielder 30 and older: Alex Gordon, 30 (6.6 WAR)

Dishonorable Mention: Domonic Brown, 26 (-1.6 WAR)


Best center fielder 29 and under: Mike Trout, 22 (7.5 WAR)

Best center fielder 30 and older: Jacoby Ellsbury, 30 (3.9 WAR)

Dishonorable Mention: Junior Lake, 24 (-2.5 WAR)


Best right fielder 29 and under: Giancarlo Stanton, 24 (6.2 WAR)

Best right fielder 30 and older: Jose Bautista, 33 (6.1 WAR)

Dishonorable Mention: Oscar Taveras, 22 (-1.2 WAR)


DH N PA% PA WAR% W%-PA% WAR WAR/600 PA AVG OBP SLG
<29 154 37.1% 3763 10.7% -26.4% 0.9 0.1 .245 .305 .412
30 & up 107 62.9% 6369 89.3% 26.4% 7.5 0.7 .248 .323 .425


The DH spot is an older player’s spot, with 63% of the plate appearances at DH given to players 30 and over. This group accounted for 89% of the DH WAR, with a higher batting average, on-base percentage, and slugging percentage.

Best DH 29 and under: Chris Carter, 27 (2.2 WAR)

Best DH 30 and older: Victor Martinez, 35 (3.9 WAR)

Dishonorable Mention: Kendrys Morales, 31 (-1.5 WAR)


P N PA% PA AVG OBP SLG
<29 219 64.8% 3558 .125 .158 .159
30 & up 89 35.2% 1933 .118 .144 .140


Pitchers are just terrible hitters, old and young, fat and skinny, tall and short. They stink at hitting. Older pitchers are a little more stinky at hitting than younger pitchers.

Best Pitcher (hitting) 29 and under: Travis Wood, 27 (1.0 WAR)

Best Pitcher (hitting) 30 and older: Madison Bumgarner, 30 (1.2 WAR)

Dishonorable Mention: Bartolo Colon, 41 (-0.7 WAR) Colon was 2 for 62 with 0 walks and 33 strikeouts. Somehow, he managed to score 3 runs. That’s kind of mind-boggling, really.


PH N PA% PA AVG OBP SLG
<29 379 58.9% 3230 .219 .289 .332
30 & up 195 41.1% 2253 .204 .293 .308


This might surprise some people. When I think of pinch-hitters, I picture the aging veteran who calmly comes off the bench to deliver a big hit, like Manny Mota in the 70s or Rusty Staub in the 80s or Matt Stairs in the 00s. Last year, though, pinch-hitting was a younger man’s game. Players 29 and under had 59% of the pinch-hitting plate appearances and a slightly better triple-slash batting line.

Best Pinch-Hitter 29 and under: Delmon Young 28 (0.6 WAR)

Best Pinch-Hitter 30 and older: John Mayberry, 30 (0.8 WAR)

Dishonorable Mention: Greg Dobbs, 35 (-0.5 WAR)

That’s probably enough for now. More likely, it’s way too much. Either way, if you notice anything interesting about these numbers, please make your observations known in the comments. Next up is a more involved breakdown of WAR by age group for hitters and pitchers.

Hardball Retrospective – The “Original” 2013 Arizona Diamondbacks

In “Hardball Retrospective: Evaluating Scouting and Development Outcomes for the Modern-Era Franchises”, I placed every ballplayer in the modern era (from 1901-present) on their original team. Consequently, Dave Winfield is listed on the Padres roster for the duration of his career while the Athletics claim Rickey Henderson and the Twins declare Rod Carew. I calculated revised standings for every season based entirely on the performance of each team’s “original” players. I discuss every team’s “original” players and seasons at length along with organizational performance with respect to the Amateur Draft (or First-Year Player Draft), amateur free agent signings and other methods of player acquisition. Season standings, WAR and Win Shares totals for the “original” teams are compared against the “actual” team results to assess each franchise’s scouting, development and general management skills.

Expanding on my research for the book, the following series of articles will reveal the finest single-season rosters for every Major League organization based on overall rankings in OWAR and OWS along with the general managers and scouting directors that constructed the teams. “Hardball Retrospective” is available in digital form on Amazon, Barnes and Noble, GooglePlay and KoboBooks – other eBook formats coming soon. Additional information and a discussion forum are available at TuataraSoftware.com.

Terminology

OWAR – Wins Above Replacement for players on “original” teams

OWS – Win Shares for players on “original” teams

OPW% – Pythagorean Won-Loss record for the “original” teams

Assessment

The 2013 Arizona Diamondbacks    OWAR: 37.3  OWS: 274  OPW%: .542

Josh Byrnes and Joe Garagiola, Jr. procured all but one of the ballplayers on the best “Original” Diamondbacks roster in team history – the 2013 crew. Thirty-nine of the 50 players entered the organization via the Amateur Draft with the remaining 11 signed as amateur free agents. Byrnes’ selections focused on the pitching staff while Garagiola placed a distinct emphasis on offense. Based on the revised standings the “Original” 2013 Diamondbacks secured the National League West division title with an 88-74 record .

Max Scherzer (21-3, 2.90) anchored the starting staff and earned the Cy Young Award with a dazzling campaign. Arizona’s first selection in the 2006 Amateur Draft fashioned a League-best WHIP of 0.970, whiffed 240 batsmen in 214.1 innings pitched and merited his first All-Star appearance. Portsider Jorge De La Rosa compiled a 16-6 record along with an ERA of 3.49. Fellow left-hander Wade Miley (10-10, 3.55) eclipsed 200 innings pitched in his sophomore season after placing runner-up in the 2012 NL ROY balloting. Jarrod Parker (12-8, 3.97) yielded admirable results from the fourth slot in the rotation. The D-Backs bullpen featured a capable collection of late-inning relievers, none of which assumed the reins of the closer’s role.

ROTATION POS WAR WS
Max Scherzer SP 6.47 19.96
Jorge De La Rosa SP 4.06 13.45
Wade Miley SP 1.59 11.13
Jarrod Parker SP 1.58 9.37
Ross Ohlendorf SP 0.98 4.31
BULLPEN POS WAR WS
Sergio Santos RP 0.84 3.97
Javier Lopez RP 0.76 4.56
Ryan Cook RP 0.72 7.32
Josh Collmenter RP 0.36 6.56
Bryan Shaw RP 0.29 6.8
Charles Brewer RP 0.04 0.4
Tommy Layne RP -0.06 0.28
Mike Belfiore RP -0.14 0
Trevor Bauer SP -0.15 0.15
Evan Scribner RP -0.19 0.78
Daniel Stange RP -0.23 0
Jose Valverde RP -0.25 0.94
Chris Capuano SP -0.48 1.99
Barry Enright SP -0.65 0
Edgar Gonzalez RP -0.69 0
Eury De La Rosa RP -0.73 0
Brett Anderson SP -0.85 0
Hector Ambriz RP -0.86 0

Paul Goldschmidt (.302/36/125) finished second in the 2013 NL MVP voting. Arizona’s eighth-round pick in the 2009 Amateur Draft topped the Senior Circuit in home runs, RBI and SLG (.551). Justin Upton jacked 27 long balls while outfield mate Carlos Gonzalez swatted 26 big-flies. Dan Uggla contributed 22 taters but struggled mightily at the dish, batting a mere .179 while striking out in nearly 40 percent of his at-bats. Miguel Montero experienced an off-year and Carlos Quentin endured an injury-plagued season for the second straight campaign. Stephen Drew tied a career-high with 67 RBI while A.J. Pollock laced 28 two-base knocks in his first full season. Gerardo Parra collected his second Gold Glove and supplied some pop as the fourth outfielder.

LINEUP POS WAR WS
A. J. Pollock CF 1.51 13.64
Stephen Drew SS 3.48 16.78
Carlos Gonzalez LF 2.37 17.34
Paul Goldschmidt 1B 6.38 32.05
Justin Upton RF/LF 3.75 23.27
Dan Uggla 2B 2.25 12.14
Miguel Montero C 1.59 10.93
Carlos Quentin DH/LF 1.56 13.46
Matt Davidson 3B 0.24 2.38
BENCH POS WAR WS
Gerardo Parra RF 1.11 16.67
Chris Owings SS 0.27 2.18
Zach Walters 3B 0.1 0.56
John Hester C 0.03 0.11
Lyle Overbay 1B 0 8.59
Adam Eaton LF 0 5.2
Jake Elmore SS -0.03 1.66
Mark Reynolds 1B -0.06 10.77
Chris Snyder C -0.14 0.46
Emilio Bonifacio 2B -0.16 8.56
Pedro Ciriaco SS -0.16 2.65
Marc Krauss LF -0.18 1.46
Alfredo Marte LF -0.2 0.19
Collin Cowgill LF -0.22 1.65
Ryan Wheeler 1B -0.32 0.06
Alberto Gonzalez 3B -0.33 0.98
Chad Tracy 3B -0.46 0.37
Scott Hairston LF -0.47 1.99

The “Original” 2013 Arizona Diamondbacks roster

Player POS WAR WS General Manager Scouting Director
Max Scherzer SP 6.47 19.96 Josh Byrnes A.J. Hinch
Paul Goldschmidt 1B 6.38 32.05 Josh Byrnes Mike Berger
Jorge De La Rosa SP 4.06 13.45 Joe Garagiola Tommy Jones
Justin Upton LF 3.75 23.27 Joe Garagiola
Stephen Drew SS 3.48 16.78 Joe Garagiola
Carlos Gonzalez LF 2.37 17.34 Joe Garagiola Tommy Jones
Dan Uggla 2B 2.25 12.14 Joe Garagiola Tommy Jones
Miguel Montero C 1.59 10.93 Joe Garagiola Tommy Jones
Wade Miley SP 1.59 11.13 Josh Byrnes A.J. Hinch
Jarrod Parker SP 1.58 9.37 Josh Byrnes A.J. Hinch
Carlos Quentin LF 1.56 13.46 Joe Garagiola Tommy Jones
A. J. Pollock CF 1.51 13.64 Josh Byrnes Mike Berger
Gerardo Parra RF 1.11 16.67 Joe Garagiola
Ross Ohlendorf SP 0.98 4.31 Joe Garagiola
Sergio Santos RP 0.84 3.97 Joe Garagiola Tommy Jones
Javier Lopez RP 0.76 4.56 Joe Garagiola Tommy Jones
Ryan Cook RP 0.72 7.32 Josh Byrnes A.J. Hinch
Josh Collmenter RP 0.36 6.56 Josh Byrnes A.J. Hinch
Bryan Shaw RP 0.29 6.8 Josh Byrnes A.J. Hinch
Chris Owings SS 0.27 2.18 Josh Byrnes Mike Berger
Matt Davidson 3B 0.24 2.38 Josh Byrnes Mike Berger
Zach Walters 3B 0.1 0.56 Josh Byrnes Mike Berger
Charles Brewer RP 0.04 0.4 Josh Byrnes Mike Berger
John Hester C 0.03 0.11 Josh Byrnes A.J. Hinch
Lyle Overbay 1B 0 8.59 Joe Garagiola Tommy Jones
Adam Eaton LF 0 5.2 Josh Byrnes Mike Berger
Jake Elmore SS -0.03 1.66 Josh Byrnes A.J. Hinch
Mark Reynolds 1B -0.06 10.77 Joe Garagiola
Tommy Layne RP -0.06 0.28 Josh Byrnes A.J. Hinch
Chris Snyder C -0.14 0.46 Joe Garagiola Tommy Jones
Mike Belfiore RP -0.14 0 Josh Byrnes Mike Berger
Trevor Bauer SP -0.15 0.15 Kevin Towers Mike Bell
Emilio Bonifacio 2B -0.16 8.56 Joe Garagiola Tommy Jones
Pedro Ciriaco SS -0.16 2.65 Joe Garagiola Tommy Jones
Marc Krauss LF -0.18 1.46 Josh Byrnes Mike Berger
Evan Scribner RP -0.19 0.78 Josh Byrnes A.J. Hinch
Alfredo Marte LF -0.2 0.19 Josh Byrnes
Collin Cowgill LF -0.22 1.65 Josh Byrnes A.J. Hinch
Daniel Stange RP -0.23 0 Josh Byrnes A.J. Hinch
Jose Valverde RP -0.25 0.94 Joe Garagiola
Ryan Wheeler 1B -0.32 0.06 Josh Byrnes Mike Berger
Alberto Gonzalez 3B -0.33 0.98 Joe Garagiola Tommy Jones
Chad Tracy 3B -0.46 0.37 Joe Garagiola Tommy Jones
Scott Hairston LF -0.47 1.99 Joe Garagiola Tommy Jones
Chris Capuano SP -0.48 1.99 Joe Garagiola Tommy Jones
Barry Enright SP -0.65 0 Josh Byrnes A.J. Hinch
Edgar Gonzalez RP -0.69 0 Joe Garagiola Tommy Jones
Eury De La Rosa RP -0.73 0 Josh Byrnes A.J. Hinch
Brett Anderson SP -0.85 0 Josh Byrnes A.J. Hinch
Hector Ambriz RP -0.86 0 Josh Byrnes A.J. Hinch

Honorable Mention

The “Original” 2006 Diamondbacks    OWAR: 40.4  OWS: 213  OPW%: .523

Brandon Webb (16-8, 3.10) achieved Cy Young honors as Arizona attained its first National League Wild Card berth.

On Deck

The “Original” 1922 Browns

Previous Articles

The “Original” 2003 Marlins

References and Resources

Baseball America – Executive Database

Baseball-Reference

James, Bill, with Jim Henzler. Win Shares. Morton Grove, Ill.: STATS, 2002. Print.

Retrosheet – Transactions Database

Seamheads – Baseball Gauge

Sean Lahman Baseball Archive


The Giants’ Offense Doesn’t Care About the Platoon Advantage

As many articles have pointed out over the last few weeks, the Giants are going to be at a loss for power in 2015. Steamer projects only three players to have double-digit homers, and they’re the usual power suspects from the team: Buster Posey, Hunter Pence and Brandon Belt. Brandon Crawford is close with nine, but the Giants might have to look into every possible crevice they can to find that power in an environment where power is scarce in the first place.

Except maybe the Giants have already hit their peak in production, regardless of a lack of power. While for most teams it would be a cause for concern and employing someone like a Dayan Viciedo would be a worthwhile addition to help against lefties, the team looks like even Viciedo’s power success against lefties isn’t necessary. Take a look at the totals from the left-handed batters the Giants will employ in 2015 with a minimum of 50 2014 PA, sorted by wRC+ (forgive my rudimentary table in my maiden voyage):

Player PA OBP SLG OPS ISO BABIP wOBA wRC+
Brandon Crawford 178 .395 .484 .879 .163 .404 .383 152
Nori Aoki 124 .428 .435 .863 .073 .398 .386 150
Joe Panik 84 .381 .458 .839 .084 .437 .369 143
Gregor Blanco 138 .346 .384 .730 .088 .363 .325 112
Brandon Belt 71 .324 .391 .715 .125 .306 .318 108

That’s five left-handed hitters who were above-average against southpaw pitchers in 2014. Nori Aoki’s highly vaunted league-leading .363 batting average was a talking point during last postseason with him being able to slot into the #2 spot in the Royals lineup regardless of who was pitching, but on his new team, he wasn’t even the best player against same-handed pitching. Crawford routinely crushed southpaws, yet Bruce Bochy kept him down in the lineup a majority of the time regardless of who pitched. Panik’s arrival and success against lefties also came with a giant flashing “BABIP! SMALL SAMPLE SIZE!” sign, but his contact-based approach should serve him well. Aoki’s arrival probably pushes him down in the order, but Panik’s early success is obviously a good sign even if his BABIP comes back down to Earth (as it is for all the players on this list).

The most interesting part of the chart is Belt. When Brett Pill was still a Giant and hitting homers off Clayton Kershaw, there was scuttlebutt about whether or not Pill should step in and hit when a lefty was on the hill. Then Pill showed off just how much talent he had and the Giants turned to Belt on an everyday basis anyways. Much like his fellow Brandon, Belt has done very well against lefties in his career with a .338 wOBA and a 120 wRC+. Those are numbers where the platoon advantage isn’t really necessary, but Belt has yet to put together a full season worthy of what many have expected of him. An injury-free 2015 season for him could go a long way in telling if the 350+ PA against lefties throughout his career will hold up or will fall by the wayside.

The other (unfortunately) obvious part of the Giants not needing to utilize the platoon is because they have possibly the worst bench in all of baseball. Outside of Andrew Susac, who could start for any other catcher-deficient team in the league, the Giants employ a light-hitting, defensive-oriented bench outfit. That plays well in AT&T Park, but when you need to give guys a day off here and there, lefties facing Juan Perez and Joaquin Arias aren’t going to be as afraid as they would be if any available Brandon is standing in the box. That’s where Blanco’s bat comes into play, as giving Aoki, Pagan or even Hunter Pence a day off doesn’t lead to a huge drop-off in production even if a lefty is on the hill.

While the Giants aren’t as flexible as other teams (with their cross-bay rivals leading the charge in mix-and-match lineups) their distinct lack of platoon advantage doesn’t necessarily hurt them. Their lack of depth and betting on a full season of Pagan, a full season of Belt and Aoki shoring up left field might be gambles, but if everything works (and it’s a rather large “if”), the Giants might have been able to replace the production of the departed Pablo Sandoval in their weird, unique way.


Phil Hughes a Cy Young Candidate in 2015?

If you told me, at the end of 2013 (5.19 ERA) that Phil Hughes would have a chance to win a Cy Young, I would’ve told you, no way. If you told me in 2012 (4.23 ERA) that Phil Hughes had a chance to win a Cy Young, I would’ve said it was highly improbable. If you told me in 2011 (5.79 ERA) that Phil Hughes had a chance to win a Cy Young, I would’ve told you to get out of my face; the guy would be lucky to be in the starting rotation (the Yankees’ starting rotation). That’s because for a large part of his career Phil Hughes was a terrible starting pitcher. Not a bad starter, a terrible starter. He was actually, over the last three years, before 2014, one of the worst starting pitchers in baseball.

2014, though, was a different story. In the 2013-14 offseason Hughes signed a 3-year, 24-million-dollar contract with the Minnesota Twins. That year Hughes had one of the best seasons in all of baseball, and needless to say the best season of his career. Just how good was Hughes in 2014? Well Hughes pitched a career high 209.2 innings. His ERA was moderately good at 3.52 but he had the sixth-best FIP in all of baseball at 2.65. The only pitchers to have a better FIP in 2014 were Garrett Richards, Chris Sale, Felix Hernandez, Corey Kluber, and Clayton Kershaw. Of those five only Hernandez and Kluber pitched more innings than Hughes.

Hughes finished with an above-average K/9 that year at 7.98 but he led all of baseball with .69 BB/9. Phil Hughes’ BB/9 in 2014 was one of the greatest BB/9 of all time (37th all time), in fact the last pitcher to have a BB/9 better than Hughes was Carlos Silva, also of the Twins in 2005 at .43. Hughes’ great peripherals allowed him to finish with a 6.1 fWAR, which was tied as the fourth-best fWAR in all of baseball (not including position players). Only Kluber, Kershaw, and Hernandez had a better fWAR than Hughes in 2014.

The 2014 season, however, was a complete anomaly for Hughes. For most of his career he’s been awful. So how can one determine if he’ll be a Cy Young candidate in 2015? First I think it’s important to consider one’s BABIP. This after all could have just been a fluky BABIP year. It, however, was not. Hughes was actually unlucky by BABIP standards at .324. BABIPs though can be inflated when a pitcher gets a lot of groundballs, but Hughes does not, his GB% is at 36.5, which is below average. Hughes has predominantly been a fly-ball pitcher so I do expect his BABIP to normalize somewhat next year.

Then I think it’s important to see if Hughes made some adjustments to his repertoire and his pitching style. In the table below, provided by Brooks Baseball you can see Hughes’ pitch usage since he’s entered the big leagues.

Year Fourseam Sinker Cutter Curve Slider Change Split
2007 67.60 0.00 0.00 22.39 3.88 6.03 0.00
2008 62.65 0.00 6.79 22.58 2.72 5.26 0.00
2009 59.72 3.01 16.11 20.59 0.00 0.58 0.00
2010 63.94 0.00 15.82 16.81 0.00 3.44 0.00
2011 59.41 0.00 12.13 20.96 1.82 5.69 0.00
2012 65.31 0.44 1.71 17.37 5.16 10.00 0.00
2013 61.48 0.00 0.00 8.64 23.72 5.12 1.04
2014 60.78 4.36 20.27 14.36 0.00 0.20 0.00

It seems the important element to observe here is Hughes has always thrown a ton of fourseam fastballs and that clearly has not changed. What has changed, however, is his use of sliders, cutters, sinkers, and changeups. Hughes essentially completely rebuilt his repertoire in 2014, apart from his curveball and fourseam fastball. Hughes abandoned the slider and changeup and basically added a sinker. He also re-started using a cutter, a pitch he basically or barely used over the past two years. Now, it’s the second-most-used pitch in his repertoire.

I don’t know who in the Twins organization told Hughes to re-start throwing a cutter, but he probably deserves a raise (unless Hughes decided to throw it all on his own of course). Hughes throws his cutter at an average speed of 89.2 mph. He threw the pitch a total of 509 times and the wRC+ against it was only 71. It also netted an IFFB% of 23.4 and a GB% of 46.4.

This of course was not the only adjustment made by Hughes in 2014. Hughes was never someone who walked a lot of hitters but a .69 BB/9 is extremely low. Below is Phil Hughes’ heat map for 2014.

Untitledppppppp

As you can see, Hughes basically decided to throw the ball down the middle. Is this a good strategy? To be honest I’m not 100% percent sure but it sure did work for Hughes in 2014 and it’s definitely efficient. This strategy obviously isn’t conducive to a lot of walks and it won’t tire a pitcher out. Plus when one considers the low scoring environment, throwing a pitch right down Broadway may not be such a bad idea. It’s also not like Hughes is throwing a ton of off speed pitches down the middle, most of the pitches he throws are fastball and cutters, in fact more than 80% of them are. Which makes his success all that more impressive.

This strategy may be devised to fit Hughes’ new environment and more specifically his new ballpark. Hughes as I’ve already mentioned is a fly ball pitcher, his FB% last year was 40.2%, which was the 15th highest FB% in the majors. When Hughes was pitching for the Yankees he was pitching in a stadium that gave up a lot of home runs. In 2014 Yankee Stadium yielded the third-most home runs in the majors, after Great American Ball Park (Cincinnati) and Coors Field (Colorado). Giving up a lot of fly balls in a home-run-heavy ballpark is typically not a good mix. In 2012 Hughes’ HR/FB ratio was 12.4%, well above average and in 2013 it was 11.1%. The Twins stadium (Target Field), however, is not conducive to home runs, in 2014 it ranked 23rd in home runs allowed. Phil Hughes’ HR/FB ratio dropped to 6.2%.

So is this going to translate into another great 2015 season? Well one thing is certain, Hughes is staying put and so he will play most of his games in Target Field, which should keep his numbers down (when I say down that’s a good thing). However, there’s no way of being 100% sure or accurate on this and Steamer does project a 3.89 ERA with a 3.90 FIP. Hughes, though, I think has a very good chance of repeating his success due to his pitching adjustments and new pitching approach. Plus Hughes’ high BABIP of 2014 should normalize somewhat. Maybe next year he’ll have a low BABIP and his numbers will look even better, netting him a Cy Young. Who knows?

I think a lot of people have a hard time believing in one year of success and with good reason, for all we know it could just be a blip on the radar. That being said, pitchers, sometimes, just figure something out; sometimes things just click. Maybe they invent a new pitch or maybe they re-discover an old one, like Hughes. Sometimes they even change their entire approach to pitching and find success in the latter years of their career, like Cliff Lee. Phil Hughes could very well be that guy and he definitely wouldn’t be someone I would write off in 2015.