Velocity and the Likelihood of Tommy John Surgery
Around a month ago I wrote an article entitled “Tommy John Surgery and Throwing 95+ MPH”. Basically what I was trying to find out was, are pitchers who throw harder more likely to have Tommy John. The article fell short of this discovery, mainly because I only looked at pitchers who threw 95 or more. I wanted to get more in-depth but as my semester was coming to an end, I simply didn’t have the time to do an expanded study. Since then my semester has ended and I do have the time to get more in-depth.
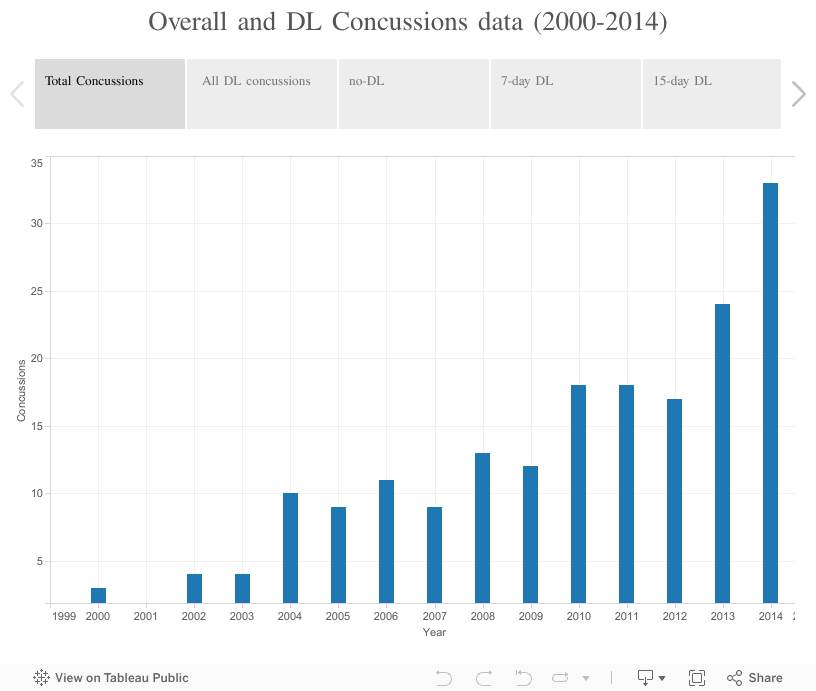
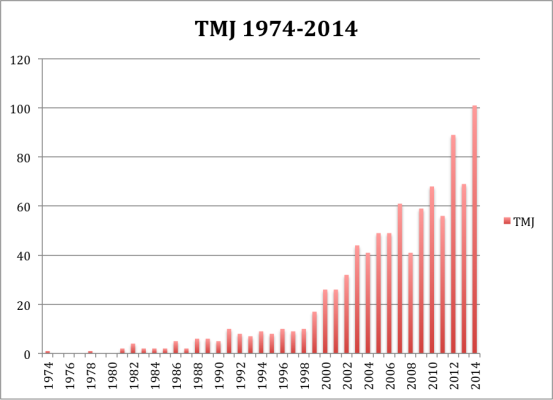
First, however, we’re going to tread back and look at old work. In November 2012, Jon Roegele came out with an article introducing his and Jeff Zimmerman’s Tommy John surgery list. At this point, I think it’s pretty safe to say it’s the most complete list of Tommy John surgeries. The list can be found on Jeff’s site baseballheatmaps.com. Below is an updated chart of the list.
Then in July of 2013 Will Carroll came out with an article stating that 33% of opening day Major League pitchers had undergone the surgery. I, however, found the study problematic, which I discussed in my previous article.
In March of 2014, Jeff looked at players who threw a pitch 100MPH or harder and found that 25% of them had the surgery. And finally at this year’s Sloan Sports Analytics Conference, Dr. Glenn Fleisig found that 16% of all pitchers had Tommy John, 15% of Minor Leaguers had Tommy John, and 25% of Major Leaguers fell under the knife.
So how does this relate to velocity? Well in my previous article I found that 32% of pitchers who threw 95+ MPH on average had the surgery. If we are to believe Will Carroll’s findings then really there isn’t any significant risk of throwing harder. If we, however, choose to look Dr. Fleisig’s results then throwing harder does increase your chances of having Tommy John.
There are essentially two sources where velocity data can be found, PITCHfx, which dates back to 2007 and Baseball Info Solution (BIS), which dates back to 2002. Below is the yearly velocity data.
| Year | PITCHfx | BIS |
| 2002 | 89.56 | |
| 2003 | 89.6 | |
| 2004 | 89.77 | |
| 2005 | 90.01 | |
| 2006 | 90.17 | |
| 2007 | 91.67 | 90.05 |
| 2008 | 91.39 | 90.43 |
| 2009 | 91.6 | 90.71 |
| 2010 | 91.82 | 91.01 |
| 2011 | 92.21 | 91.19 |
| 2012 | 92.34 | 91.32 |
| 2013 | 92.5 | 91.44 |
| 2014 | 93.05 | 91.43 |
As you can see velocity is on the rise. There are also discrepancies in the data. This is why when I did my study I looked at PITCHfx and BIS data separately to see if I would get different results.
Before we get into my results, however, I’ll explain my methodology. I gathered the PITCHfx data in Baseball Prospectus’ leaderboard. I looked at all the years available and did not set an innings limit, in order to get as large of a sample size as possible. This gave me 1484 pitchers to work with. I then looked up, which pitchers had Tommy John surgery. I basically did the same thing for the BIS data, which was gathered at FanGraphs. Again did not set an innings limit and this gave me a sample size of 2097 pitchers. I did not include position players as I felt they would skew the data.
I also set buckets for the velocity. The goal was to get as close to the exact velocity, while at the same time maintaining a respectable sample size. I did my best with this; you’ll find that in some cases there are some sample size issues.
So let’s begin. Below you will find the percent of pitchers who have had Tommy John surgery based on their velocity group.
PITCHfx
| Velo | Sample Size | TMJ Count | TMJ % |
| 96+ | 99 | 36 | 36.36% |
| 95+ | 196 | 61 | 31.12% |
| 92 to 95 | 584 | 158 | 27.05% |
| 89 to 92 | 530 | 106 | 20% |
| 86 to 89 | 151 | 34 | 22.51% |
| 86- | 23 | 4 | 17.39% |
BIS
| Velo | Sample Size | TMJ Count | TMJ % |
| 96+ | 36 | 8 | 22.22% |
| 95+ | 113 | 40 | 35% |
| 92 to 95 | 547 | 147 | 26.87% |
| 89 to 92 | 890 | 190 | 21.34% |
| 86 to 89 | 429 | 83 | 19.34% |
| 85- | 118 | 16 | 13.55% |
From this data it’s pretty clear that velocity does increase one’s likelihood of getting Tommy John surgery. The biggest increase happens from the 89-92 bucket to the 92-95 bucket. There is also a pretty big increase when looking at the 95+ bucket, in both tables, although I would argue that the sample size there is somewhat small. This doesn’t mean, however, that we can’t come to any conclusions. A 113 or 196 sample is definitely not as accurate as a 500 sample, but I don’t think that it’s unreasonable to suggest, based on this data, that throwing 95+ increases one’s likelihood of getting the surgery.
Also you might have noticed that in the PITCHfx table the 86 to 89 buckets are actually more likely to have Tommy John than the 89 to 92 group. This can be due to a couple of factors: A) We can definitely attribute some of this to a small sample size, especially since in the BIS table (where the sample is bigger) it shows a drop in percentage. B) The pitchers who are throwing in that group are probably older and therefore are more prone to the injury.
You’re at this point probably curious to see the results, so here they are. I was debating (with myself) whether I should show this or not. The sample is really small and I’m not sure we can really conclude anything from it. But I figured that showing some data is better than no data.
PITCHfx Age
| Velo | Sample Size | Avg. Age |
| 96+ | 36 | 23.44 |
| 95+ | 61 | 23.48 |
| 92 to 95 | 158 | 24.85 |
| 89 to 92 | 106 | 25.56 |
| 86 to 89 | 34 | 27.05 |
| 86- | 4 | 33.5 |
BIS Age
| Velo | Sample Size | Avg. Age |
| 96+ | 8 | 25.87 |
| 95+ | 40 | 23.87 |
| 92 to 95 | 147 | 24.51 |
| 89 to 92 | 190 | 25.65 |
| 86 to 89 | 83 | 27.02 |
| 85- | 16 | 28.68 |
So pitchers in the lower groups are older, this would seem to make sense, although again each sample is small. More data needs to be gathered here to come to an accurate conclusion. (The age chosen, for each individual pitcher, was the age of the year the Tommy John surgery occurred).
I also wanted to look at the difference between starting pitchers and relievers, or at least see if there was a difference. The logic being that on average relief pitchers will throw harder than starters so maybe they would have a higher likelihood of getting Tommy John surgery based on their velocity.
A relief pitcher was defined as this: GS/G < 0.5. Jeff Zimmerman deserves the credit here. For a while now I’ve been struggling to define what qualifies as a relief pitcher. Then I read Jeff’s latest article at The Hardball Times and stupidly asked how he defined a relief pitcher. Obviously he had defined it in the article (GS/G <0.5) and I missed it. I personally like this barometer for a relief pitcher. While I could have simply sorted the pitchers by there type on FanGraphs and BP, I don’t know where they draw the line on a relief pitcher. This at least gives us a concrete definition of what a reliever is. I also like this better than an arbitrary innings limit.
Important to also note is that the overall relief and starting pitcher data has nothing to do with velocity. It is rather the overall percentage of relief and starting pitchers who have undergone Tommy John. For BIS it dates back to 2002 and PITCHfx it’s 2007. Ok enough chitter-chatter, here are the results.
Overall PITCHfx RP
| Sample Size | TMJ Count | TMJ % |
| 1016 | 241 | 23.72% |
Overall BIS RP
| Sample Size | TMJ Count | TMJ % |
| 1475 | 321 | 21.76% |
PITCHfx RP
| Velo | Sample Size | TMJ Count | TMJ % |
| 96+ | 89 | 30 | 33.70% |
| 95 + | 175 | 51 | 29.14% |
| 92 to 95 | 412 | 110 | 26.69% |
| 89 to 92 | 340 | 61 | 17.94% |
| 86 to 89 | 77 | 16 | 20.77% |
| 86- | 12 | 3 | 25% |
BIS RP
| Velo | Sample Size | TMJ Count | TMJ % |
| 96+ | 35 | 8 | 22.85% |
| 95+ | 101 | 32 | 31.68% |
| 92 to 95 | 437 | 121 | 27.68% |
| 89 to 92 | 604 | 118 | 19.53% |
| 86 to 89 | 262 | 42 | 16.03% |
| 86- | 71 | 8 | 11.26% |
And now the starters.
Overall PITCHfx SP
| Sample Size | TMJ Count | TMJ % |
| 464 | 121 | 26.07% |
Overall BIS SP
| Sample Size | TMJ Count | TMJ % |
| 623 | 155 | 24.87% |
PITCHfx SP
| Velo | Sample Size | TMJ Count | TMJ % |
| 95 to 98 | 20 | 9 | 45% |
| 92 to 95 | 169 | 48 | 28.40% |
| 89 to 92 | 190 | 45 | 23.68% |
| 89- | 85 | 19 | 22.35% |
BIS SP
| Velo | Sample Size | TMJ Count | TMJ % |
| 94 to 97 | 23 | 10 | 43.47% |
| 91 to 94 | 191 | 47 | 24.60% |
| 88 to 91 | 272 | 69 | 25.36% |
| 88- | 137 | 29 | 21.16% |
Ok, let’s start with the relief pitchers, they’re less complicated. Basically the results aren’t very surprising, the harder one throws the higher chance one will fall under the knife. There again seems to be this vast increase between the 89 to 92 bucket and 92 to 95. Also, and this was surprising to me, the overall results for relievers show that they are actually less likely to have Tommy John, than the starters. Even more interesting was while BIS and PITCHfx data show different numbers, they seem to be telling the same story here. That starting pitchers are about 3% more likely to have Tommy John than relief pitchers.
Now let’s focus on the starters, and this is where there is a serious discrepancy in the data. With PITCHfx it shows that velocity does impact a starter’s likelihood of getting the surgery. While with the BIS data, the evidence is more ambiguous and the sample size is larger in the BIS data. I’m not sure what to personally make of this. Some might point out that the sample is not ideal. I would agree with that, a sample of 400 or 500 would be more accurate but a sample of 272 or even 169 are nothing to sneeze at. This is when the evidence is starting to take shape. What was even more surprising was that it was the BIS data that was more ambiguous because the sample is bigger.
There could also be a larger number of factors at play here. Starting pitchers throw more innings than relief pitchers, which puts added stress on the arm. They also throw more pitches, which based on which pitch they throw could also increase their chances of getting the surgery. Finally, and this is more of a hypothesis than anything, starting pitchers tend to have longer careers than relief pitchers. Therefore the older a pitcher gets the more likely he is to having a drop in velocity, while still maintaining the risk of Tommy John. This is of course a hypothesis. I think more data needs to be acquired to make a more accurate statement, but now at least I wouldn’t be surprised if the starting pitchers data was more ambiguous.
Finally let’s look at the overall results. This has nothing to do with velocity, just general Tommy John percentage.
Overall PITCHfx
| Sample Size | TMJ Count | TMJ % |
| 1484 | 363 | 24.46% |
Overall BIS
| Sample Size | TMJ Count | TMJ % |
| 2097 | 476 | 23% |
As you can see these results are more in line with Dr. Fleisig’s results (25% Major League pitchers). I don’t think it’s unreasonable there are some differences, however. This would depend on our methods of gathering the data and how we defined what a Major League pitcher is. My definition was very loose. Basically if a pitcher came up and threw one inning, then I put him in the results. The reason why I didn’t have a stricter definition of what a Major League pitcher was was because my goal wasn’t to find the percentage of Majors League pitchers who had Tommy John. Rather it was to examine the relationship between velocity and Tommy John surgeries. This is really just an added bonus. Also, Dr. Fleisig’s goal was to see how many current pitchers had Tommy John. My results are the percentage of pitchers who have had Tommy John since 2002 and 2007. We, however, now can accurately conclude, in my estimation, that Carroll’s results were way too high and that velocity does increase a player’s chance of having Tommy John.
This can make pitcher selection now very interesting. For example, if you are trying to decipher whether to get a pitcher who throws 96 MPH who is just as good as a pitcher who throws 90 MPH, you might be better off taking the guy who throws 90. By doing that you would be reducing the odds that that pitcher has Tommy John by about 7 to 10 percent, which is pretty good if you ask me. Also if you’re a GM or in fantasy and are terrified of relievers because you think they all tear their ulnar collateral ligaments, well you shouldn’t be. Your starters are actually slightly more likely to tear their UCL. There are of course other factors to consider here but these can serve as basic general guidelines. Finally velocity does increase your likelihood of tearing your UCL, although with starters the data is a little murkier.
Bonus: Pitchers who have had multiple Tommy John surgeries.
PITCHfx
| Sample Size | Velo | Age |
| 25 | 93.53 | 24.68 |
BIS
| Sample Size | Velo | Age |
| 31 | 92.17 | 25.12 |