How Legit Is Carlos Correa?

Hearing Carlos Correa’s name can lead to polarizing reactions. If you’re one of the lucky few who managed to snatch him up in fantasy, then you celebrate every time he is mentioned. If you’re an Astros fan, I’d imagine you’d do the same, although being from New Jersey, I can’t say I actually know any Astros fans. However, if you’re not a part of one of those two groups, you’re probably asking “He can’t actually be this good, can he?”

Fortunately for me, I’m part of the group that owns him in fantasy. Because of this, I just want to enjoy the ride and not worry about whether it will end or not. With the fantasy trade deadline coming up though, it is something that I decided to look into. On a pace of 98 runs, 43 home runs, 115 RBIs, 17 steals, and a .297/.344/.573 slash line over a 162-game season, it’s hard to believe that he can keep that up.

First let’s take a look at the average. In 2014, at A+, Correa hit .325 with a .373 BABIP. You don’t expect a BABIP that high, but someone of his quality can certainly carry one over .320, so it’s at least not worrisome. This year, at AA, he actually improved on his average from a year ago, hitting .385 with a this time unsustainable .447 BABIP. He’s good, but not that good. This was evident upon his promotion to AAA, where he hit .276 with a .286 BABIP over 24 games. For someone only 20 years old and moving through the minors so fast, struggling (at least for his standard) was to be expected. In the majors though, he’s hitting a cool .297 with .312 BABIP, both seemingly in line with his career minor league numbers and looking like they will stay where they are.

Then there’s the OBP. Correa is reaching base at a .344 clip, which is actually lower than what he’s had at every level in the minors except for his 17-year-old debut season. His walk rate has decreased at each level, from 12.3% to 11.3% to 10.6% to the 6.7% it’s at right now. That’s concerning, but to be expected for such a young hitter moving up the ranks so quickly. His strikeout rate has also gone up to 19.1%, leaving his BB/K at an ugly .35. Without taking walks, it’ll be hard for Correa to continue getting on base at his current rate, but with the way he hits the ball and the lineup protection he has behind him, it’s hard to see his OBP dropping much below .340. Furthermore, if he keeps that high OBP and continues to bat in a top-4 spot (it’s hard to tell where he’ll bat in the lineup once George Springer returns from injury), his counting stats should have no problem continuing at their torrid pace as well.

It’s hard to believe anyone would have a question whether he could keep up his stolen-base production. He stole 18 bases earlier this year in the minors over 53 games while only being caught once. The year before that, he stole 20 bases in 62 games being caught 4 times. If anything, you’d expect Correa to actually have more stolen bases, but it’s hard to complain if he reaches the 15-steal mark.

The one thing that is probably the most in question is the power. His 24.5 HR/FB% would rank him 8th among qualified hitters, right below Mark Teixeira and above hitters like J.D. Martinez, Jose Abreu, Paul Goldschmidt, and Albert Pujols. Fortunately for Correa and his average, he sprays the ball around the field better than any of those players (even Martinez!), but that may not actually be helpful for his power as pulling the ball will generally produce more power. He also makes less hard contact than those above him on the HR/FB% leaderboard, which makes us question the number in the limited sample size we’ve seen.

In order to get a more accurate picture, I looked into the PITCHf/x data from baseball savant. Only 11 of Correa’s home runs were tracked this way, but that’ll have to do. According to the data, Correa actually had a higher average angle off the bat on his home runs, as well as a higher exit velocity (30.7 compared to 27.6 and 102.8 compared to 102.7). His batted ball distance, though, was shorter, calculating to 389 feet as opposed to the league average on home runs of 397.9 feet. While 10 feet is certainly meaningful, when combined with his better-than-average angle off the bat and exit velocity, it’s hard to credit too many of his home runs to luck. Even giving him 11 instead of 13 for the season, he’d still be on a 37 home run pace.

Getting away from the fancy numbers, the good news about all this is that Correa actually has an ISO that would be 6th best in the majors, due in large part to the 14 doubles he has collected alongside his 13 home runs. Correa’s power seems to be legit, and it wouldn’t be surprising to see him challenge for 30 home runs by the time the season is done.

After looking at the numbers, everything from Correa seems to check out, and it’s clear that he’s not just benefiting from luck. If he could achieve numbers even close to his pace, he already deserves to be called the best shortstop in the game. Over the past 10 years, the best offensive season by WAR for a shortstop came from Hanley Ramirez in 2008 when he had 125 runs, 33 home runs, 63 RBIs, 35 SBs, and a slash line of .301/.400/.540. Based on his prorated numbers, Correa could easily have that season next year, maybe with a few less stolen bases, a slightly lower OBP, and double the RBIs. Oh yeah, and he’s 20. Take that, Bryce Harper.


Examining Latino Hitters’ Plate Discipline

Abstract

It has been suggested that Latino players participating in Major League Baseball swing wildly at pitches outside the defined strike zone, that is, they are considered undisciplined batters, especially when compared to their trained American counterparts in the MLB. This paper examines that assumption and also the effectiveness of this possible lack of discipline, that is, if the Latino players hit more pitches outside the strike zone, hit for a higher batting average than American players, and walk or strike out at different rates. Based upon common beliefs in the baseball community that Latino players are less disciplined, and that they are generally superior players to Americans, the initial hypothesis of the observational study is that Latinos will swing at more pitches outside the zone, hit more of those pitches, walk less, strike out more, and hit for a higher batting average than their American counterparts.

The observational study focused on two populations: American Major League players and Major League players from the Dominican Republic, Cuba, Puerto Rico, Panama, and Venezuela. Further, the population consisted only of players who are currently on a Major League roster, whether active or on the Disabled List, and who have had at least 500 career at-bats, the equivalent of approximately one full MLB season of at-bats.

The initial hypothesis was nearly completely correct: Latino players did swing at a significantly higher percentage of pitches outside the strike zone than did American players, hit more of those pitches, and hit for a higher batting average. However, there was no evidence as to whether Latinos or Americans walked more, but there was evidence that American players strike out at a higher rate than their Latino counterparts.

The Study

Research Question

There is a Major League Baseball adage which references non-Mexican Latino baseball players who aspire to leave their homelands to become part of American baseball. The vernacular maxim is “You never walk off the island,” that is, batters are encouraged to swing at pitches outside the defined baseball strike zone in the hope that they can become more successful hitters. The central question which will be answered in this analysis is, “Are Major League Baseball players from the Dominican Republic, Cuba, Puerto Rico, Panama, and Venezuela less disciplined at the plate than their American counterparts?” An undisciplined batter is defined as one who swings at pitches outside the strike zone. A secondary significant corollary question to be investigated is, “Is this undisciplined approach actually successful or unsuccessful, that is, does an undisciplined approach work successfully for those Latino players?”

Data Collection

This experimenter utilized all 30 MLB team rosters courtesy of the 30 team pages on http://espn.go.com/mlb/players to find that there are 217 Major League players from the United States who are currently on a roster, whether active or on the Disabled List, who have had at least 500 career at-bats. There are additionally 82 players from the Dominican Republic, Cuba, Panama, Puerto Rico, and Venezuela who also are on an MLB roster and have had at least 500 career at-bats. The 217 American players were assigned a number between 1 and 217, and a random number generator was utilized to produce 21 unique numbers which correspond to the 21 American players used in the sample. The 82 Latino players were assigned a number between 1 and 82, and a random number generator was utilized to determine eight unique numbers which correspond to the eight players used in the sample. This random sample was taken from the entire population of Latino and American players with at least 500 career at-bats, and each sample, following research guidelines, is necessarily less than 10% of the population. Once the two samples had been assembled, the search feature on fangraphs.com provided all five statistics in its Standard and Plate Discipline charts for each player. The statistics will be referred to as OS for O-Swing%, that is, percent of swings at pitches outside the strike zone, OC for O-Contact%, that is, contact made on those swings at pitches outside the strike zone, K for strikeout percentage, BB for walk percentage, and BA for batting average.

Data Charts

Latino Player Outside Swing, OS % Outside Contact, OC % Strikeout, K % Walk, BB % Batting Average, BA
Pablo Sandoval 45.6 77.9 13.2 7.3 0.293
Alexei Ramirez 37.7 72.6 11.9 4.8 0.276
Alcides Escobar 34.7 74.6 13.2 4.2 0.265
Jose Altuve 36.1 81.1 10.6 5.3 0.304
A. Hechavarria 37.5 76.2 16.8 4.5 0.258
Miguel Montero 30.8 67.7 19.5 9.9 0.265
Yadier Molina 30.0 77.1 9.3 7.0 0.284
Carlos Gonzalez 35.2 56.6 22.4 7.9 0.290


American Player Outside Swing, OS % Outside Contact, OC % Strikeout, K % Walk, BB % Batting Average, BA
Kole Calhoun 31.0 63.7 19.4 7.8 0.276
Jarrod Dyson 24.5 74.3 18.7 8.4 0.252
Brian Dozier 25.7 70.7 18.3 9.4 0.243
Jonny Gomes 27.4 51.7 26.9 10.3 0.243
Evan Gattis 43.5 66.8 23.3 5.1 0.243
Dee Gordon 34.9 80.0 15.8 5.1 0.288
Reed Johnson 32.2 63.4 18.2 4.5 0.279
JJ Hardy 26.2 71.0 14.6 6.8 0.260
Collin Cowgill 29.4 62.3 25.2 7.7 0.238
Jonathan Lucroy 31.1 76.3 14.0 7.8 0.282
AJ Pierzynski 39.2 72.0 11.6 4.8 0.282
Travis d’Arnaud 27.8 73.0 15.4 7.8 0.240
Chris Johnson 40.7 55.5 24.2 4.8 0.283
Torii Hunter 30.1 55.0 17.9 6.9 0.279
Delmon Young 41.2 61.1 18.0 4.1 0.284
Devin Mesoraco 33.6 63.0 20.1 8.3 0.241
Anthony Rizzo 23.7 77.4 18.5 11.0 0.261
Nolan Arenado 40.5 74.5 13.0 4.8 0.277
David Wright 23.2 65.3 18.4 10.9 0.298
Mike Zunino 36.4 51.0 32.0 5.0 0.199
Josh Thole 27.5 76.5 13.5 9.1 0.249


Brief Discussion of Summary Statistics

There is much less variability in the sample statistics for the Latino players than for the American players. The interquartile ranges for four of the five statistics are smaller for Latino players, and the ranges of the sample data are smaller for all five statistics among the Latino players. These two range differences suggest higher homogeneity among the Latino players participating in American baseball and higher heterogeneity among their American counterparts.

Inference Procedures

µ1 = Mean O-Swing%, O-Contact%, K%, BB%, or BA for Latino players

µ2 = Mean O-Swing%, O-Contact%, K%, BB%, or BA for American players

Conditions: 1) Random samples (stated)

2) The samples are at most 10% of the population (stated)

3) n < 30, but the normal probability plots for all five statistics for both Latinos and

Americans appear linear, so normality of the statistics is

assumed

HO: µ1 – µ2 = 0

HA: µ1 – µ2 > 0 (In walks and strikeouts, two t-tests were used; HA: µ1 – µ2 < 0 in the second tests)

α = .05

Discussion and Conclusions for Each Statistic

1) O-Swing, OS: There is not sufficient evidence at α = .01 that Latino players are less disciplined than US players, that is, that they swing at more pitches thrown outside of the strike zone per 100 pitches than do American players. However, at the proposed α = .05, there would be evidence that Latinos are less disciplined hitters, that is, they swing at significantly more outside pitches than do their American counterparts.

2) O-Contact, OC: There is not sufficient evidence at α = .01 that Latino players are more adept at making contact with pitches outside of the strike zone, that is, that the mean O-Contact for Latino players is higher than American players. However, at the proposed α = .05, there would be evidence that Latinos make contact with a higher percentage of pitches outside of the strike zone.

3) Batting Average, BA: There is not sufficient evidence at α = .01 that Latino players hit for a higher average than Americans. However, at the proposed α = .05 level of significance, there would be evidence that Latino players do hit for a higher batting average than American players.

4) Base on Balls, BB: There is not sufficient evidence that American players have a higher walk rate than Latino players. This indicates that, despite being more disciplined hitters, Americans still do not walk more often than Latinos.

5) Strikeout, K: There is not sufficient evidence that Latino players strike out more than American players. In fact, there is evidence that Americans strike out more than Latinos.

Final Conclusion

Utilizing the five two-sample t-tests, there is evidence at the proposed α = .05 significance level, but not at α = .01, that Latino players are less disciplined hitters than are American players and swing at a higher percentage of pitches outside the strike zone. However, this undisciplined approach works for players from the Dominican Republic, Cuba, Panama, Puerto Rico, and Venezuela, as they more often successfully make contact with those outside pitches. The term ‘less disciplined’ denotes that a hitter would be less effective and not make contact, but this is not true based upon the sample. The analysis indicates Latino players actually hit a higher percentage of the pitches they swing at outside of the strike zone than American players. Further, they statistically hit for a higher batting average than their American counterparts, which is not unexpected since they hit more pitches outside the zone than do trained American hitters. Similarly, they statistically strike out less frequently than American players since they are better ‘outside the zone’ hitters. Lastly, despite American players’ more disciplined approach at the plate, that is, they swing at fewer outside pitches, there is statistically no evidence that Americans have a higher walk rate than Latinos.

As noted above, all conditions for inference were met. The selection of players was completely randomized, but an interesting trend occurred within the selected players: more ‘star players’ were randomly selected in the Latino group than in the American group, again suggesting a higher level of homogeneity in the Latino players. The eight randomly chosen Latino players have appeared in 15 All-Star games, while the 21 American players account for only 19 All-Star appearances. Based upon the analyses, it appears that Non-Mexican Latino baseball players do indeed “swing their way off the island.”


Trades from the Trade Value Lists: Part 1 – 2007

As regular FanGraphs readers know, during the All-Star Break every baseball season, managing editor Dave Cameron meticulously assembles what he believes to be the 50 most valuable trade assets in all of Major League Baseball at the given moment. These posts are almost always the most highly viewed, anticipated, and commented on articles that FanGraphs publishes, and are guaranteed to stir up lively debate over the superstars of today’s game. As fans, we love to break down contracts and skillsets, evaluating players to the most minute of details in order to argue Kris Bryant versus Carlos Correa or Mookie Betts versus Joc Pederson.

I asked David Schoenfield, MLB blogger at ESPN, on one of his chats, what he’d like to know if he had complete and easy access to all of Dave’s past trade value lists, with all the relevant information for each player such as age, contract status, and years controlled. I’m not saying I tediously compiled all that for each list, but I’m not saying I didn’t.

I’d like to thank David for answering, and not just answering, but giving me a two-part response. The first part reads, “How many actually got traded and what did they get in return?” He begins with a direct answer, telling me exactly the kind of analysis he would conduct using Dave’s lists. The ESPN Sweetspot blogger then follows with “I think we’d learn that the returns for these types of players is less than pre-trade speculation. With Tulo, the Jays didn’t have to give up their top prospects, for example.” David offers his own hypothesis based on observations from recent events, a solid well-founded theory. Not only was former Colorado Rockies superstar Troy Tulowtizki just traded for a package some have deemed a little light, David was likely also considering the trade involving former Oakland A’s superstar Josh Donaldson as well, which surprised many people by the seemingly inadequate return Billy Beane acquired for his third baseman.

Let’s take a look. What are Dave’s top 50 players being traded for?

For this exercise, I only looked at players traded while being listed for the most recent trade value list released by Dave, up to 2007. In other words, if a player was ranked, then at any time was dealt before the next list was released, he’s fair game. That provides us nine lists to look at, but unfortunately for the AJ Preller in all of us, there haven’t been any trades involving the players in this year’s top-50 just listed a couple weeks ago. So in other words, sorry David. The Tulowitzki trade won’t count here because Dave did not consider him a top-50 trade asset, despite the shortstop qualifying for every single list before this year’s since 2008 and only dropping out of the top 15 once in those seven years.

All trade information was taken from Baseball-Reference.com. For each player, I’ve included next to their name, their age at the time of trade, along with their final year of team control and the amount due for that player including all team options.

Starting with 2007: http://www.ussmariner.com/2007/04/12/mlb-trade-value-for-2007/

2007

  1. Miguel Cabrera: 24 years old, controlled through 2009, Arb2 – Arb3
  • December 4, 2007: Traded by the Florida Marlins with Dontrelle Willis to the Detroit Tigers for Dallas Trahern (minors), Burke Badenhop, Frankie De La Cruz, Cameron Maybin, Andrew Miller and Mike Rabelo.

For the best hitter of this generation, the Florida Marlins received two top 10 overall prospects in Cameron Maybin and Andrew Miller along with two more organizational top 10 players in Eulogio de la Cruz and Dallas Trahern. Burke Badenhop and Mike Rabelo, two lesser pieces, rounded out the haul sent to South Florida. Maybin and Miller are both thriving in different places right now, but unfortunately, nothing the Marlins got in return for Miguel Cabrera ended up working out for them. However, at the time, to acquire two consensus top 10 overall prospects in all of baseball is not a bad coup at all. On the other hand, rumor has it the Dodgers were willing to trade prospects Matt Kemp and Clayton Kershaw for Cabrera. Yeesh.

  1. Johan Santana, 28 years old, controlled through 2008, $13.25 million (signed 6-year, $137.5 million extension immediately following trade)
  • February 2, 2008: Traded by the Minnesota Twins to the New York Mets for Carlos Gomez, Deolis Guerra, Philip Humber and Kevin Mulvey.

Arguably the best pitcher in the game at the time, Santana was traded to the Mets for the 35th and 52nd best prospect in the game in Guerra and Gomez. Humber was also ranked in the top 100 just a year ago, and Mulvey was a 23-year-old former second-round pick. This haul isn’t quite on par with the Marlins’ for Cabrera, but Gomez did blossom into a true superstar, which can’t be said for anyone that Florida received. Boston apparently had packages involving prospects Jacoby Ellsbury and Jon Lester on the table for Minnesota, but the fact that Johan needed a contract extension to be traded was not appealing for the Red Sox.

  1. Delmon Young, 22, controlled through 2012, PreArb – Arb3
  • November 28, 2007: Traded by the Tampa Bay Devil Rays with Brendan Harris and Jason Pridie to the Minnesota Twins for Eddie Morlan (minors), Jason Bartlett and Matt Garza.

For their former number one overall draft pick and two other rather significant pieces, the Rays received Garza, the 21st overall prospect the year before, Morlan, the 4th ranked prospect in the Minnesota system according to Kevin Goldstein, and Bartlett, a serviceable major league shortstop at the time. Not the best package in the world, especially considering Tampa also sent a solid major league SS in Harris the other way. However, the Rays would go on to win the AL Pennant less than a year later with Garza as the ALCS MVP.

  1. Erik Bedard, 28, controlled through 2009, Arb2 – Arb3
  • February 8, 2008: Traded by the Baltimore Orioles to the Seattle Mariners for Tony Butler (minors), Adam Jones, Kam Mickolio, George Sherrill and Chris Tillman.

One of the most infamous packages ever dealt for a star, this is one for the ages in both Seattle and Baltimore history. Future Orioles superstar Jones was the number 28 prospect on the 2007 Baseball America Top 100 list, and future ALCS Game 1 starter Tillman would be ranked third on Baseball America’s Top 10 rankings for the Mariners just weeks before the trade. Butler was highly ranked in the Mariners system before the 2007 season before falling off the list the next year, while Sherrill was a veteran reliever coming off his best year. For a pitcher who was coming off a 221-strikeout campaign but only had two years left on his contract, this seems like a massive haul almost disproportionate to the amount that the Rays got for Young.

  1. Dan Haren, 27, controlled through 2010, $16.25 million
  • December 14, 2007: Traded by the Oakland Athletics with Connor Robertson to the Arizona Diamondbacks for Brett Anderson, Chris Carter, Aaron Cunningham, Dana Eveland, Carlos Gonzalez and Greg Smith.

Dave only ranked 40 players in his 2007 list, but the last player who snuck on was worth the 22nd (future Colorado Rockies superstar Gonzalez) and 36th (Anderson) overall prospects, and the 7th and 8th prospect (Cunningham and Carter) in Arizona’s system. Sweeten this package with two more pieces in Smith and Eveland, and it looks like Oakland’s return was at least on par with Minnesota’s, if not even better. It seems here that Dave may have seriously underestimated the value that Haren’s cost-controlled years had in other teams’ eyes. On a sidenote, this Arizona system was absolutely loaded, with Jarrod Parker, Gerardo Parra, Max Scherzer, and Emilio Bonifacio also in the top 10 of that year’s list.

Interestingly, we have three top-10 rankings traded from the 2007 list, but no other player from here on out with a ranking higher than 17 got dealt. We could analyze these trades from hindsight, and hindsight would tell us Baltimore and Tampa Bay did extremely well in selling their trade chip, receiving valuable pieces that would propel them into the postseason down the line and in the case of the Rays, to an American League championship the very next season. But looking at the deals at the time, Young was perhaps ranked too well, as Tampa only received one elite prospect back while sending two pieces along with their young star. Haren on the other hand was definitely ranked too low, as he was able to return two top 50 talents.

I’ll be back with more deals for players ranked in Dave’s top 50.


Cole Hamels’ No-Hitter and Pitcher Game Scores in the Game Before Being Traded

With the trade deadline approaching (ed. note: so long!), we have players donning their current affiliation’s uniforms for a final game.  Aside from a few tears shed by baseball’s infantile devotees (ages 3 and up), these will be business-like transactions; it’s the buying and selling of goods.

For this article, we’ll be looking at pitcher performances in their final game before being traded.   The last game a pitcher pitches for a team is a relatively inconsequential event.  What I mean is that teams searching for that piece to propel their momentum in the efforts of a playoff push know what Cole Hamels is worth.  His value did not take a significant ding after two abysmal starts when he totaled 6.1 IP, 20 H, 14 ER, and 5 K (July 10th and 19th), and neither did it skyrocket after his performance on Saturday.  You know what happened, but let me recap: In his last outing for the Philadelphia Phillies, Hamels threw a no-hitter against the Cubs – the very team who he could have ended up with.  That’s probably already a better idea for an article – pitchers that were traded to the team they just faced – but I’ve started the research for the article I’m currently writing, an article that, much like my night, is, for lack of a better word, aimless.  My one year old son is asleep, my wife went to a birthday dinner, I’m in my underwear watching X-Men 2: X-Men United (for the umpteenth time), drinking Diet Hansen’s Tangerine Lime, and thinking about Hamels’ almost 100-point game score in what was his last game as a Phillie.

For the purpose of this article, but mainly to eventually get some sleep tonight, we’re going to limit the research to this current decade (2010 being the starting point), and for pitchers that went to teams that made the playoffs only.  Cole Hamels’ no-hitter scored a 98 on Bill James’ game score calculation, with the only two blemishes keeping it from being a nice even 100, being the two walks he issued over the 9 IP.  There have been two pitchers traded already, Scott Kazmir and Johnny Cueto, and they each posted game scores north of 70 (73 and 78 respectively).  The starting pitcher talent level that could swap hands this year is pretty special.  It’s hard to remember the last time there was a talent pool this deep or when there were this many teams in viable contention to make playoff pushes, so it’s no surprise that we’ve seen a couple of really, really well-pitched games.  But in terms of single-game performances, how good is a game score of even Kazmir’s 73 in the final game before a player gets swapped?  You’d have to go back to 2010 to find a game score as high as 70, which was what Cliff Lee scored for the Mariners after dominating the Tigers over 8 IP.  (Zack Greinke had a 72 before he was traded to the Angels in 2012, but they didn’t make the playoffs.)

Below you’ll find a table with players that were traded close to the deadline to teams that made the playoffs from 2010 – 2014.  Next to their name you’ll find the game score of their last game pitched with the team that traded them (organized by game score) compared to the average game scores they posted with the team that traded them and the team they were traded to.  It’s highly likely that, with so much going on tonight – X-Men just ended – I missed one or two or three starting pitchers.  ((Also spoiler alert (Not about X-Men which I’ve seen close to 100 times now): There are no correlations between that one game score and their value for the rest of the season because a pitcher is the pitcher they’ve been for the body of their work)).

(Game Score Equation courtesy of Bill James: 50 + (outs recorded) + (2*IP after 4th inning) + (1*K) – (2*H) – (4*ER) – (2*Unearned Runs) – (1*BB) = Game Score)

**GmScA = Game Score Average

Player Date/Opp Game Score GmScA Before Trade GmScA After Trade
Cliff Lee 07-04-10/DET 70 65.1 56.3
Ricky Nolasco 07-03-13/ATL 64 53.1 53.4
Paul Maholm 07-29-12/STL 63 52.6 55.1
Jason Hammel 07-04-14/WSH 59 59.6 49.9
Anibal Sanchez 07-22-12/PIT 59 53.5 51.7
Jon Lester 07-25-14/TBR 58 60.3 61.7
Jake Peavy 07-25-13/DET 57 53.8 54.0
Ryan Dempster 07-25-12/PIT 56 60.9 48.3
Doug Fister 07-26-11/NYY 56 55.3 64.0
Edwin Jackson 07-24-11/CLE 54 51.2 50.1
David Price 07-30-14/MIL 53 61.5 58.2
John Lackey 07-26-14/TBR 51 54.5 49.3
Jake Peavy 07-22-14/TOR 41 49.1 59.8
Jeff Samardzija 06-28-14/WSH 37 57.2 60.6
Roy Oswalt 07-24-10/CIN 27 57.6 66.3
Justin Masterson 07-07-14/NYY 22 45.5 40.2
Edinson Volquez 08-23-13/CHC 18 43.4 51.8
Joe Saunders 08-20-12/MIA 3 49.4 50.7
Average 47.2 54.6 54.5

I know that 18 games is a small sample size, but 47.2 is a pretty sizable drop from averages of 54.6 and 54.5.  Perhaps it’s the uncertainty that these players are facing with the looming trade deadline that causes a dip in performance, or perhaps this is a silly, SILLY thing to look into and it means absolutely nothing!!!

But back to this year’s impressive pool of starting pitchers that were rumored to be available.  Let’s say all the top pitchers that are thought to be moving have thrown their last game for their respective teams.  Here’s a look at a table just like the one above but for the pitchers thought to be moving this year.  (This is assuming the caveats that all the players have pitched their final game for their respective teams and that they will all be traded to or have been traded to teams that will make the playoffs).

Player (Traded to) Date/Opp Game Score GmScA before trade
Cole Hamels (Rangers) 07-25/CHC 98 55.3
Johnny Cueto (Royals) 07-25/COL 78 62.1
Mike Leake 07-28/STL 76 55.0
Scott Kazmir (Astros) 07-18/MIN 73 60.3
Jeff Samardzija 07-28/CWS 54 54.3
David Price 07-28/TBR 40 60.3
Mat Latos (Dodgers) 07-26/SDP 49 51.3
Average 66.9 56.9

That’s a lot of 70s.  There are also three pitchers in this group with average game scores of over 60, which is one more than the number of pitchers that went to playoff bound teams from 2010 – 2014.  After all this, I wish there was a way to make this post more interesting, or show some correlation between any of these numbers, but there’s simply not!  It was a thought and I ran with it.  One game does not make a player, but I think in some TINY way, it is another example of what we know to be true:  there is some serious talent that’s about to switch hands – get excited.


The Best Predictors of Second-Half ERA

I play a lot of fantasy baseball and am always looking for an edge. When scouting possible waiver and trade pitching targets, I normally compare players’ ERA with his FIP and xFIP in order to find pitchers underperforming their peripherals, and are thus undervalued. This is a very common process among fantasy owners. But, when are the peripherals not indicative of future performance? Take, for example, Clay Buchholz, who had a 3.26 ERA but a far better 2.62 FIP through 113.1 innings before the All-Star break. Classic buy low candidate (which I did, and he has a 2.02 ERA in 75.2 IP since I added him on May 15th). However, Steamer has him as a 3.76 ERA/3.54 FIP pitcher, with far different walk and strikeout numbers than those he is currently putting up.

What numbers do I trust? What is the best predictor of second half performance? To answer, I went back and pulled first and second half splits for pitchers from 2010-2014, and kept only those who had the qualifying innings pitched in both halves, leaving 349 pitcher seasons. This methodology was inspired in large part by Jeff Sullivan’s research on team records. I found ERA, FIP, and xFIP for each half, and a Steamer projection for the entire season. Using this data, I found what correlated most with second half ERA. The results are below:

  • 1st Half ERA, 2nd Half ERA: .212
  • 1st Half FIP, 2nd Half ERA: .254
  • 1st Half xFIP, 2nd Half ERA: .307
  • Projected ERA, 2nd Half ERA: .315

This is about what I expected. First and second half ERA had a correlation of .21. As we know, no matter how variable ERA can be, an entire half of ERA can still tell us something about future performance, but it is by no means the best.

FIP had a correlation of .25, while xFIP had one of .30. FIP was always thought of as a retrospective statistic, which is why it is used in the calculation of WAR for pitchers, while xFIP is better for predictions. Both of these statistics perform better than first half ERA, which is a good sanity check for advanced metrics in general: they better out perform basic statistics.

The preseason projection, denoted by ERAp, performs the best, with a correlation of .31. The fact that 3 years of prior data is still better than half a year of present data shouldn’t be surprising, but it sort of is. I went into this exercise thinking xFIP would be the best predictor of the second half, but the preseason projections perform better. This result suggests in season improvements on K% and BB% should be taken with a grain of salt and regressed.

We would expect that some combination of the preseason projection and the updated numbers would perform really well. Fortunately, Steamer is constantly updating their projections and release Rest-of-Season numbers daily. Unfortunately, accessing ROS projections from the All-Star break since 2010 is beyond my coding know-how, so those numbers are unavailable.

We can estimate what those updated ROS projections might look like with a linear regression model. Regressing xFIP1 and ERAp on ERA2 provides the best correlation of .35 (this is the square root of the adjusted R-squared number the model spits out).

It’s amazing just how little we can predict. Our best guess only can account for about 30% of the variation in second half ERA. That’s nothing. This stuff is still really hard to predict.  Half a season of data just isn’t enough to go off of. But these are just the public stats. I always wonder what kind of numbers front offices use, and how much better (if at all) they perform. From a fantasy perspective, if you use this methodology enough, you should end up better off than the alternative. When it comes down to it, the updated rest of season projections should be better than just a single season xFIP number.


The Risk of Long Contracts for Middle-Market Teams

Middle-market teams have historically tried to play the game like they are mini-large-market teams. They develop talent and when they have enough to make a run at the playoffs they make moves. They buy free agents, extend players through their age 27-33 years, and trade for proven talent. Unfortunately this usually does not work and we often see one of the top six most expensive teams (or the Cardinals) in the playoffs year after year. Then, the middle-market team’s “window” has closed, and the wait starts over.

It is time to have a change in the tradition of middle-market teams, and this includes the Texas Rangers.
The focus should not be on operating on a “window” of time where a World Series run is possible, but to create a team where there are very few years where this window is not open. The Cardinals are a good example of executing this plan. They rotate talent in and out due to a solid player-development system, while making very few large free-agent signings. This leads to a team where there is never too much money tied up to one or two players, and they can afford to make short-term deals or trades for players who add value to the team immediately without tying up long-term cash.

Let’s talk about how this relates to the Rangers though, specifically Elvis Andrus and his extension as this issue extends to all of the contracts the Rangers have given out. Most people look back and ask the wrong question as it was never about whether the Rangers thought Elvis was really going to be good for his contract. The Rangers obviously thought that he would be. The question the Rangers should have asked themselves is, should a middle-market team take a large risk by signing a player whose peak will probably be around age 26 to an eight-year extension, well past his peak? For a middle-market team, the contract is near impossible to avoid down the stretch if for some reason the player does not achieve the level of success that is expected.

Other situations, like Adrian Beltre, have worked. However, can you imagine a world where the Rangers spent all that money on Beltre, only to have him be awful? Of course you can, and it would have been miserable. The Rangers were fortunate that Beltre had a second peak at 31 that has lasted five years. Beltre is the exception, not the rule, and the Rangers should not expect to get lucky on a contract like his very often. It was a very high-risk offer that ended up working out. Unfortunately, we have the opposite side of the spectrum as well. Shin-Soo Choo was given a similar contract to Beltre, at a similar age. Unfortunately, this contract appears to be flat and the Rangers are already looking for a way to move Choo on.

The Rangers made a series of high-risk contract moves when they had players in the minors who were only a year or two away from being able to contribute on a major-league team, which led to a large amount of money being tied up. This is not to say that all long-term contracts are bad. If the Rangers were able to find a franchise player who brings extreme value consistently with a skill set that ages well, the risk would be worth the shot as long as a reasonable deal could be achieved.

The ultimate conclusion is that as a middle-market team, the Rangers should have a change in focus from spending money on long-term contracts, which are huge risks, to using money and trades to put together a solid supporting cast of players on shorter-length contracts. These players will support a group of younger cost-controlled players where their risk of failure is not tied to large amounts of cash. It is a superior strategy to hoping that during a window of opportunity, where long-term contract players are not past their prime, the team will make the playoffs a few times. If played correctly, with the Rangers’ amazing farm system and development team, the Rangers could have a consistently good team for long periods of time.


Statistical Rarities Potentially Abound in 2015

Last night, I was lying in bed with my arms crossed behind my head, staring at my ceiling, and thinking of what a fantastic season Paul Goldschmidt is having.  “He’s so locked in; I wonder how pitchers have pitched him differently over the course of this season; I bet he’s super cool; I bet we’d hit it off; I wonder what kind of dogs he likes”.   The sheets rustled and my wife turned over and asked, sleepily, “Who are you talking about?”  I looked for her face in the dark.  I was surprised that I had been saying that out loud, but I just whispered to her, “I wasn’t saying anything, you were dreaming”.  She turned over and I said quietly to myself – “Of course it’s Golden Retrievers”.

Goldy is 3 stolen bases away from a 20/20 season which is a rare feat for a first baseman.  Todd Frazier technically did do it last year, but he only started 43 games at 1B, so I would only count him as achieving it as a 3B.  For the remainder of this exercise I’m going to only use players who reached particular milestones while playing the primary position they’re listed for instead of what positions they were eligible for – I’ll apologize to Ben Zobrist in advance.

Let’s go around the diamond and find some completely arbitrary statistical rarities that may be reached this season!  Yay!  Pointless fun!!!

Catchers: A Catcher’s Triple Crown

Buster Posey is so good.  He currently ranks, among catchers, 2nd in HR (14), 1st in RBI (67), and 1st in AVG (.325).  As a side note, he’s also thrown out 48.4% of attempted runners this year and leads all catchers in WAR by a wide margin (4.3 compared to Vogt’s second place 3.0).  But those offensive numbers I listed are clearly the triple-crown categories, aren’t they?  That’s rhetorical.  He’s second in HR right now, trailing Brian McCann and Salvador Perez each by one HR.  Posey has finished second in HR among catchers in 2014 and 2012, and comes up 3rd overall during that span with 75, trailing only Carlos Santana (76) and Brian McCann (78).

We have to travel back in time to the turn of the century to find a catcher who actually posted numbers worthy of a triple-crown among catchers and you’ve probably already guessed that it was the fabulous, Mike Piazza.  He led all catchers in HR (38), RBI (113), and AVG (.324) in the year 2000; absolutely gaudy numbers for any position nowadays.  Think about it, when Miguel Cabrera won the triple-crown in 2012, amassing 44 bombs and 139 RBIs while hitting .330, Piazza’s performance in the NL would’ve put him 2nd overall in HR, 2nd overall in RBI, and 3rd overall in average.  In the year 2000, his numbers ranked 10th, 13th, and 10th, respectively – this point of dramatic difference in his rankings falls into the “different eras” conversation.  Of course this is only about offense, and Piazza is arguably the greatest offensive catcher of all time, but I have to throw in (no pun intended) that Piazza only succeeded in apprehending 22.5% of would be base stealers that year.  Ooph!

First Basemen: 20/20 Campaign

This was the catalyst for this article and I talked about it earlier.  Goldy should be able to get to 20/20 this year and it’s been over a decade since a 1B primary player achieved this elite mark.  A few players have come close, but the man who did it was Derrek Lee.  The year was 2003 and the big, Marlins’ first baseman smacked 31 HR and stole 21 bases.  I didn’t peg Goldschmidt for a 20/20 season this year and I still think that his speed will erode over the next couple seasons, but looking back at Lee, who is not technically a good comparison for Paul Goldschmidt, except that he too was 27 years old in 2003 and had the ability to swipe a bag, he averaged 13 SB over the next 2 years.  Goldy, you may have a few years left of some good wheels, you god…I mean dog.

*Anthony Rizzo may very well get to 20/20 this season, too.

Second Basemen: 150 wRC+

Did you know that Robinson Cano never achieved a wRC+ of 150 in his prime?  That was a kind of shocking revelation for me when I picked this number to single out.  He posted a 149 in 2012 and averaged 142 from 2010 – 2013, which is a shiny number, but it’s not what we’re looking for.  New member of the Kansas City Royals, Ben Zobrist achieved a wRC+ of 152 in 2009 for the Rays, but kind of like Frazier’s 20/20 season last year, Zobrist is ineligible to be considered here because he only accrued a 124 wRC+ as a second baseman in 2009, where he played just over half of his games.  So let’s keep looking.  The last true second baseman to achieve a 150wRC+ was Chase Utley in 2007.  Yeah, Utley was fantastic, and the conversations I have with myself about Goldschmidt are reminiscent of Mac’s conversations with himself about Chase Utley (Always Sunny In Philadelphia).  So who is hitting the mark this year?  It’s not Altuve if that’s what you were thinking.  In fact, this hitter was well below average in 2014, posting a wRC+ of 86.  But he’s increased his BB rate, cut down on Ks, matched his HR output in 32 less games, and has 10 more XBH this year compared to last.  He’s known for his 2nd half slumps, as he has a career 130 wRC+ before the break and a 96 after it, but if he can continue his torrid pace, Jason Kipnis would be the next second baseman to reach 150 wRC+ over a full season.

Third Basemen: Ranking 1st in OFF and DEF (per FanGraphs)

Josh Donaldson currently ranks 1st among 3rd Basemen with a 23.4 Off number and 2nd with a 9.3 Def number.  These numbers are rarely mentioned, but they’re still worth using as measurements since Off is batting and base running combined above average, and Def is Fielding and Positional Adjustment combined above average (again, per fangraphs).  In Defense, he only trails leather-wizard, Nolan Arenado’s 10.9 mark.  It’s not impossible for him to make up that ground this year and if he does, he’d be in some elite company.  Starting from the year 2000, Donaldson would join Troy Glaus (2000), Adrian Beltre (2004), and Evan Longoria (2011) as the only players in this century to lead 3rd basemen in both categories.

Shortstops: Playing in at least 160 G and accruing less than 1.0 WAR

This isn’t a list you want to find your name on, but there’s Marcus Semien, sitting at 0.4 WAR while having played in all but 1 of the Athletics’ games this season (100 out of 101).  Steamer has him projected to play 52 more games and accrue 0.6 more WAR which would give him 152 G and a WAR of 1.0, therefore making him ineligible for this list but let’s extrapolate that pace and say he does play in 160 games.  Semien started the season like a man on fire, swatting 6 HR and heisting 7 bags through the end of May to go along with a nice .283 AVG and a .770 OPS.  Of course his glove has been a cast iron skillet, absorbing some of that heat that he started with, and his offense has taken a nose dive as well.  Since the beginning of June, he’s hit 2 HR and stolen 2 bases (all of these stats came in July – so 0 HR and SB in June) and he’s hit a paltry .206 to go with a .550 OPS.

There are a few other cases of every day shortstops being as valuable (or as lacking in value) as Semien has been this year.  Most recently, in 2013 over 161 G, Starlin Castro was actually worth negative value, and logged a -0.1 WAR.  Orlando Cabrera’s name appears twice since the year 2000, posting a WAR of 0.7 in 2009 over 161 G, and a symmetric looking 0.0 WAR over 161 G in 2004.   The one other name on this list is Neifi Perez, who in 2000 was worth a whopping 0.3 WAR and played every single game for the Rockies.  While the Rockies have had more productive shortstops since then, they have had a tough time keeping one on the field for that many games (unless you span 3 seasons or so) – that was a really mean sentence.

Outfielders: 5 players 25 years or younger with 30 HR

The talent pool of young players in 2015 is well documented.  Mike Trout is Mike Trout and he already has eclipsed 30 HR.  Bryce Harper and Manny Machado are stepping up their games to join baseball’s elite.  Giancarlo Stanton is injured now, but should be a lock for 30 if he comes back this year.  And Joc Pederson has arrived in the bigs swinging some thunderous lumber.  Each of these players (using Steamer’s ROS projections) are on pace to hit 30 HR or more.

Player Age Current HR Pace (using Steamer)
Mike Trout 23 31 44
Bryce Harper 22 27 39
Giancarlo Stanton 25 27 36
Joc Pederson 23 21 31
Manny Machado 23 21 30


Going back to my arbitrary year cutoff, 2000, I can only find 2 other accounts of this phenomenon.

2012: (2 of the same players are on the 2015 list!!!)

Player Age HR
Giancarlo Stanton 22 37
Jay Bruce 25 34
Josh Reddick 25 32
Andrew McCutchen 25 31
Mike Trout 20 30


And the year 2000

Player Age HR
Vladimir Guerrero 25 44
Richard Hidalgo 25 44
Andruw Jones 23 36
Geoff Jenkins 25 34
Preston Wilson 25 31
Richie Sexson 25 30

Again, the year 2000 was a completely different era.

Starting Pitchers: K-BB% above 30%

This one is a little less likely, but the player in the hunt is Clayton Kershaw, so, yeah.  Kershaw led all of baseball last year with a 27.8 K-BB%.  He’s at it again this year, pushing the needle to 28.9%.  His SwStr% is trending up yet again and it’s up to 16.1%.  It’s gone up every year since 2012 when it was 11.1%.  You know I love tables, so here’s one for Kershaw

Year FB% SL + CB% SwStrk%
2010 71.6 26.6 10.1
2011 65.3 30.9 11.2
2012 62.0 34.3 11.1
2013 60.7 36.9 11.4
2014 55.4 43.7 14.2
2015 55.6 43.8 16.1

*Whatever percentage points are missing from his pitch usage in that chart are allocated to change-ups.  **I think the table is self explanatory and therefore, won’t waste any time explaining it.

Kershaw’s 27.8 K-BB% was the highest mark since Curt Schilling’s 27.9% in 2002.  If Kershaw can push it above 29% he’d leap over 2002 and he’d be the first pitcher since Randy Johnson in 2001 to be at 29% or higher.  Kershaw’s “rebounded” from his early season “struggles” with the long ball and has been as sharp as ever dating back to June 6th.  From the beginning of the season through his start on June 1st, his K-BB% sat at 24.8%.  Starting on June 6th and including his start on July 23rd, his K-BB% has been an absurd 33.9%.  If he can keep that up over his next 6 or 7 starts, depending on how many he has left, he could push that number to 30% and be the first pitcher since Pedro Freaking Martinez in 2000 to do so.  The insane thing about Pedro is that, in 2000, the league average K-BB% for starters was 6.7%; his was 30.8%, or 4.6 times the league average.  This particular category saw the leader’s rate drop every season until Cliff Lee led the category in 2010 with a 19.8 K-BB%.  Meanwhile the league’s starting pitcher average rate has gone up and is 12.2% this year.  Clayton currently sits at 2.4 times the league average, which is still phenomenal for a starting pitcher, but if you think about how inhuman he’s seemed over the course of the last couple of years, that just makes Pedro even more amazing, superlative, superlative, and superlative.

Relief Pitchers: AVG Velocity at 100 mph.

We’ll keep this one brief.  Pitch f/x data goes back to 2007 on FanGraphs, so that’s as far back as I can go, too.  Before 2011, Aroldis Chapman’s first full season in the pros, no one had averaged a 98 mph fastball before.  He did in 2011, and it sat at 98.1.  That number actually increased and kept increasing until it reached 100.2 mph in 2014.  That was his average fastball.  This year it’s a measly 99.5, but if anyone can do it, it would be the only man to do it.


Baseball is selfless in its ability to give us never-ending fun facts that the initiated will appreciate (I feel like there was some redundancy in that sentence).  This selflessness also serves as the primary reason why I’m sleep deprived and why my personal relationships are stunted.  So the next time your wife or husband or whoever, wakes up from their slumber to ask who you’re talking about, think of me, and if they’re statistically inclined, too, just say something like, “Oh hey, sorry to wake you, sweetie, it’s just that Paul Goldschmidt’s BB/K rate has been over 1 the last two months”, and then maybe, you two can lie awake and wonder about the wonders of Paul Goldschmidt’s approach at the plate this year.


Analyzing the Impact of Early At Bat Strikeouts on Overall Offensive Production

Long ago, the baseball deities descended upon our humble planet and created this wonderful game that we call baseball. When they did this, they created the strikeout. Striking out is arguably the most unproductive out in the game. Like many things, not all strikeouts are created equal. If a batter has a three-pitch strikeout, it is considered a miserable and wasted at-bat. But if a batter has an eight-pitch at-bat that was grinded out to a full count and then strikes out, it is consider a much better at-bat. The batter forced the pitcher to work harder and throw more pitches, even though the end result was a strikeout.

It would also make sense that an eight-pitch strikeout would give the hitter a much better understanding of the pitcher’s “stuff” and this could enhance his ability to hit the same pitcher in the next at-bat or down the road in a future game. In baseball stats, strikeouts are generally lumped into total strikeouts and K%. This brings the question of does it make more sense to lump all strikeouts together, or does it make more sense to look at them through the filter of when they occur in terms of the count? The purpose of my analysis today is to decipher if there is any kind of correlation between a player’s offensive production and the percentage of his strikeouts that occur early in an at-bat (0-2 or 1-2 counts) in the 2014 season. My theory is that as a hitter’s early at-bat strikeout % increases, his offensive production will decrease.

For my data points, I took the top 50 hitters in the 2014 season in terms of wRC+ and then calculated the number of strikeouts the each player had in either 0-2 or 1-2 counts (Early At Bat Strikeouts or EABK) and divided this number by the player’s plate appearances to create the EABK%. I then took the data points and looked for correlations in the basic slash line stats: Average/On Base Percentage/Slugging Percentage. I also looked for correlation in more advanced metrics like wRC+, wOBA, and OFF, which give a better overview of a player’s overall production.

The Slash Line Stat Analysis: (AVG/OBP/SLG)

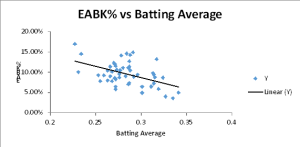
The first set of statistics I looked at were the basic stat line statistics and how they correlate to EABK%. The strongest correlation of the three was between batting average and EABK%. With a .47 correlation (1 being a perfect correlation), 22% of the data points fit the trend line which itself had a -.5 slope. So in terms of batting average, there was a strong inverse correlation to EABK%. As EABK% goes up, average tends to decrease.  The highest average was Jose Altuve who had a microscopic EABK% of 4.95%. There was only one .300 hitter in this group with an EABK% over 10% (Jose Abreu).

OBP had a similar, but not as strong, correlation. With a correlation of .38 and a trend line slope of -.46, it was clear that as EABK% increased, OBP decreased. SLG% saw virtually no correlation at all. I believe there was such a little correlation in this category because slugging percentage is strongly influenced by the number of total bases a player earns with each hit. Players like Mike Trout an Giancarlo Stanton have a large number of their hits go for extra bases and also have EABK% of the higher end of the spectrum (EABK% of 11% and 14%). Since they have a large number of XBH, this neutralized the negative effect of the early at bat strikeouts on their slugging percentage.

The most interesting correlation, or non-correlation, I found was that there was no correlation between EABK% and BB% (walk percentage). I would have thought there would be a clear downward trend in BB% as EABK% went up. If a hitter strikes out early, he never had the chance to walk, in contrast a hitter who work a deep count consistently is more likely to walk since it is much easier to walk deeper in counts. This none correlation could just be a product of the small sample size of only fifty players, a larger study could yield different results. Nonetheless, I thought it was interesting because if a batter strikes out out early in an at-bat, it would limit the chances he draws a walk. It appears that the trend did not support this thought process.


vs EABK%
Multiple R R Squared Slope
AVG. 0.47 0.22 -0.55
OB% 0.38 0.14 -0.46
SLG% 0.05 0.003 0.04
BB% 0.01 0.0001 0.0117
 

BA EABK

Overall Offensive Production Numbers (wOBA, wRC+, OFF)

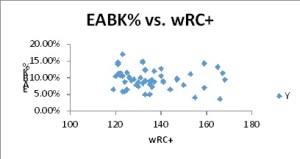
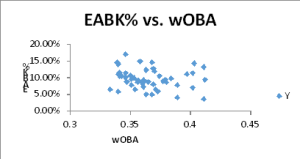
While it is interesting to see if there was a correlation between basic offensive stats like batting average, on base %, etc., I was most interested to find out if there was a correlation between overall offensive production stats like wOBA (weighted on base average), wRC+ (weighted runs created plus), and OFF (Offense). These metrics take much more into account rather than just the percentage of the time a batter gets a hit or gets on base. Here, I expected to see a slight correlation because I saw there was a strong correlation between OBP and average. What I did find though was nowhere near a slight correlation. The data analysis showed there was practically no correlation between any of these three metrics and EABK%. By looking at the analysis, the strongest correlation was wOBA and at .14 and while there was a slight downward sloping trend, for all practical purposes there was not a connection between EABK% and these advance offensive metrics,


vs EABK%
Multiple R R Squared Slope
wRC+ 0.12 0.015 -0.00027
wOBA 0.14 0.02 -0.19
OFF 0.08 0.006 -0.00021

wrc+wOBA

So what does it all mean?

To recap my analysis, let’s go back to the beginning. My original hypothesis was that for the 2014 season, the top 50 batters, as determined by wRC+, would have a drop in overall offensive production as the Early At Bat Strikeout % rose. Initially, by looking at basic slash line stats of batting average, On Base percentage, and Slugging %, I did see a correlation between a rise in EABK% and a drop in average and OB%, but slugging % did not show a correlation. When looking at overall offensive metrics, the correlation was not strong at all. I believe that since these metrics are based more on how many runs the player creates and incorporate different values for the type of hit contributes to the lack of correlation between EABK% and more advance offensive metrics. I do think EABK% could be a useful stat for analyzing players who are more valuable by getting on base. For example, comparing leadoff batters’ EABK% would be useful because it could help explain which leadoff hitters are more adept to work counts and the impact on the offensive production of a lineup as a whole.

Coming back to my original hypothesis, it was proved wrong by the data from the 2014 season. Perhaps looking at multiple seasons, with a larger sample size would provide a different conclusion. But using the 2014 season as a snapshot, there was not a strong correlation between offensive production and EABK%.


[1] All batting count statistics were taken from brooksbaseball.net and other statistics other than EABK and EABK% were taken from fangraphs.com


Introducing the ODIEs Projection System

Projecting baseball players has been a hobby of mine for the past 2 seasons. I would like to openly thank FanGraphs for the ease of accessing data to build a system for projections, as well as inspiration start this project from Tom Tango, Dan Syzmborski, Jared Cross (and team at Steamer) and all of the great researchers here at FanGraphs for pushing me to learn and try new things in creating a projection system.

The ODIEs (Oden Decision & Information Enhancement system) of projecting players is not all that dissimilar from Steamer and ZiPS found here at FanGraphs. My methodology for creating hitter and pitcher projections are as follows:

1. Weighted average of the last 3 years of player data depending on service time. Minor League Equivalencies are done for players with less than 3 years of service time.

2. Regressed stats based on league, park, and position type (C, 1B/3B, 2B/SS, OF, and SP/RP)

3. Adjusting for Age

4. Adjustments for Pitcher Velocity and Hitter Contact (Soft, Medium, & Hard)

5. Rest of Season Projections are weighted by Pre-Season and Actual stats for the 2015 season. I also readjust Rest of Season projections based on the criteria in point #4.

The major difference (that I can tell) in the ODIEs system to other successful systems is the incorporation of how stats are regressed and the adjustments for Velocity and Hitter Contact.

The files below will take you to the projections for both Hitters and Pitchers – here are some details to note:

1. There are three tabs for Pre-Season Projections, Rest of Season Projections (updated as of 7/23 games), and Total Projections using Real Data and Rest of Season Projections.

2. Each tab has a Criteria Search function that you can manipulate data in, the “Classification” column will change based on the results of your entries.

3. Fantasy Points, Points per game, PAR, and PAPAR values are all based on Ottoneu points scoring

I hope these projections are of use to anyone in Fantasy leagues, interested in player analysis, or anyone looking to push me to create the best projection system I can.

Link to Hitter Projections: https://www.dropbox.com/s/kyfr4i19nsn6hc4/ODIES_Shared_Hitters.xlsx?dl=0
Link to Pitcher Projections: https://www.dropbox.com/s/8t4ovkouir8f2sf/ODIES_Shared_Pitchers.xlsx?dl=0

Thanks, and I welcome and feedback or questions on this project.


A Quick and Dirty Attempt to Find Justin Upton’s Trade Value

Players like Justin Upton aren’t usually available at the trade deadline. Upton ranks 35th in wOBA (.353) and 47th in WAR (8.9) between 2013 to the present.  Also of note, Upton is in his walk year.

So, how many players like Justin Upton have been traded in the past 10 years? I did a quick scan of deals made in June and July since 2005 and I found four similar players who were traded in their walk years.

1. Hunter Pence PHI->SF, 2012 (68th wOBA (.347) and 68th WAR (8.7), 2010-2012)

2. Carlos Beltran NYM->SF, 2011 (19th wOBA (.379) and 74th WAR (8.1), 2009-2011)

3. Matt Holiday OAK->STL, 2009 (4th wOBA (.410) and 6th WAR (18.2), 2007-2009)

4. Mark Teixiera ATL -> LAA (15th wOBA (.396), 17th WAR (14.8), 2006-2008)

The Mets received Zack Wheeler in return for Beltran and the Athletics received Brett Wallace in return for Holliday. Baseball America ranked Wheeler the 55th best prospect pre-2011 and Wallace was ranked 40th pre-2009. In the following years, pre-2012 and pre-2010, respectively, Wheeler was ranked 35th and Wallace was ranked 27th.

The Mets and Athletics did well in each trade. They received top prospects and non-deteriorating prospects (they were not losing value as prospects during the year they were traded for). This is evidenced by the ranking of Wheeler and Wallace in the season following the trade.

The Pence and Teixiera trades did not net the Phillies or Braves prospects. Each team received a major league asset, using “asset” in the loosest of ways.

The Phillies received Nate Schierholtz, who had totaled .9 WAR up to that point in 2012. They also received Seth Rosin, an A Ball pitcher, and Tommy Joseph, a AA catcher. Essentially, they received a replacement level player and organizational depth. 

The Braves received Casey Kotchman. Kotchman had totaled 2.1 WAR in 2008 with the Angels before the trade. He managed 3.7 WAR the year before. The Braves could not expect Kotchman to live up to his past billing (he was Baseball America’s 6th ranked prospect pre-2005), however, from the most optimistic perspective, they may have expected him to be worth 2 WAR per year over the remaining four years of team control. At least this is my best attempt to get in the head of the Braves’ front office seven years after the fact.

Now, I’ll attempt to determine Justin Upton’s trade value based upon these past trades.

Kevin Creagh and Steve DiMiceli published a study on Point of Pittsburgh that analyzed the value and future performance of prospects based on their ranking in the Baseball America’s Top 100 (the ranking was determined by the final appearance of the prospect in the rankings).  The article has a lot of information you should read regarding the dollar value of prospects and their potential to bust, but for purposes of this article, I am concerned with a prospect’s projected WAR over the six years of team control.

Hitters that rank between #26-50, which is Brett Wallace, project to have an average of 6.8 WAR. Pitchers ranked between #51-75 project to have 3.8 WAR. However, based on Wheeler’s fast rise up Baseball America’s list, I’ll factor in that pitchers ranked between #26-50 project to have 6.3 WAR. The average of the two is 5 WAR, which is the value I’ll place on Wheeler at the time the Mets traded for him.

Justin Upton is not Matt Holliday, circa 2009, and he is not quite Carlos Beltran, circa 2011, although he is much less of an injury risk than 2011 Beltran (who would go on to spend time on the DL for the Giants in 2011). Therefore, I project that the Padres should receive between 3.8-5.0 WAR in return for Upton. The return should scale up towards the higher side of that projection based upon an active and interested market for Upton.

Below is a list of potential Upton suitors and their prospects that appeared in Baseball America’s Top-100 rankings before the season began. The rank of the prospect is in parenthesis, followed by their Creagh and DiMiceli projected WAR. The prospects in bold represent the most likely return for Upton, however I included some prospects that are possibilities, but project to have more WAR value than should be expected in return for Upton.

Mets – Brandon Nimmo (45, 6.3), Dilson Herrera (46, 6.3), Amed Rosario (98, 4.1). I excluded Kevin Plawecki (63) and Michael Conforto (80) due to their major league role and rise to prominence, respectively. 

Pirates – Jameson Taillon (29, 6.3); Austin Meadows (41, 6.8); Josh Bell (64, 5); Reese McGuire (97, 4.1)

Cubs – C. J. Edwards (38, 6.3); Billy McKinney (83, 4.1)

Giants – Andrew Susac (88, 4.1)

Orioles – Dylan Bundy (48, 6.3); Hunter Harvey (68, 3.4)

Rays – Daniel Robertson (66, 5); Willy Adames (84, 4.1)

Royals – Raul Mondesi (28, 6.8), Brandon Finnegan (55, 3.4), Kyle Zimmer (75, 3.4), Sean Manaea (81, 3.5)

Twins – Jose Berrios (36, 6.3); Nick Gordon (61, 5); Alex Meyer (62, 3.4)

Astros – Mark Appel (31, 6.3)

A.J. Preller should feel (somewhat) vindicated regarding the Justin Upton portion of his winter experiment if he can get a player he likes that resembles the players on this list. However, it remains to be seen if he will chase after something safer, like the Braves in 2008, or squander an asset like the Phillies in 2012. In that case, he’s probably better off going all-in on the Padres he built for 2015.