Analyzing the Impact of Early At Bat Strikeouts on Overall Offensive Production
Long ago, the baseball deities descended upon our humble planet and created this wonderful game that we call baseball. When they did this, they created the strikeout. Striking out is arguably the most unproductive out in the game. Like many things, not all strikeouts are created equal. If a batter has a three-pitch strikeout, it is considered a miserable and wasted at-bat. But if a batter has an eight-pitch at-bat that was grinded out to a full count and then strikes out, it is consider a much better at-bat. The batter forced the pitcher to work harder and throw more pitches, even though the end result was a strikeout.
It would also make sense that an eight-pitch strikeout would give the hitter a much better understanding of the pitcher’s “stuff” and this could enhance his ability to hit the same pitcher in the next at-bat or down the road in a future game. In baseball stats, strikeouts are generally lumped into total strikeouts and K%. This brings the question of does it make more sense to lump all strikeouts together, or does it make more sense to look at them through the filter of when they occur in terms of the count? The purpose of my analysis today is to decipher if there is any kind of correlation between a player’s offensive production and the percentage of his strikeouts that occur early in an at-bat (0-2 or 1-2 counts) in the 2014 season. My theory is that as a hitter’s early at-bat strikeout % increases, his offensive production will decrease.
For my data points, I took the top 50 hitters in the 2014 season in terms of wRC+ and then calculated the number of strikeouts the each player had in either 0-2 or 1-2 counts (Early At Bat Strikeouts or EABK) and divided this number by the player’s plate appearances to create the EABK%. I then took the data points and looked for correlations in the basic slash line stats: Average/On Base Percentage/Slugging Percentage. I also looked for correlation in more advanced metrics like wRC+, wOBA, and OFF, which give a better overview of a player’s overall production.
The Slash Line Stat Analysis: (AVG/OBP/SLG)
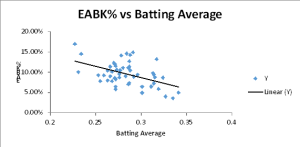
The first set of statistics I looked at were the basic stat line statistics and how they correlate to EABK%. The strongest correlation of the three was between batting average and EABK%. With a .47 correlation (1 being a perfect correlation), 22% of the data points fit the trend line which itself had a -.5 slope. So in terms of batting average, there was a strong inverse correlation to EABK%. As EABK% goes up, average tends to decrease. The highest average was Jose Altuve who had a microscopic EABK% of 4.95%. There was only one .300 hitter in this group with an EABK% over 10% (Jose Abreu).
OBP had a similar, but not as strong, correlation. With a correlation of .38 and a trend line slope of -.46, it was clear that as EABK% increased, OBP decreased. SLG% saw virtually no correlation at all. I believe there was such a little correlation in this category because slugging percentage is strongly influenced by the number of total bases a player earns with each hit. Players like Mike Trout an Giancarlo Stanton have a large number of their hits go for extra bases and also have EABK% of the higher end of the spectrum (EABK% of 11% and 14%). Since they have a large number of XBH, this neutralized the negative effect of the early at bat strikeouts on their slugging percentage.
The most interesting correlation, or non-correlation, I found was that there was no correlation between EABK% and BB% (walk percentage). I would have thought there would be a clear downward trend in BB% as EABK% went up. If a hitter strikes out early, he never had the chance to walk, in contrast a hitter who work a deep count consistently is more likely to walk since it is much easier to walk deeper in counts. This none correlation could just be a product of the small sample size of only fifty players, a larger study could yield different results. Nonetheless, I thought it was interesting because if a batter strikes out out early in an at-bat, it would limit the chances he draws a walk. It appears that the trend did not support this thought process.
| vs EABK% | ||||
| Multiple R | R Squared | Slope | ||
| AVG. | 0.47 | 0.22 | -0.55 | |
| OB% | 0.38 | 0.14 | -0.46 | |
| SLG% | 0.05 | 0.003 | 0.04 | |
| BB% | 0.01 | 0.0001 | 0.0117 | |
Overall Offensive Production Numbers (wOBA, wRC+, OFF)
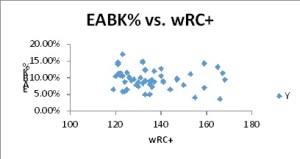
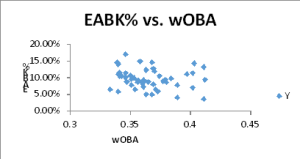
While it is interesting to see if there was a correlation between basic offensive stats like batting average, on base %, etc., I was most interested to find out if there was a correlation between overall offensive production stats like wOBA (weighted on base average), wRC+ (weighted runs created plus), and OFF (Offense). These metrics take much more into account rather than just the percentage of the time a batter gets a hit or gets on base. Here, I expected to see a slight correlation because I saw there was a strong correlation between OBP and average. What I did find though was nowhere near a slight correlation. The data analysis showed there was practically no correlation between any of these three metrics and EABK%. By looking at the analysis, the strongest correlation was wOBA and at .14 and while there was a slight downward sloping trend, for all practical purposes there was not a connection between EABK% and these advance offensive metrics,
| vs EABK% | |||
| Multiple R | R Squared | Slope | |
| wRC+ | 0.12 | 0.015 | -0.00027 |
| wOBA | 0.14 | 0.02 | -0.19 |
| OFF | 0.08 | 0.006 | -0.00021 |
So what does it all mean?
To recap my analysis, let’s go back to the beginning. My original hypothesis was that for the 2014 season, the top 50 batters, as determined by wRC+, would have a drop in overall offensive production as the Early At Bat Strikeout % rose. Initially, by looking at basic slash line stats of batting average, On Base percentage, and Slugging %, I did see a correlation between a rise in EABK% and a drop in average and OB%, but slugging % did not show a correlation. When looking at overall offensive metrics, the correlation was not strong at all. I believe that since these metrics are based more on how many runs the player creates and incorporate different values for the type of hit contributes to the lack of correlation between EABK% and more advance offensive metrics. I do think EABK% could be a useful stat for analyzing players who are more valuable by getting on base. For example, comparing leadoff batters’ EABK% would be useful because it could help explain which leadoff hitters are more adept to work counts and the impact on the offensive production of a lineup as a whole.
Coming back to my original hypothesis, it was proved wrong by the data from the 2014 season. Perhaps looking at multiple seasons, with a larger sample size would provide a different conclusion. But using the 2014 season as a snapshot, there was not a strong correlation between offensive production and EABK%.
[1] All batting count statistics were taken from brooksbaseball.net and other statistics other than EABK and EABK% were taken from fangraphs.com
Westminster College, Class of 2016, Division 3 Third baseman


What a great question to dig into. I think your exactly right about how an early count strikeout is viewed. From my limited playing experience, the early strikeout had a big impact to my confidence.
I was very surprised at the results. I gotta believe the sample selected influenced the correlation with the advanced metrics. There are multiple ways to become a top 50 wRC+ guy and all the players in the sample have found ways to be highly productive. I hope that you dig further into this question.
Thanks for the comments, like you said I definitely think the sample size had a influence on the results. When I dive a little deeper into this analyses I think using a different offensive metric that just looks at batter performance will create different results
One thing this made me think of was something of a regression, where the number of pitches and the result of an earlier at bat affect the outcome of a future at bat.
A possible reason for the lack of correlation between the EABK% and BB% could be the frequency that hitters put a ball into play early in the count. Hitters who frequently put the ball into play early in the count would see a reduction in both their EABK% and their BB% (this sounds a lot like Altuve’s profile, for example).