Oswaldo Arcia: Dynasty League Steal

Dynasty leagues test the deepest mettle of a fantasy baseball owner. Most good dynasty leagues have a lot of strong owners who have a pretty good view of ballplayers. The key to being a successful dynasty owner is to find players who are undervalued by others. If you can add players to your roster at a relatively cheap cost who have positive net returns for you, you are ahead of everyone else who was unwilling to roster that player.

The American League Central has many up-and-coming, talented players with names like Lindor, Buxton, Kepler, Rodon, Sano, and more. However, one player whose stardust has worn off is Oswaldo Arcia. This stocky Twins outfielder is still only 24 years of age, but with lots of youth coming up in Minnesota he has been surpassed in GM Terry Ryan’s eyes. This does not mean that you, as a dynasty league GM, should be overlooking him. Arcia’s calling card has always been his power, coming from a smooth lefty swing and a strong lower half. 2013 saw him hit 14 homers in a debut effort with the Twins, and 2014 saw 20 more homers at the big-league level. It was not to be in 2015, however, as he struggled mightily with injuries and strikeouts. Strikeouts will be an issue for most power hitters, and Arcia is no exception. However, it is tantalizing power that should draw you as a dynasty owner in. There are two scenarios here: One, Arcia is owned by an owner disgusted by his recent performance and selling low, or two, he is available on the waiver wire. Either way, he is a guy to go get right away, and with a further look, it should be obvious why you need to go out and acquire him.

The Twins have a crowded outfield; they had a crowded outfield last year, and it is not getting any better with Max Kepler coming into the picture. DH is going to be held down with some combination of Miguel Sano and Joe Mauer, and Arcia is going to have to have a monster spring to find playing time. Weird, I’m telling you to go get him, yet I’m telling you that he won’t play?? Think about it: This is an opportunity to buy dirt-cheap low on a player. There were reports out of Rochester, the Twins’ AAA affiliate, of him hitting 450 foot homers. I saw one of them myself. The talent is certainly there.

At this point, I should warn that some wonder about an attitude problem. This can be chalked up to early big-league success followed by struggles. All this kid needs is a change of scenery. He plays an only slightly below-average left field, although he is more comfortable in right, and has an accurate throwing arm from the outfield. His defense isn’t bad enough to keep him out of lineups, and even if it becomes so, he can still DH. A trade to any other team in the American League would give this powerful 24-year-old a chance at reaching his potential. He has been in the Twins organization since he was 16. He was a top-100 prospect prior to 2013 according to BA, BP, and MLB.com. He has been around so long that his younger brother Orlando, a shortstop prospect for the Brewers, has taken the entire spotlight. Don’t let the younger bro overshadow the older — Oswaldo is a power bat who can hit 30 homers in a season given 145 games. He will have to sit against the toughest lefties, the Chris Sales of the world, but what lefty finds guys like that easy? It is a tremendous buy-low opportunity for any dynasty team looking for upside; it is not often you find a guy with 70+ raw power that has shown it in games just lying around on the cheap. Go get him now, and you won’t regret it!


Hardball Retrospective – The “Original” 1939 New York Yankees

In “Hardball Retrospective: Evaluating Scouting and Development Outcomes for the Modern-Era Franchises”, I placed every ballplayer in the modern era (from 1901-present) on their original team. Consequently, Giancarlo Stanton is listed on the Marlins roster for the duration of his career while the Mets declare Ken Singleton and the Expos / Nationals claim Tim Raines. I calculated revised standings for every season based entirely on the performance of each team’s “original” players. I discuss every team’s “original” players and seasons at length along with organizational performance with respect to the Amateur Draft (or First-Year Player Draft), amateur free agent signings and other methods of player acquisition.  Season standings, WAR and Win Shares totals for the “original” teams are compared against the “actual” team results to assess each franchise’s scouting, development and general management skills.

Expanding on my research for the book, the following series of articles will reveal the finest single-season rosters for every Major League organization based on overall rankings in OWAR and OWS along with the general managers and scouting directors that constructed the teams. “Hardball Retrospective” is available in digital format on Amazon, Barnes and Noble, GooglePlay, iTunes and KoboBooks. The paperback edition is available on Amazon, Barnes and Noble and CreateSpace. Supplemental Statistics, Charts and Graphs along with a discussion forum are offered at TuataraSoftware.com.

Don Daglow (Intellivision World Series Major League Baseball, Earl Weaver Baseball, Tony LaRussa Baseball) contributed the foreword for Hardball Retrospective. The foreword and preview of my book are accessible here.

Terminology

OWAR – Wins Above Replacement for players on “original” teams

OWS – Win Shares for players on “original” teams

OPW% – Pythagorean Won-Loss record for the “original” teams

Assessment

The 1939 New York Yankees          OWAR: 60.8     OWS: 345     OPW%: .607

Based on the revised standings the “Original” 1939 Yankees registered 94 victories and outlasted the Indians to secure the pennant by a 7-game margin. New York paced the American League in OWS and OWAR. GM Ed Barrow acquired all of the ballplayers on the 1939 Yankees roster.

“Joltin’” Joe DiMaggio claimed his first batting title and the 1939 American League MVP Award. “The Yankee Clipper” produced a .381 BA with 30 four-baggers, 126 ribbies and 108 runs scored. Red Rolfe (.329/14/80) topped the leader boards with 213 safeties, 139 aces and 46 two-base knocks. Fellow third-sacker Billy Werber registered 115 runs scored and drilled 35 doubles. Bill Dickey belted 24 round-trippers and tallied 105 RBI along with a .302 BA. George “Twinkletoes” Selkirk (.306/21/101) posted career-bests in homers, runs scored (103) and bases on balls (103). Joe Gordon smashed 28 long balls and drove in 111 baserunners during his sophomore season. Charlie “King Kong” Keller supplied a .334 BA in his inaugural campaign.

Lou Gehrig is listed as the top ballplayer in the All-Time First Baseman rankings according to Bill James in “The New Bill James Historical Baseball Abstract.” Teammates listed in the “NBJHBA” top 100 rankings include DiMaggio (5th-CF), Dickey (7th-C), Gordon (16th-2B), Keller (17th-LF), Tony Lazzeri (19th-2B), Dixie Walker (30th-RF), Rolfe (44th-3B), Ben Chapman (55th-CF), Frankie Crosetti (67th-SS), Lefty Gomez (67th-P), Werber (78th-3B) and Lyn Lary (80th-SS).

LINEUP POS WAR WS
Red Rolfe 3B 6.59 29.64
Joe Gordon 2B 7.1 24.83
Joe DiMaggio CF 8.71 34.04
Bill Dickey C 5.82 27.2
George Selkirk LF 5.58 25.02
Charlie Keller RF 5.49 21.47
George McQuinn 1B 3.11 18.15
Frankie Crosetti SS 1.58 16.52
BENCH POS WAR WS
Billy Werber 3B 5.15 25.15
Pinky May 3B 2.51 12.54
Buddy Hassett 1B 1.91 13.83
Ben Chapman CF 1.23 18.88
Willard Hershberger C 1.09 6.93
Dixie Walker LF 0.99 10.84
Tony Lazzeri 2B 0.7 3.94
Joe Glenn C 0.6 5.05
Buddy Rosar C 0.35 3.4
Ernie Koy LF 0.31 13.53
Les Powers 1B 0.09 1.67
Arndt Jorgens C 0.01 0.02
Chris Hartje C 0 0.23
Joe Gallagher RF -0.01 5.64
Len Gabrielson 1B -0.06 0.07
Lyn Lary SS -0.08 2.55
Leo Durocher SS -0.29 10.99
Lou Gehrig 1B -0.4 0.08
Don Heffner SS -0.77 4.2
Myril Hoag RF -1.23 6.73

Lefty Gomez (12-8, 3.41) earned his seventh All-Star nomination. Atley Donald furnished a 13-3 mark with a 3.71 ERA. Marius Russo contributed an 8-3 record with a 2.41 ERA and a 1.095 WHIP in his freshman year.

ROTATION POS WAR WS
Lefty Gomez SP 3.34 14.06
Marius Russo SP 3.16 11.54
Johnny Allen SP 1.69 9.48
Atley Donald SP 1.54 10.46
BULLPEN POS WAR WS
Vito Tamulis SP 1.21 8.9
Hank Johnson RP 0.48 2.88
Spud Chandler RP 0.32 2.32
Jim Tobin SP 0.26 6.64
Marv Breuer RP -0.06 0
Johnny Murphy RP -0.07 6.51
Russ Van Atta SP -0.4 0
Johnny Niggeling SP -0.8 0.1
Johnny Broaca RP -1.07 1.26


The “Original” 1939 New York Yankees roster

NAME POS WAR WS General Manager Scouting Director
Joe DiMaggio CF 8.71 34.04 Ed Barrow
Joe Gordon 2B 7.1 24.83 Ed Barrow
Red Rolfe 3B 6.59 29.64 Ed Barrow
Bill Dickey C 5.82 27.2 Ed Barrow
George Selkirk LF 5.58 25.02 Ed Barrow
Charlie Keller RF 5.49 21.47 Ed Barrow
Billy Werber 3B 5.15 25.15 Ed Barrow
Lefty Gomez SP 3.34 14.06 Ed Barrow
Marius Russo SP 3.16 11.54 Ed Barrow
George McQuinn 1B 3.11 18.15 Ed Barrow
Pinky May 3B 2.51 12.54 Ed Barrow
Buddy Hassett 1B 1.91 13.83 Ed Barrow
Johnny Allen SP 1.69 9.48 Ed Barrow
Frankie Crosetti SS 1.58 16.52 Ed Barrow
Atley Donald SP 1.54 10.46 Ed Barrow
Ben Chapman CF 1.23 18.88 Ed Barrow
Vito Tamulis SP 1.21 8.9 Ed Barrow
Willard Hershberger C 1.09 6.93 Ed Barrow
Dixie Walker LF 0.99 10.84 Ed Barrow
Tony Lazzeri 2B 0.7 3.94 Ed Barrow
Joe Glenn C 0.6 5.05 Ed Barrow
Hank Johnson RP 0.48 2.88 Ed Barrow
Buddy Rosar C 0.35 3.4 Ed Barrow
Spud Chandler RP 0.32 2.32 Ed Barrow
Ernie Koy LF 0.31 13.53 Ed Barrow
Jim Tobin SP 0.26 6.64 Ed Barrow
Les Powers 1B 0.09 1.67 Ed Barrow
Arndt Jorgens C 0.01 0.02 Ed Barrow
Chris Hartje C 0 0.23 Ed Barrow
Joe Gallagher RF -0.01 5.64 Ed Barrow
Len Gabrielson 1B -0.06 0.07 Ed Barrow
Marv Breuer RP -0.06 0 Ed Barrow
Johnny Murphy RP -0.07 6.51 Ed Barrow
Lyn Lary SS -0.08 2.55 Ed Barrow
Leo Durocher SS -0.29 10.99 Ed Barrow
Lou Gehrig 1B -0.4 0.08 Ed Barrow
Russ Van Atta SP -0.4 0 Ed Barrow
Don Heffner SS -0.77 4.2 Ed Barrow
Johnny Niggeling SP -0.8 0.1 Ed Barrow
Johnny Broaca RP -1.07 1.26 Ed Barrow
Myril Hoag RF -1.23 6.73 Ed Barrow


Honorable Mention

The “Original” 1932 Yankees            OWAR: 52.6     OWS: 336     OPW%: .588

The Philadelphia Athletics ended the season in a virtual tie with the Bronx Bombers. The A’s edged the Yankees by a few percentage points to take the pennant while New York led the Junior Circuit in OWAR and OWS. Lou Gehrig pummeled opposition hurlers, belting 42 doubles and 34 round-trippers. “The Iron Horse” registered 138 tallies, 208 base knocks and 151 ribbies along with a .349 BA. Lefty O’Doul (.368/21/90) collected his second batting title and topped the 200-hit mark for the third time in four campaigns. Tony “Poosh ‘Em Up” Lazzeri supplied a .300 BA with 15 dingers and 113 RBI. Earle Combs aka “The Kentucky Colonel” scored 143 runs and posted a .321 BA as the Yankees’ primary leadoff hitter. Ben Chapman rapped 41 doubles, swiped a League-leading 38 bases and topped the century mark in runs scored (101) and RBI (107).  Bill Dickey (.310/15/84) and Kiddo Davis (.309/5/57) bolstered the prolific lineup. Lefty Gomez (24-7, 4.21) anchored the starting rotation and finished fifth in the 1932 A.L. MVP balloting in spite of his high ERA and walk totals. Johnny Allen fashioned a 17-4 record with a 3.70 ERA in his rookie year.

On Deck

The “Original” 1906 Cubs

References and Resources

Baseball America – Executive Database

Baseball-Reference

James, Bill. The New Bill James Historical Baseball Abstract. New York, NY.: The Free Press, 2001. Print.

James, Bill, with Jim Henzler. Win Shares. Morton Grove, Ill.: STATS, 2002. Print.

Retrosheet – Transactions Database

Seamheads – Baseball Gauge

Sean Lahman Baseball Archive


Five Reasons the Indians Will Win the AL Central

Last year, many Indians fans anguished over the so-called “SI Cover” curse. The prediction that the Cleveland Indians would win the 2015 World Series, however, was not their downfall. The downfall of the Indians once again was highlighted by mediocre offense, and the unfortunate decline of their biggest free-agent acquisitions in over a decade, Nick Swisher and Michael Bourn. Swisher and Bourn ate up over 1/4 of the Indians’ total payroll and their sedentary production was an absolute killer in their lineup. Things improved offensively with the promotion of Rookie of the Year runner-up and budding star shortstop Francisco Lindor. Lindor produced way above what was expected of him and figures to be a key piece of the puzzle in 2016. Also the trading of both Bourn and Swisher to the Atlanta Braves was the equivalent of a one-thousand pound anchor being lifted from the Tribe’s lineup. Ultimately, the Tribe finished with a respectable, yet disappointing (based upon previous predictions) 81-80 record. However, there are five key things that will be the difference-makers in 2016 and will lead the Tribe to winning their first AL Central title since 2007.


  1. Corey Kluber, Carlos Carrasco and Danny Salazar – The top of the Tribe rotation is arguably the best in all of baseball. According to early projections, the trio all look to post ERAs under 3.35, have more than 200 strikeouts each, and have no more than 50 walks each. Respectively, they project to have WARs of 6.0, 5.8, and 3.5. No top of the rotation in all of baseball projects higher. Carrasco and Kluber each should easily contend for an AL Cy Young Award, and Salazar looks to break through in a big way as well.
  2. Terry Francona – Since Francona took over the Tribe they haven’t had a losing season. He’s compiled an overall record of 258-229 since 2013 and, of course, had a very storied career in Boston, winning two World Series in his tenure there. Francona is arguably the best manager in baseball, and would love nothing more than to add another World Series title to his name. He’s worked particularly well with the Tribe’s young roster and was reported to be a key reason behind the front office not moving one of their top-of-the-rotation starters for a bat. With a strong rotation and bullpen to work with (the Tribe had the Majors’ 4th-lowest bullpen ERA at 3.12 last season), Francona’s biggest task lies with getting his lineup in a situation to produce as many runs as possible to support their outstanding pitching. Luckily for him they’re most likely not going to have to score that much.
  3. The Middle Infielders – Both Francisco Lindor and Jason Kipnis are among the very best in the league at their positions. They hit 1 and 2 in the Tribe lineup, and they also will be quite possibly the biggest factors to helping the Indians win several games in 2016. Both infielders were top 2 in WAR at their position last season (Kipnis 5.2, 1st in MLB at 2B, Lindor 4.6, 2nd in MLB at SS). Both infielders also were 2nd at their position in both BABIP and wOBA (minimum 400 PA). On top of all this, both players are plus defenders, and remind some fans of the dynamic duo of Omar Vizquel and Carlos Baerga that dominated the middle of the field throughout the 90s for the Tribe.
  4. A Healthy Yan Gomes – Okay, so Yan Gomes was pretty bad last year…his lack of production no doubt had a big effect on the Indians lineup, and not in a good way. Gomes had a miserable slash line of .231/.267/.391 and hit only 12 homers. In 2014 we all saw a very different Yan Gomes, as he had a respectable slash line of .278/.313/.472 along with 21 homers. He led all AL catchers in WAR (4.5) and Slugging percentage (.472) (minimum 400 PA). With Gomes returning to full health now in 2016 he should return to form and be a big producer in the middle of the Tribe lineup.
  5. Michael Brantley – Losing Brantley for the first month of the season is really going to hamper the Tribe, but if he can return to full health, you’d be hard-pressed to find a more productive player in all of baseball. Brantley is the Tribe’s X-factor; over the last two seasons he has hit 35 homers and 90 doubles, he’s had batting averages of .327 and .310 respectively, and he’s had OPS’s of .890 and .859 respectively. Most impressively has been his ability to hit with runners in scoring position — over the last two seasons combined he’s owned a .351/.437/.507 slash line. When healthy, the hope is that he can return to this form once again. Brantley proved resilient last season, putting up big numbers despite dealing with back issues throughout his 2015 campaign.

So there it is, the keys to the Tribe winning a 2016 division title. Obviously on top of all this, several other things need to go right for the Tribe. But these five factors alone will be among the leading reasons why the Indians win their division.


All stats referenced, or used for statistical analysis for this article are courtesy of mlb.com, baseball-reference.com, and fangraphs.com.


When Slugging Percentage Beats On-Base Percentage

What’s the single most important offensive statistic? I imagine most of us who have bookmarked FanGraphs would not say batting average or RBIs. A lot of us would name wOBA or wRC+. But neither of those are the types of things you can calculate in your head. If I go to a game, and a batter goes 1-for-4 with a double and a walk, I know that he batted .250 with a .400 on-base percentage and a .500 slugging percentage. I can do that in my head.

So of the easily calculated numbers — the ones you might see on a TV broadcast, or on your local Jumbotron — what’s the best? I’d guess that if you polled a bunch of knowledgeable fans, on-base percentage would get a plurality of the votes. There’d be some support for OPS too, I imagine, though OPS is on the brink of can’t-do-it-in-your-head. Slugging percentage would be in the mix, too. Batting average would be pretty far down the list.

I think there are two reasons for on-base percentage’s popularity. First, of course, is Moneyball. Michael Lewis demonstrated how there was a market inefficiency in valuing players with good on-base skills in 2002. The second reason is that it makes intuitive sense. You got on base, you mess with the pitcher’s windup and the fielders’ alignment, and good things can happen, scoring-wise.

To check, I looked at every team from 1914 through 2015 — the entire Retrosheet era, encompassing 2,198 team-seasons. I calculated the correlation coefficient between a team’s on-base percentage and its runs per game. And, it turns out, it’s pretty high — 0.890. That means, roughly, that you can explain nearly 80% of a team’s scoring by looking at its on-base percentage. Slugging percentage is close behind, at 0.867. Batting average, unsurprisingly, is worse (0.812), while OPS, also unsurprisingly, is better (0.944).

But that difference doesn’t mean that OBP>SLG is an iron rule. Take 2015, for example. The correlation coefficient between on-base percentage and runs per game for the 30 teams last year was just 0.644, compared to 0.875 for slugging percentage. Slugging won in 2014 too, 0.857-0.797. And 2013, 0.896-0.894. And 2012, and 2011, and 2010, and 2009, and every single year starting in the Moneyball season of 2002. Slugging percentage, not on-base percentage, is on a 14-year run as the best predictor of offense.

And it turns out that the choice of endpoints matter. On-base percentage has a higher correlation coefficient to scoring than slugging percentage for the period 1914-2015. But slugging percentage explains scoring better in the period 1939-2015 and every subsequent span ending in the present. Slugging percentage, not on-base percentage, is most closely linked to run scoring in modern baseball.

Let me show that graphically. I calculated the correlation coefficient between slugging percentage and scoring, minus the correlation coefficient between on-base percentage and scoring. A positive number means that slugging percentage did a better job of explaining scoring, and a negative number means that on-base percentage did better. I looked at three-year periods (to smooth out the data) from 1914 to 2015, so on the graph below, the label 1916 represents the years 1914-1916.

A few obvious observations:

  • The Deadball years were extreme outliers. There were dilution-of-talent issues through 1915, when the Federal League operated. World War I shortened the season in 1918 and 1919. And nobody hit home runs back then. The Giants led the majors with 39 home runs in 1917. Three Blue Jays matched or beat that number last year.
  • Since World War II, slugging percentage has been, pretty clearly, the more important driver of offense. Beginning with 1946-1948, there have been 68 three-year spans, and in only 19 of them (28%) did on-base percentage do a better job of explaining run scoring than slugging percentage.
  • The one notable exception: the years 1995-1997 through 2000-2002, during which on-base percentage ruled. Ol’ Billy Beane, he knew what he was doing. (You probably already knew that.)

This raises two obvious questions. The first one is: Why? The graph isn’t random; there are somewhat distinct periods during which either on-base percentage or slugging percentage is better correlated to scoring. What’s going on in those periods?

To try to answer that question, I ran another set of correlations, comparing the slugging percentage minus on-base percentage correlations to various per-game measures: runs, hits, home runs, doubles, triples, etc. Nothing really correlates all that well. I tossed out the four clear outliers on the left side of the graph (1914-16, 1915-17, 1916-18, 1917-19), and the best correlations I got were still less than 0.40. Here’s runs per game, with a correlation coefficient of -0.35. The negative number means that the more runs scored per game, the more on-base percentage, rather than slugging percentage, correlates to scoring.

That makes intuitive sense, in a way. When there are a lot runs being scored — the 1930s, the Steroid Era — all you need to do is get guys on base, because the batters behind them stand a good chance of driving them in. When runs are harder to come by — Deadball II, or the current game — it’s harder to bring around a runner to score without the longball. Again, this isn’t a really strong relationship, but you can kind of see it.

The second question is, what does this mean? Well, I suppose we shouldn’t look at on-base percentage in a vacuum, because OBP alone isn’t the best descriptor of scoring. A player with good on-base skills but limited power works at the top or bottom of a lineup, but if you want to score runs in today’s game, you need guys who can slug.

Taking that a step further, if Beane exploited a market inefficiency in on-base percentage at the beginning of the century, might there be a market inefficiency in slugging percentage today? It doesn’t seem that way. First, there’s obviously an overlap between slugging percentage and on-base percentage (i.e., hits), and just hitting the ball hard on contact doesn’t fill the bill if you don’t make enough contact. Recall the correlation coefficient between run-scoring and on-base percentage is 0.89 and between runs and slugging is 0.87. The correlation between run-scoring and pure power, as measured by isolated slugging, is just 0.66. That’s considerably lower than batting average (0.81). ISO alone doesn’t drive scoring.

The second reason there probably isn’t a market inefficiency in slugging percentage is that inefficiencies, by definition, assume that the market as a whole is missing something. In the Moneyball example, other clubs didn’t see the value in Scott Hatteberg and his ilk. It’s harder to believe, fifteen years later, with teams employing directors of baseball systems development and posting for quantitative analysts, that all 30 teams are missing the boat on players who slug but don’t contribute a lot otherwise. Or, put another way, there’s a reason Pedro Alvarez and Chris Carter were non-tendered, and it’s not market inefficiency.


Justin Upton: A Potential Value Trap for the Tigers

Justin Upton’s recent $132.75M/6-year contract with the Tigers does not seem, on the surface, like an outrageous contract. And right now it isn’t; at age 28, Justin should be hitting his prime. Since breaking in with the Diamondbacks, he has been a consistent power threat in a league where consistent power bats are few and far between. To pay $22 million for an outfielder that the Tigers control for two years, potentially six years (Upton has an opt-out clause after two seasons), does not sound extreme when you consider other contracts signed by young, dynamic outfielders; in fact the contract came in below MLB Trade Rumors’ projection of a 7-year/$147 million deal[1]. So why anyone would be concerned about Justin Upton’s deal? Maybe it’s the fact that it took a while for his market to develop this offseason, or maybe it is because he shares the same bloodline as Melvin (formerly known as B.J.) Upton whose production went in the tank after his age-28 season? I get the feeling that Justin could end up as a bad investment for the Tigers. Here’s why.

Exit Speed and Park Factors

Fortunately for Justin, he is getting out of the notorious pitcher’s kingdom that is Petco Park. Unfortunately for Justin, he is moving to another pitcher’s park, Comerica Park. Poor guy can’t catch a break. One concern that I noticed about Upton’s metrics was his exit speed on home runs. According to the ESPN Home Run Tracker, Upton had an average home-run exit speed of 105.2 mph. The concern here lies when you compare the average exit speed versus his prior years. Take a look at the chart below which compares his FB/HR%, HR totals, and average home-run exit speed.

Year HR HR/FB% Exit Speed
2011 31 14.8 107.3
2012 17 11.0 107.2
2013 27 17.9 106.8
2014 29 17.9 105.5
2015 26 15.2 105.2

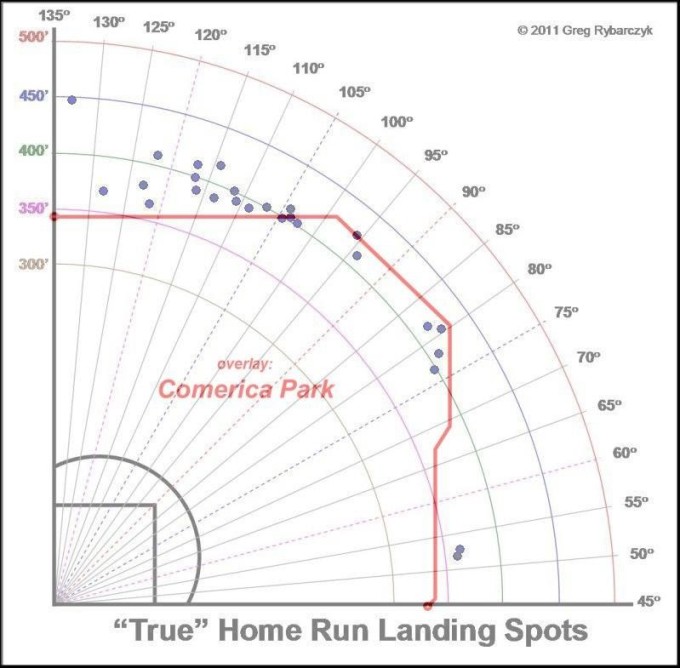
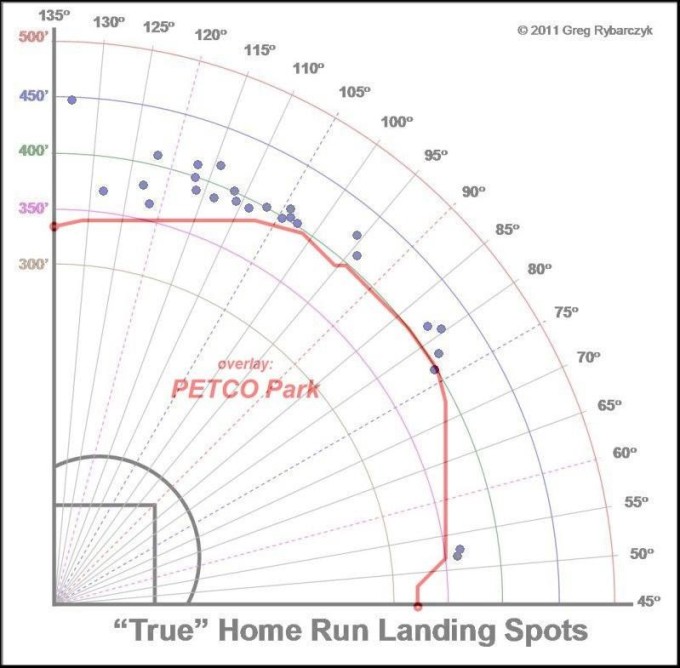
The numbers here do not look all that out of line, other than his 2012 season where his HR/FB% was off from the average. Upton usually sits around the high 20’s in terms of total home runs, being pretty consistent except for the outlier 2012 season. But the home-run exit speeds have decreased each of the last five seasons — some seasons the decrease was more than others, but still they have decreased nonetheless. Another aspect of Upton’s stats to look at is his 2015 home-run landing spots overlaid with an outline of Comerica’s dimensions.

comericaPetco

The graphs show the “True” Landing spots according to the ESPN Home Run tracker for the 2015 season. Notice that roughly eight of Upton’s 2015 home runs would not have made it out of Comerica. Only one would have stayed inside Petco, Upton’s 2015 home field. If we used the Comerica park numbers, Upton would have hit 26-8, so 18 home runs. This creates a reason to be concerned, especially since most of Upton’s value is supplied by his ability to drive the ball out of the park, and not his ability to hit for average.

So a value trap you say?

Yes, a value trap. Considering that Upton is 28, paying $22 million a year seems pretty reasonable. In fact, some baseball commentators saw it as a solid investment (and it may turn out to be such). But the caveat is Upton’s opt–out option after two years, similar to the deal Jason Heyward has. If Upton is able to continue to produce nearly 30 home runs a year, he could easily opt out and test the free-agent market again. But if an underlying metric like home-run exit speeds continues to dip and the power numbers take off downhill with it, there is no rational reason for him to opt out and test the market again when he has a $22 million/year deal locked up for four more years.

Therein lies the trap: In an effort to win now by the Tigers, they will either lose Upton after two seasons or they will get trapped by a contract that could eat $22 million of payroll a year, for four years, for a player whose power numbers have dropped and will struggle to provide value in other areas. Is it a great deal for Upton? Of course. Is it good for the Tigers? Short-term, yes. Long-term, there are very few scenarios where they emerge as a winner in the deal. Either they have to pay for Upton again after the 2017 season, or they get stuck with a player who isn’t as good as he once was. Maybe it’s just a hunch but I think the Tigers may be getting the shaft.

[1] www.mlbtraderumors.com/2015/10/justin-upton-mlb-free-agent.html


A Criterion-Referenced Method for Hall of Fame Voting

Each year when it comes time for Hall of Fame voting we hear a lot about the problems with the voting process.  The Baseball Writers’ Association of America (BBWAA) has recently made some changes to address issues related to the qualifications of the voters.However, other problems with the voting process persist.  From a psychometric perspective, a primary concern is that the ballot is norm-referenced, meaning other players on the ballot matter.  The issue of whether a player is a Hall of Famer should be based on their performance on the field and not based on whether they happen to hit the ballot with 10 other players who may also have potential Hall of Fame credentials.  As it currently stands, the Hall of Fame ballot is more about whether a player is a Hall of Fame-caliber player compared with the other players on the ballot and given that voters can only vote for 10 players.  That voters have a limited number of votes also imposes a ceiling effect and in years when there might be more than 10 Hall of Fame caliber players on the ballot, some might not get votes they would otherwise get.

The Rasch model2 provides a criterion-referenced, sample-free method for analysis.  This means that it would be possible for voters to vote for as many players as they want regardless of who else is on the ballot without compromising the selection quality.  Furthermore, a player would never need to be removed from the ballot because they received too few votes and new voters could be added without changing the threshold for election.

In order to demonstrate this method I enlisted the help of 16 friends to cast votes on whether they thought each player was a Hall of Famer or not.  They simply answered Yes or No for each of the 32 players on the ballot.  If they weren’t sure they were allowed to leave their response blank, and since the Rasch model is robust to missing data, blank responses do not impact the player measures.  Tables 1 and 2 provide a summary of the responses for players and voters, respectively.

Table 1.  Summary of Player votes
Player YES NO blank
Garret Anderson 0 12 4
Brad Ausmus 0 11 5
Jeff Bagwell 8 6 2
Barry Bonds 10 5 1
Luis Castillo 1 11 4
Roger Clemens 12 3 1
David Eckstein 1 11 4
Jim Edmonds 3 9 4
Nomar Garciaparra 5 8 3
Troy Glaus 0 11 5
Ken Griffey Jr 16 0 0
Mark Grudzielanek 0 11 5
Mike Hampton 0 11 5
Trevor Hoffman 8 4 4
Jason Kendall 0 11 5
Jeff Kent 3 9 4
Mike Lowell 0 11 5
Edgar Martinez 6 7 3
Fred McGriff 4 7 5
Mark McGwire 8 7 1
Mike Mussina 3 8 5
Mike Piazza 15 1 0
Tim Raines 6 6 4
Curt Schilling 14 1 1
Gary Sheffield 8 6 2
Lee Smith 2 8 6
Sammy Sosa 8 7 1
Mike Sweeney 2 10 4
Alan Trammell 3 9 4
Billy Wagner 3 8 5
Larry Walker 2 9 5
Randy Winn 0 11 5


Table 2.  Summary of Voter responses
VOTER YES NO blank
Voter01 8 24 0
Voter02 5 2 25
Voter03 15 17 0
Voter04 6 26 0
Voter05 5 27 0
Voter06 5 0 27
Voter07 10 0 22
Voter08 18 14 0
Voter09 6 26 0
Voter10 12 2 18
Voter11 15 17 0
Voter12 6 26 0
Voter13 11 21 0
Voter14 5 27 0
Voter15 13 0 19
Voter16 11 20 1


It is natural that the conceptualization of what constitutes a Hall of Fame player will vary by voter, with some being more lenient and some being severe.  Based on the severity of the voter and the ability of the player, the list of players will form a hierarchy.  This hierarchy is graphically represented in Figure 1.

Figure 1. Voter-Player map
Hall of Fame Voter-Player Map

Griffey received 16 Yes votes and one can see that he is at the top of Figure 1.  There were 9 players who did not receive any Yes votes and they can be seen at the bottom of Figure 1.  Hoffman is ranked higher than Clemens even though Clemens had more Yes votes (12 to 8).  However, Clemens received 15 total votes and Hoffman only 12, so Hoffman’s 8 votes were effectively worth more than Clemens’ 12 votes based on the severity of the 12 voters who actually provided a vote for Hoffman. Figure 1 also shows the severity of the voters with Voter05 and Voter14 being the most severe and Voter06, Voter07, and Voter15 being the most lenient.  Because these three voters only cast Yes votes and left the rest blank, they were shown to be very lenient since voters are only calibrated on the responses they provide.

In order to actually determine election to the Hall of Fame, a passing standard would need to be established.  This could be done by a variety of methods3 and could be carried forward each year so that the standard for election would remain the same for everyone.  Since the voting block from BBWAA is relatively stable, anchoring the voters’ Rasch calibration produces a stable scale in which voters can be added and removed easily without changing the passing standard.

I mentioned earlier that a player would not need to be removed due to an insufficient vote tally, but 9 players here did not receive any Yes votes.  It would seem natural that these players would be removed from the ballot to make room for others coming on so that the ballot did not become so large as to put an undue burden on voters.  However, statistically speaking, it doesn’t matter.  Once voter calibrations are anchored the number of players on the ballot becomes irrelevant.  The score scale and passing standard would be the same if the ballot was one player or 100 players.

Needless to say, this is a simple demonstration using a non-representative sample.  It would, however, alleviate some of the issues that plague the voting process.  The discussion would then hinge on a player’s record and not on the intricacies of the ballot.  Borderline players would not be dismissed simply because they were the 11th best player on the ballot that year and voters would be free to vote for any number of players they felt fulfilled the criteria of being a Hall of Famer.

References

  1. http://baseballhall.org/news/hall-of-fame-announces-change-to-bbwaa-voting-electorate
  2. Rasch, G. (1960). Probabilistic models for some intelligence and attainment tests. Copenhagen, Denmark.: Danish Institute for Educational Research.
  3. Cizek, G. (2012). Setting Performance Standards. New York: Routledge.


Started From the Bottom, Now We’re…Average

2015 was the year of Bryce Harper. He led qualified hitters with a 197 wRC+, the highest since the turn of the century among players not named Barry Bonds. This was a vast improvement on his already-impressive 2014 season, in which he totaled a 115 wRC+.

Depending on how you look at things, you could say Bryce Harper was the most improved batter in 2015. I choose not to for two reasons: 1) it’s too easy, and 2) it makes this article more fun. There’s also another more objective reason: with only 395 plate appearances in 2014, Harper didn’t qualify for the batting title.

This poses a question: what minimum do we set to determine who improved the most between 2014 and 2015? If we say that the player needed to qualify for the batting title each year, we get Chris Davis as the most improved batter, who increased his wRC+ from 94 in 2014 to 147 in 2015. If we set no minimum, our wonder-boy is none other than notorious slugger Carlos Torres, the Mets pitcher who upped his wRC+ from -100 to 491.

Clearly, there needs to be some minimum. For the purpose of the article, I’ve decided to set it at 100 PA. This seems a reasonably small enough number to include a wide array of players, but large enough to get rid of anomalies (I’m looking at you Carlos). When we set this minimum, we discover that the batter whose wRC+ increased the most between 2014 and 2015 is… Ryan Raburn. However, since Jeff Sullivan already talked about Raburn, I decided to go with the next name on the list: J.B. Shuck.

If you don’t know who that is, I don’t blame you. I didn’t until I started this research. If you do know him, I’m going to guess that you’re either a White Sox, Indians, or Angels fan. Either that, or you have more time to watch baseball than a college student taking a full course-load of credits. Who’s to say?

The reason the casual fan might not know Shuck is because, well, he’s not exactly a star player. Here are the players with the lowest wRC+ in 2014 of those with at least 100 PAs:

That’s right, he was literally the worst batter that year. Almost as bad as if I were to join the majors. It should be no surprise, then, that he was able to improve so much — he had the lowest starting point. Even so, he still had needed to improve quite drastically in order to surpass Harper’s wRC+ improvement. And that’s exactly what he did:

In 2015, Shuck improved so much that he almost managed to be an average player. But how did he manage to do it? Was it a matter of luck, or did he actually get better?

The number that stands out the most in Shuck’s 2014 season is his .146 BABIP (batting average on balls in play). For those of you that don’t know, that number is quite bad. Like, less than half of what it should be. His BABIP in other seasons is right around league average, so something must have gone amiss last year. Looking at the underlying numbers, some things showed up:

So. His FB% and Pull% numbers were way up as compared to other years. For some context, the league-average FB% has been approximately 34% the past two years, while Pull% has been approximately 40%. These numbers suggest that Shuck spent too much time trying to pull the ball over the fence two years ago, and the video suggests the same thing. Here’s an example of him trying to do just this to a pitch on the outside corner, but instead weakly grounding to first. You can see how he opens his hips before he even starts his swing, forcing him to simply slap at the ball if he wants to make any contact:

And here he is in 2015, driving a similar pitch into left field:

The cause of his change in approach is hard to say. He did get a new hitting coach to start off the year, switching from Jim Eppard to Don Baylor. From 2013 to 2014, the Angels as a team increased their FB% from 33% to 34% and their Pull% from 37% to 42%, so that argument does have some merit. Regardless of the reason, it’s clear that it had an effect. Here’s Shuck’s ISO by zone:


As can be seen on the left, Shuck had trouble hitting anything not on the inside edge of the plate in 2014. This past year, he learned to control more of the strike zone, and even though there’s less red than there was in 2014, there’s also a lot less dark blue. Shuck drove the ball from all parts of the zone to all parts of the field, and his numbers improved because of it.

While Shuck may not be an All-Star anytime soon, his year-to-year improvement is truly remarkable. If he can go from being the worst hitter in baseball to an average one, anyone can. And if that doesn’t inspire the Brendan Ryans of the world, I don’t know what will.


Meet the 2016 Mets, A Good Enough Team

The Mets off-season has been very “Mets”. One could gripe, one could be happy, one could simply think it was reasonable. But it was undeniably the Alderson-Mets; a conservative off-season.

Mets fans will associate it with loss, more than gain. Many came to adore Yoenis Cespedes and he (or a bat like him) is thought of, more than anything else, as the type of piece needed for a return trip to the World Series. The failure to re-sign Cespedes (which is more of a refusal to sign Cespedes on part of the Mets) has drawn the ire of those same fans. I mean, my brother is a pretty calm and reasonable person, and I get e-mails like this:

“The Mets fucked themselves. Royals go out and steal Gordon for 4/$75M. What a joke. If Cespedes goes for this number, it will be an absolute shame.”

The truth is that Cespedes was a great fit for the Mets at the trade deadline but he was always an awkward fit in the long-term.

First, the Mets need a center fielder and while Cespedes can play center field, he is not a center fielder. He compiled a -4 DRS and -3.2 UZR in 312 innings in center field for the Mets last year. If you look back to his time in Oakland the results were similar. He’s played 912.1 innings in center field over his career and has compiled a -17 DRS and -12.6 UZR. So, if he’s not going to supplant Michael Conforto and you can’t make room for him in right field with Curtis Granderson having two more years on his contract, there is no home for Cespedes in the field.

Second, his acquisition coincided with the additions of Kelly Johnson and Juan Uribe, the debut of Michael Conforto, and the returns of Travis d’Arnaud and David Wright from injury. Cespedes probably ignited something qualitative in the team, while blasting 17 home runs after the trade, but the Mets have ample opportunity to replace his 1/3 of a season impact with a full season of the other things that propelled them to a NL East title.

These are arguments against bringing back Cespedes, but don’t even touch on the most obvious inevitability  —  Cespedes is unlikely to replicate his performance in August and September, nor his performance over the entirety of 2015. Cespedes is a very good baseball player, but he’s not the baseball player the Mets are looking for.


The real key to the 2016 Mets offense is Travis d’Arnaud. d’Arnaud is oft-injured, but when he is not he is a great player. He could be the best catcher in baseball, but he may also cobble together a half-season of play, losing multiple battles to the disabled list. d’Arnaud provided 2.3 fWAR and 1.7 bWAR in 2015 while only playing 67 games. When he plays he is an elite catcher, and a very good hitter, ranking 3rd in wRC+ (.131) and wOBA (.355) for catchers, trailing only Buster Posey and Kyle Schwarber. A full season of d’Arnaud could exceed the value of Cespedes in 1/3 of a season…by a lot.

In the outfield, the Mets are banking on what they have. A full season of Michael Conforto would be as impactful as a full season of d’Arnaud. Conforto provided nearly identical value to Cespedes down the stretch of the season, contributing 2.1 WAR, by both FanGraphs and Baseball Reference’s measure. Cespedes value was measured at 2.7 or 2.3 WAR, respectively. It’s unlikely that Conforto can extrapolate that performance over an entire season, but he doesn’t need to.

 The signing of Alejandro De Aza indicates the Mets are pushing it all in on Juan Lagares. Lagares will never be a great hitter, but if his elbow is healthy and he can revert back to something resembling the center fielder he was in 2013 and 2014, then Lagares will add a couple more wins in 2016 then he did 2015.

The team needs to hope that Conforto is an impact bat in the middle of the order, and Lagares reverts to his old form, because they should expect some sort of meaningful regression from Curtis Granderson, who will play his 35-year-old season this year and is coming off one of the quietest great seasons of 2015, where he contributed 5.1 WAR, the 19th highest total in the league.


The front office seems to have a strong belief that the depth provided by Kelly Johnson and Juan Uribe provided a large amount of value. This is the simplest rationale of the signing of Asdrubal Cabrera and a combined $14 million given to Cabrera and De Aza for 2016

Terry Collins will be able to shuffle the middle infield around injuries and match-ups with Wilmer Flores, Ruben Tejada, and Cabrera all capable of playing SS and 2B. Tejada and Flores will likely be able to slide over to 3B to relive Wright, who seems on track to start in an abbreviated amount of games in order to manage his spinal stenosis.

Finally, the Mets traded Jon Niese for Neil Walker. Walker provides equivalent value as Daniel Murphy and allows Dilson Herrera to spend one more year in the minors, or alternatively, gives the Mets a valuable trade asset to improve the team in July. Both make sense, although Herrera appeared to be ready to grab the second-base job — but between Herrera’s age (he won’t be 22 until August) and potential trade value, picking up Walker was the right move.


In sum, the Mets’ off-season wasn’t really one of gain or loss. Walker was the most obvious move: He provides nearly identical value to Murphy, while giving the Mets a little more glove in exchange for a little lighter bat. It wasn’t really an addition, but a replacement. Other than that, there were no other “moves”; just gambles. d’Arnaud is fragile, Conforto is young, and Lagares may not be good enough to start, at least in the context of this lineup. If all these gambles pay off, then the Mets’ off-season acquisitions will make perfect sense. Depth in the infield and outfield may be all they need. It just seems so rare, particularly for the Mets, that all these gambles pay off.

These do not feel like long-shot bets though. They seem reasonable and calculated. If you couple these bets with the belief that, in the aggregate, 3/4 of the season with Wright, a full-season of Matz and Syndergaard, and a full season of bench depth is worth 5–6 extra wins, then the Mets are a better team than the 2015 version, at least on a full-season basis.

And if it’s not good enough? Well, that’s what the prospects are for. Trade some. Unless it’s really not good enough, in which case, it was never going to be good enough. And that too is what the prospects are for  — the future.

If it wasn’t for last season’s World Series run, we’re probably more focused on the future of the Mets: Herrera replacing Walker; Dominic Smith replacing Duda; Brandon Nimmo platooning with Lagares and Granderson in 2017, all in tandem with a developing Conforto and the “young pitching.” However, the pitching staff is so good, the Mets can never abandon the present, but they also can’t screw up the future.

In light of all of this, the Mets’ off-season wasn’t bad, it wasn’t great, and it wasn’t exciting. It was good enough. They are taking a plunge into what they have, in light of what is coming and in fear of investing in a potentially flawed team. We’ll never know exactly what the Mets are thinking, but we know what they have done. The 2016 Mets were built with one eye on the future, one eye on the past, with neither taking too much time to glance at the present.

The following projections for 2016 were made using Steamer Projections

2016 Mets wOBA Expected Runs — 670 (.311 wOBA)

2016 Mets FIP and Def Expected Runs — 584 (3.57 FIP, -16.1 Def)

2016 Mets Pythagorean W-L — 92–70


$500 Million Man

A few days ago, Joe Posnanski wrote about the possibility of Bryce Harper getting the first $500m contract ever. I agree with him on how both amazing and ridiculous it would have sounded 2 or 3 years ago. I also agree it is possible, almost likely, to happen. I might not be a Bryce Harper fan but he is so young that is he is on track to accomplish big things. He is not Mike ‘King’ Trout but he is very good.

Harper’s current contract runs through the end of 2018, which is when I assume he would get the big fat check. The Nationals will try to extend his contract before he is a free agent, just like the Marlins and the Angels did with Giancarlo Stanton and Mike Trout. However, in this post we will assume Harper will not pursue that path, making him a highly-coveted free agent in 2018. I will also exclude the possibility of 9- or 10-year contracts, which would make the mark easily achievable. Let’s run the numbers for Harper’s future:

Year Open market ($m/WAR) Age WAR Projected Value ($m) Cumulative value ($m)
2016 8.4 23 6.8 54.4
2017 8.8 24 7.1 59.2
2018 9.3 25 7.3 64.4
2019 9.7 26 7.6 69.9 73.4
2020 10.2 27 7.8 75.8 153.1
2021 10.7 28 7.8 79.6 236.7
2022 11.3 29 7.8 83.6 324.5
2023 11.8 30 7.8 87.8 416.7
2024 12.4 31 7.3 86.3 507.3
2025 13.0 32 6.8 84.4 595.9
2026 13.7 33 6.3 82.1 682.1
2027 14.4 34 5.8 79.4 765.4

We have here Harper’s projected value profile. As usual, I am using FanGraphs’ model, which has a player’s aging curve that follows +0.25 WAR/year (Age 18-27), 0 WAR/year (Age 28-30),-0.5 WAR/year (Age 31-37),-0.75 WAR/year (38 and older). It also assumes that open-market WAR sits at $8.4m in 2016 and grows at 5% per year. The starting point is Steamer’s 2016 projection: 6.8 WAR.

Three years from now, in the winter of 2018, he will be negotiating his new contract that includes his theoretical peak 27-30 years at ~7.8 WAR/year. The truth is that a 7-year / $500m+ contract would only be likely if by 2018 he can position himself as a player who consistently accounts for almost 8 wins per year. That is the only reason a team would be eager to invest half a billion dollars in a single player, marketing-related reasons aside.

Now, the question comes down to what he needs to do by 2018 in order to cement that positioning. The model needs him to be a 21.2-win player during the next 3 seasons. While Harper might have taken a significant step up performance-wise, we need to remind ourselves that before 2015 he was “just” a ~4-5 WAR guy. In order to meet the model’s expectations he needs to double those numbers, and remain at that level  for 3 years in a row (i.e.: Between 8-9 WAR for that 3-year period). If he meets those marks, Harper would have accrued 40 WAR during his career by 2018. While that is entirely possible, it is not easy. This is the list of highest cumulative WAR by age-25:

Player Cumulative WAR by age 25
Ty Cobb 56.3
Mickey Mantle 52.5
Jimmie Foxx 47.3
Rogers Hornsby 46.9
Mel Ott 45.9
Alex Rodriguez 42.8
Eddie Mathews 39.4
Arky Vaughan 39.4
Tris Speaker 38.7
Mike Trout 38.5

So, two conclusions can be quickly drawn. First, Mike Trout is not human. He is only 24 years old and is already on this list with guys like Cobb, Mantle, Foxx and company. Second, no, it is not an easy task for Harper. I know that you are thinking that he just put up a 9.5 WAR season, why can’t he do it again? Another season like that and he should get to his target easily but, truth be told, those Trout-esque seasons are unlikely to happen. I say this for three main reasons. First, Harper is not an elite defender and has gotten worse every year. For the last 3 seasons (2013-2015), he ranks 37th in UZR/150 out of 60 qualified OF. In 2015, he compiled -8.5 on Defense (Def) metric, per FanGraphs, which is position-adjusted, in his case for RF. Out of the 69 individual seasons with 8 or higher WAR from players 25 or younger, only 5 players (Hank Aaron, Ted Williams, Stan Musial, Mike Trout (!) and Bryce Harper) had -8 or worse Defense. No, it is not impossible but it is hard.

Second, he is an above-average baserunner, but not an awesome one. Lastly, Harper has not exhibited good health over his career. He has had injuries in 2 out of 4 seasons, which may not seem many but in 2013 and 2014 he only played 67% of Nationals games. Predicting health is tough, especially because there are unforeseeable events. You cannot control a hit by pitch at your wrists or a concussion sliding in second base but your health track record is your best bet on your future injury report. Those three things are vital to get to 21.2 WAR during the next 3 years. Harper needs those factors to come in play in order to get to the 7yr/$500m contract. Harper’s advantage is his age – just like Jason Heyward this offseason.

We have implicitly talked about Mike Trout. He is arguably the best player in baseball right now and was on track to smash the contract record, until he negotiated a 6yr/$144.5m contract extension. That will keep him locked up from ages 24 to 29 at LAA. Now, the question is what type of contract will he command in 2020? Mind you, it is hard enough to try to predict what a Free Agent might get in 2016, but still we took a stab a it.

Year Open market ($m/WAR) Age WAR Projected Value ($m) Cumulative value ($m)
2016 8.4 24 9.2 73.6
2017 8.8 25 9.5 79.4
2018 9.3 26 9.7 85.6
2019 9.7 27 10.0 92.1
2020 10.2 28 10.0 96.8
2021 10.7 29 10.0 101.6 101.6
2022 11.3 30 10.0 106.7 208.3
2023 11.8 31 9.5 106.4 314.6
2024 12.4 32 9.0 105.8 420.4
2025 13.0 33 8.5 104.9 525.3
2026 13.7 34 8.0 103.6 628.9
2027 14.4 35 7.5 101.9 730.8

Here is Trout’s projection. Again, 2016 WAR is courtesy of Steamer. We might think the aging curve slightly benefits Trout because it forecasts a ~10% increase in WAR, and he has not posted those 10 WAR seasons since 2 years ago. Then again, let’s toy with the idea. The $500m contract here seems more feasible for three reasons. First, in MLB, you get paid for what you did and not for what you will do.  By 2020, Trout could have ~85 WAR under his belt –he would be 28 years old. That is just ridiculous and will not happen, right? No one, ever, has done that by age 28 (Ty Cobb is the leader with 78.6 WAR). But what if he does? What if Trout is around the 70 WAR mark with 8 or 9 great seasons on his resume? Second, he needs to do what he has already done e.g. Trout has posted two +10 WAR already. The other two seasons were 8 and 9. This guy runs well and plays above-average defense. Trout does it all and will not stop. Third, unlike Harper, Trout has been very much healthy. During the 2013-2015 period, he played 157, 157 and 159 games, respectively. Again, injuries are hard to predict but we will take what he has shown so far as a given, which is good health. Fourth, fair to say, time value of money. A dollar today is not worth the same as a dollar tomorrow. Therefore, getting a $500m contract in 2020 should be easier than in 2018.

In summary, I think Harper can do it but I would not bet on it. From my perspective this is a long shot. If you ask me today on who is more likely to become baseball’s first 500-million-dollar man, I would put my money on Mike Trout to beat Bryce Harper on this as well.

Note: This analysis is also featured in our emerging blog www.theimperfectgame.com


A Quick Look at Alex Gordon

Only a few of the major free-agent names remain available as we approach the new year. One of the most intriguing is Alex Gordon. He’s not only been an excellent fielder over the course of his career, but he’s also been an above-average hitter. His age-25 and 26 seasons were cut short by injury and I think we can give some leeway to a 23-year-old rookie for not having an above-average bat, but otherwise he’s had an excellent career. Here’s are his stats throughout his career:

Year Age G HR RBI OPS OPS+
2007 23 151 15 60 0.72 90
2008 24 134 16 59 0.78 109
2009 25 49 6 22 0.70 87
2010 26 74 8 20 0.67 84
2011 27 151 23 87 0.88 140
2012 28 161 14 72 0.82 123
2013 29 156 20 81 0.75 103
2014 30 156 19 74 0.78 118
2015 31 104 13 48 0.81 120

There’s no doubt that he’s a great baseball player. He’s also accumulated 3 seasons with 6+ WAR since his rookie season. But there’s always the question as to whether a player has peaked or not, especially when their age starts creeping into the 30s. To try and answer this I look at the OPS values he’s put up over the years and extrapolated those numbers into his age-40 season. Below, in black, are the seasons that he’s already played. I’ve also included a line-of-best-fit through the data with the black portion representing past seasons and the red portion representing his future offensive output. Based on the seasons he’s put together, the model predicts that he will peak at about 34 years of age. Most players peak in their late 20s, but it’s not unheard of for players to peak later. Projections should always be taken with a grain of salt, but whichever team decides to take a shot on Gordon could expect his offensive production to remain relatively constant over the next few years.

So what does this graph tell us? Well basically nothing! It’s not very good practice to extrapolate past the range of your data, but it is interesting nonetheless. Also, considering Gordon has been so good for so long it’s tough to assume that he hasn’t peaked yet. That’s not to say he can’t continue to improve or even perform at a high level, but since it’s getting later in the offseason and so much money has been thrown at pitchers let’s assume he signs for 4 years. Below are his projected OPS values and as you can see from the graph above that Gordon may not even be in his offensive prime.

Age OPS
32 0.804
33 0.806
34 0.807
35 0.805

So far I’ve shown you data for Gordon’s career and also used that data to project his performance over the next 4 years. Assuming he signs a 4-year contract this off-season I wanted to find his closest comparables from his career so far and see how those players performed through their age-35 season. In order to compare players I used the Mahalanobis distance for all players that fell into the following criteria; (1) played in every season from their age 29 to 31 seasons, (2) at least 1200 ABs over that time and (3) played every season in their age 32-35 seasons. The Mahalanobis distance was calculated using common offensive statistics standardized by the number of at-bats. Here is a table with the lowest Mahalanobis Distance’s to Alex Gordon through his career thus far as well as their cumulative WAR for their age 32-35 seasons.

Name M Dist WAR
Melvin Mora 0.25954  14.0
Jay Bell 0.30550  10.0
Randy Winn 0.43127  9.7
Bret Boone 0.60615 9.9
Jermaine Dye 0.60776 6.0
Jim Edmonds 0.61443 24.3
Kevin Millar 0.61954  5.6
Ken Caminiti 0.62620  17.5
Lou Whitaker 0.63387  20.5
Ray Durham 0.69760 6.4

Last year Dave Cameron broke down the cost for WAR here and found the number to be somewhere around $7 million. Tim Dierkes projected a 5-year, $105-million contract or roughly $21 million per year. In order to live up to that annual salary, he would have to produce about 3 WAR per season which is 12 WAR for a 4-year contract and 15 WAR for a 5-year contract. Melvin Mora, Jim Edmonds, Ken Caminiti and Lou Whitaker each exceeded that 3-WAR threshold.

As this offseason progresses, offers will undoubtedly be presented to his agent so now it’s only a matter of when he signs. Based on the players that he was compared to, Alex Gordon definitely has the potential, not to mention the ability to exceed the standards of the contract he inevitably signs.