Archive for Uncategorized

Being Sunny About the Brewers

There is a lot of talk about tanking in baseball and the Milwaukee Brewers headline the conversation along with the Atlanta Braves and Philadelphia Phillies. The Brewers, unlike their counterparts in the cellar of baseball, are a respectable team as it stands. They are not a playoff a contender, but they are not a bad team; they are not a scourge; they are an average major-league team in a very good division.

The link the Brewers have to being a very bad baseball team revolves around what we assume they will do, and really, what they should do. But, before speaking of what they will do, it’s worth examining what David Stearns has done since taking over control of the team. The off-season has been a flurry of facially insignificant moves. Here, is a list of them:

  • Luis Sardinas was exchanged for Ramon Flores, an outfield prospect with the seemingly equivalent middling value of Sardinas as an infield prospect, in a trade with the Mariners
  • Javier Betancourt, a younger infield prospect of middling value, was acquired from the Tigers in return for Francisco Rodriguez
  • Jonathan Villar was acquired from the Astros in return for a Cy Sneed, a low-level pitching prospect
  • Jason Rogers, a 27 year old first base prospect sure to see some MLB playing time this year, was traded to Pittsburgh in return for Keon Broxton, an extremely athletic prospect that profiles as a potential versatile and competent fourth outfielder, in addition to pitcher Trey Supak
  • Adam Lind was sent to the Mariners in return for a trio of young, but not highly touted pitching prospects who have struck batters out at low-levels. Carlos Herrera (18), Daniel Missaki (19), and Freddy Peralta (19) are all lottery tickets, but one could always be a winner

They then went about picking up all your favorite team’s former favorite prospects, much like the Astros did when Stearns was working for them. Garin Cecchini was acquired from the Red Sox for cash; Will Middlebrooks was signed to a minor league contract; and Josmil Pinto was claimed off waivers.

Most recently, they replaced Jason Rogers and Adam Lind with Chris Carter, leaving them nearly where they started at first base, except they received five respectable prospects in return for the two first basemen sent out. Steamer projects Carter to post the best wOBA of the three (.333). There’s no loss occurring for the Brewers presently, with the potential of a marginal to hefty gain in the future.

The shuffling of first basemen has Milwaukee walking away with four young starters and a defensively capable outfielder. If one of those starters turns into a back-of-the-rotation pitcher and Broxton turns into a reliable major-league bench player then Milwaukee has won. Really, they win if any of these guys provide only one year of some sort of average major-league contribution, and they only lose if Rogers has an against all odds late-aged prospect emergence.

All of this happened before the re-build. The Brewers managed to maintain their same level of mediocrity, except they gained seven prospects to fill a depleted, and for the most part barren, farm system.

That’s the most exciting part of this. Stearns turned two prospects (Sardinas and Sneed) and three players that offered no value above what is currently on the roster (Francisco Rodriguez, Adam Lind, and Jason Rogers) into seven young prospects and a respectable utility infielder (Villar). The Brewers maintained all of their assets during the process. Now Stearns can focus on moving the real value for the type of players needed to drive a successful re-build.

First, take stock of what the Brewers have.

Jonathan Lucroy is still a very good catcher; Ryan Braun is still a very good outfielder; Khris Davis is an above average outfielder; Jean Segura and Scooter Gennett are an average middle infield; Chris Carter is a powerful first baseman; Wily Peralta and Jimmy Nelson resemble the kind of pitchers that are getting $70-$80 million in guaranteed contracts this winter, and the bullpen has capable arms in Will Smith, Michael Blazek, Jermey Jeffress and Corey Knebel.

Lucroy and Smith stand out among this group. They are very good players on very good contracts.

Jeff Sullivan wrote an article attempting to determine Lucroy’s value in a trade with the Rangers. In the end, he settled on a prospect package of Dillon Tate and Lewis Brinson. This seems right. These are two prospects you find in the second-half of Top 100 lists.

This would be a similar return to what the Brewers received from the Astros last year in the Carlos Gomez trade. They acquired Domingo Santana and Brett Phillips, two good-to-very-good outfield prospects. Gomez and Lucroy bear some similarities, in the sense that they field positions with limited talent and are above-average hitters and very good fielders at their positions. They both share an injury history that is not scary, but does give you pause, and they are both on below-market contracts for two more seasons (Gomez had two years on his contract entering 2015).

Just like teams do not have a wide selection of center fielders in the middle of the season, they have less of a selection of catchers that could add one to two wins after the trade deadline. If Lucroy stays healthy and plays like he did in 2012 and 2013, even less than his prime 2014, he is a rare commodity for a team that could upgrade at catcher.

You wouldn’t have much reason to know about the Milwaukee Brewers’ setup man, but you should know more Will Smith. He’s likely to close for the team this year after posting a declining 3.25 and 2.47 FIP over the past two seasons. He’s doesn’t light up a radar gun (with an average fastball velocity of 93.3 mph), but his slider has ranked the 10th-most effective among qualified relievers over that period (12.2 runs above average). His fastball leaves a little to be desired and it may keep him from being a dominant closer, however, he is a near elite left-handed reliever that is capable of pitching successfully against right-handed hitters as well (he actually did much better again right-handers in 2015, allowing a .545 OPS against right-handed hitters and a .785 against left-handed hitters, but did the opposite in 2014). Those kind of relievers fetch a lot in return at the trade deadline, particularly with an additional three years of team control beyond 2016.

In 2015 the Athletics received Corey Meisner from the Mets for Tyler Clippard, an aging, soon to be free agent Tyler Clippard. Two years ago the Orioles surrendered Eduardo Rodriguez to the Red Sox for soon to be free agent Andrew Miller. Smith isn’t Miller, but with continued success in 2016 he’ll be much more than Tyler Clippard was last July. Any acquisition in between the type of players Meisner and Rodriguez were at the time they were traded would be a haul for the Brewers.


This is the kind of situation that gets turned around quickly if the right decisions are made because of the small decisions made by Stearns and the new Brewers regime this off-season. Trades that will send Lucroy and Smith away from the team should return prospects that will slot into the top half of the farm system which already includes Domingo Santana, Brett Phillips, and Orlando Arcia. Stearns stacked the lower end of the system with a bunch of lottery tickets this off-season and if any hit the Brewers will accelerate the pace of their re-build even further.

Milwaukee is not a wealthy team, but they have proven in the past that they are not allergic to spending on free agents. If they catch the right breaks then they could be a couple of big free agent signings from being a competitive team in a competitive division a couple seasons from now.


You can see the path this team is taking by examining what they have done since October ended. Fans should enjoy the excitement of potential and embrace the pain of losing for now because it shouldn’t last that long. The wins will be all the sweeter when they start to come.

The following projections for 2016 were made using Steamer Projections. The projections are based on their roster as of 1/22/16, not on how it will change throughout the season.

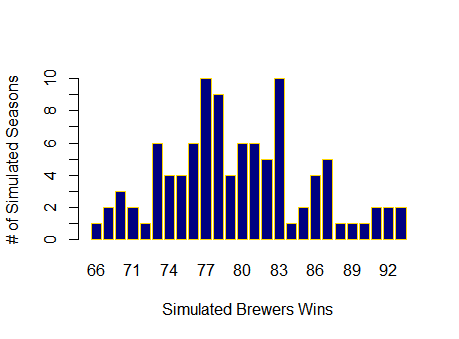
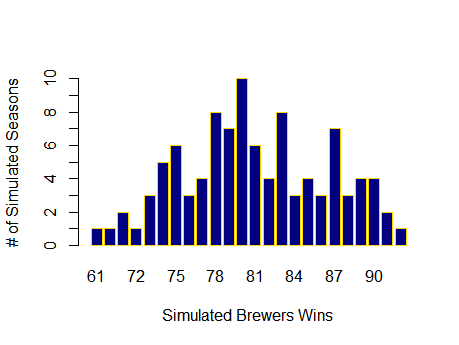
The graphs shown below are three separate simulations of the Brewers playing a 162 game season 100 times. It represents the range of outcomes a team with their projected winning percentage could experience. 

2016 Brewers wOBA Expected Runs — 680 (.313 wOBA)

2016 Brewers FIP and Def Expected Runs — 687 (4.2 FIP, -18.8 Def)

2016 Brewers Pythagorean W-L — 80–82


Meet the 2016 Mets, A Good Enough Team

The Mets off-season has been very “Mets”. One could gripe, one could be happy, one could simply think it was reasonable. But it was undeniably the Alderson-Mets; a conservative off-season.

Mets fans will associate it with loss, more than gain. Many came to adore Yoenis Cespedes and he (or a bat like him) is thought of, more than anything else, as the type of piece needed for a return trip to the World Series. The failure to re-sign Cespedes (which is more of a refusal to sign Cespedes on part of the Mets) has drawn the ire of those same fans. I mean, my brother is a pretty calm and reasonable person, and I get e-mails like this:

“The Mets fucked themselves. Royals go out and steal Gordon for 4/$75M. What a joke. If Cespedes goes for this number, it will be an absolute shame.”

The truth is that Cespedes was a great fit for the Mets at the trade deadline but he was always an awkward fit in the long-term.

First, the Mets need a center fielder and while Cespedes can play center field, he is not a center fielder. He compiled a -4 DRS and -3.2 UZR in 312 innings in center field for the Mets last year. If you look back to his time in Oakland the results were similar. He’s played 912.1 innings in center field over his career and has compiled a -17 DRS and -12.6 UZR. So, if he’s not going to supplant Michael Conforto and you can’t make room for him in right field with Curtis Granderson having two more years on his contract, there is no home for Cespedes in the field.

Second, his acquisition coincided with the additions of Kelly Johnson and Juan Uribe, the debut of Michael Conforto, and the returns of Travis d’Arnaud and David Wright from injury. Cespedes probably ignited something qualitative in the team, while blasting 17 home runs after the trade, but the Mets have ample opportunity to replace his 1/3 of a season impact with a full season of the other things that propelled them to a NL East title.

These are arguments against bringing back Cespedes, but don’t even touch on the most obvious inevitability  —  Cespedes is unlikely to replicate his performance in August and September, nor his performance over the entirety of 2015. Cespedes is a very good baseball player, but he’s not the baseball player the Mets are looking for.


The real key to the 2016 Mets offense is Travis d’Arnaud. d’Arnaud is oft-injured, but when he is not he is a great player. He could be the best catcher in baseball, but he may also cobble together a half-season of play, losing multiple battles to the disabled list. d’Arnaud provided 2.3 fWAR and 1.7 bWAR in 2015 while only playing 67 games. When he plays he is an elite catcher, and a very good hitter, ranking 3rd in wRC+ (.131) and wOBA (.355) for catchers, trailing only Buster Posey and Kyle Schwarber. A full season of d’Arnaud could exceed the value of Cespedes in 1/3 of a season…by a lot.

In the outfield, the Mets are banking on what they have. A full season of Michael Conforto would be as impactful as a full season of d’Arnaud. Conforto provided nearly identical value to Cespedes down the stretch of the season, contributing 2.1 WAR, by both FanGraphs and Baseball Reference’s measure. Cespedes value was measured at 2.7 or 2.3 WAR, respectively. It’s unlikely that Conforto can extrapolate that performance over an entire season, but he doesn’t need to.

 The signing of Alejandro De Aza indicates the Mets are pushing it all in on Juan Lagares. Lagares will never be a great hitter, but if his elbow is healthy and he can revert back to something resembling the center fielder he was in 2013 and 2014, then Lagares will add a couple more wins in 2016 then he did 2015.

The team needs to hope that Conforto is an impact bat in the middle of the order, and Lagares reverts to his old form, because they should expect some sort of meaningful regression from Curtis Granderson, who will play his 35-year-old season this year and is coming off one of the quietest great seasons of 2015, where he contributed 5.1 WAR, the 19th highest total in the league.


The front office seems to have a strong belief that the depth provided by Kelly Johnson and Juan Uribe provided a large amount of value. This is the simplest rationale of the signing of Asdrubal Cabrera and a combined $14 million given to Cabrera and De Aza for 2016

Terry Collins will be able to shuffle the middle infield around injuries and match-ups with Wilmer Flores, Ruben Tejada, and Cabrera all capable of playing SS and 2B. Tejada and Flores will likely be able to slide over to 3B to relive Wright, who seems on track to start in an abbreviated amount of games in order to manage his spinal stenosis.

Finally, the Mets traded Jon Niese for Neil Walker. Walker provides equivalent value as Daniel Murphy and allows Dilson Herrera to spend one more year in the minors, or alternatively, gives the Mets a valuable trade asset to improve the team in July. Both make sense, although Herrera appeared to be ready to grab the second-base job — but between Herrera’s age (he won’t be 22 until August) and potential trade value, picking up Walker was the right move.


In sum, the Mets’ off-season wasn’t really one of gain or loss. Walker was the most obvious move: He provides nearly identical value to Murphy, while giving the Mets a little more glove in exchange for a little lighter bat. It wasn’t really an addition, but a replacement. Other than that, there were no other “moves”; just gambles. d’Arnaud is fragile, Conforto is young, and Lagares may not be good enough to start, at least in the context of this lineup. If all these gambles pay off, then the Mets’ off-season acquisitions will make perfect sense. Depth in the infield and outfield may be all they need. It just seems so rare, particularly for the Mets, that all these gambles pay off.

These do not feel like long-shot bets though. They seem reasonable and calculated. If you couple these bets with the belief that, in the aggregate, 3/4 of the season with Wright, a full-season of Matz and Syndergaard, and a full season of bench depth is worth 5–6 extra wins, then the Mets are a better team than the 2015 version, at least on a full-season basis.

And if it’s not good enough? Well, that’s what the prospects are for. Trade some. Unless it’s really not good enough, in which case, it was never going to be good enough. And that too is what the prospects are for  — the future.

If it wasn’t for last season’s World Series run, we’re probably more focused on the future of the Mets: Herrera replacing Walker; Dominic Smith replacing Duda; Brandon Nimmo platooning with Lagares and Granderson in 2017, all in tandem with a developing Conforto and the “young pitching.” However, the pitching staff is so good, the Mets can never abandon the present, but they also can’t screw up the future.

In light of all of this, the Mets’ off-season wasn’t bad, it wasn’t great, and it wasn’t exciting. It was good enough. They are taking a plunge into what they have, in light of what is coming and in fear of investing in a potentially flawed team. We’ll never know exactly what the Mets are thinking, but we know what they have done. The 2016 Mets were built with one eye on the future, one eye on the past, with neither taking too much time to glance at the present.

The following projections for 2016 were made using Steamer Projections

2016 Mets wOBA Expected Runs — 670 (.311 wOBA)

2016 Mets FIP and Def Expected Runs — 584 (3.57 FIP, -16.1 Def)

2016 Mets Pythagorean W-L — 92–70


Brave-Hart: John Attempts to Slay the NL East

Say “John Hart” and many baseball fans will immediately think of a two-word phrase: “Cleveland Indians.” Hart made his name with the wider baseball public by skillfully transforming the perennial doormat into a juggernaut. From 1995 through 2001, the Indians finished first six times and second once. They went to the World Series (and lost) twice. The Indians last postseason appearance prior to 1995 was the 1954 World Series, when they got swept by the New York Baseball Giants.

Say “John Hart” and some baseball fans will think of another two-word phrase: “contract extensions.” Hart was a first-mover in employing the tactic of buying out a player’s arbitration and early free-agency years, paying a little more now in exchange for a lot less later. This was part of Hart’s broader strategy, useful anywhere and necessary in Cleveland, of squeezing the maximum value out of every dollar spent.

Say “John Hart” and almost no baseball fans will think of yet another two-word phrase: “senior citizens.” One of Hart’s less-heralded strategies was raiding the top end of the aging curve, signing players well past their born-on dates to patch the numerous holes in Cleveland’s roster that a decent but top-heavy farm system couldn’t fill. In 1995, Dennis Martinez tied for the second-best pitching season in baseball history by a 41-year-old.

In a coincidence proving that our lives are governed by powerful yet unseen forces far beyond our comprehension, Hart now finds himself in charge of the other Native American themed major-league franchise. (I strongly advocate renaming the Cleveland franchise thus, but that’s a topic for a different post.)  Hart’s experience in Cleveland will no doubt shape his approach to remaking the Braves into a contender, but the challenges he faces in Atlanta are in some ways more daunting, and the solutions he employed in Cleveland may be less effective today.

The Spiders team that Hart took over in 1991 already had most of the high-impact players that would power the team to its seven years of dominance. Here are the starting 8, the starting DH, and the rotation for the 1995 team, along with the player’s age and bWAR that year. A “+” indicates a player Hart obtained.

C      Tony Pena (38/0.3) +

1B    Paul Sorrento (29/0.4) +

2B    Carlos Baerga (26/2.6)

3B    Jim Thome (24/5.9)

SS    Omar Vizquel (28/1.4) +

LF    Albert Belle (28/6.9)

CF    Kenny Lofton (28/4.1) +

RF    MannyBeingManny (23/2.9)

DH   Eddie Murray (39/2.4) +


P       Dennis Martinez (41/5.7) +

P       Charles Nagy (28/2.4)

P       Orel Hershiser (36/3.7) +

P       Mark Clark (27/0.6) +

P       Chad Ogea (24/3.2)


Baerga, Belle, Ramirez, Thome: those Four Horseman of Lake Erie (ok, fine, you try making a metaphor) were already in the house when Hart took over. He added two critical pieces to the lineup, however. Quickly deciding that Alex Cole wasn’t the answer to any baseball question worth asking, in late 1991 Hart obtained Kenny Lofton from the Astros for … well, go ahead and click to find out. Lofton was traded six times in his career, and in five of those trades the team receiving Lofton committed larceny.

It took Hart longer to give up on shortstop (and former second overall pick) Mark Lewis, but after 800 ineffective plate appearances, Hart had seen enough. Recognizing that this guy has made Seattle’s Omar Vizquel redundant, Hart reeled him in for the low, low price of Felix Fermin and Reggie Jefferson.

That still left numerous vacancies on the major league roster, and Hart set about filling them by purchasing AARP’s mailing list for Northeast Ohio. Pena, Murray, El Presidente, and Hershiser were all old enough to know their way around the bingo parlor, and Hart got value from all of them except Pena.

Hart made two key additional moves, bringing in failed starters Jose Mesa and Eric Plunk and showing them immediately to the bullpen. The two combined for a whopping 6.0 bWAR in 1995.

And then those contract extensions!  Below are the player’s maximum salary with and after playing for the Indians, 2015 dollars (millions), as well as their ages during their last season in Cleveland:


________             Hart           Age                Hartless

Lofton                       5.3               29                    10.9

Ramirez                    6.2               28                   28.1

Baerga                       7.1               27                      7.0

Belle                          8.6               29                    17.6

Thome                      11.6              31                     17.1


Hart struck gold in four of the five cases – except for Baerga, these players’ salaries skyrocketed after they escaped the Cleveland contracts. Baerga was a misfire – he peaked very early and the first year under his new contract (1993) was the last year he would be dominant. In the other four cases, however, Hart got the players’ best years at a relative discount, and then allowed his competitors to overpay for the decline years.

Not that Hart avoided older players entirely – as we’ve seen, he prowled Sunset Acres with almost sinister determination. The years he didn’t want to pay for were the early to mid 30s; those were the years in which he seemed to think that market inefficiencies most significantly favored the players. Before that window he could get maximum performance, and after that window he could get veterans at discounts reflecting the players’ acute awareness of their own career mortality.

Vizquel is the obvious exception, though even here Hart got a bargain. Vizquel’s salary maxed out at $7.5 million  with the Spiders (in 2015 dollars), astonishingly low for a player who, while he probably doesn’t belong in the Hall of Fame, would hardly be an absurd choice. Vizquel played for Cleveland from age 27 through 37, thus encompassing many of the very years Hart avoided with others.

Here Hart was perhaps exploiting yet another market inefficiency, the bat bias. Vizquel never really hit – he had just two years with a wRC+ over 100, and his career number is 83, which isn’t that great even for a middle infielder. But oh, could he field. Only four active shortstops have played more than 2000 innings and have a better UZR/150 than Vizquel’s career 8.7. Vizquel’s glove was solid gold, and his relative weakness at the plate meant that Hart could buy that gold at a discount.

The system Hart inherited in Atlanta had less talent than Cleveland’s in 1991, though Hart has set about remedying the situation. From last year’s regulars, only Freddie Freeman figures to be on Atlanta’s next postseason team. Atlanta’s system has three prospects in the top 10 of their respective positions, according to MLB Pipeline: Dansby Swanson and Ozhaino Albies (both shortstops) and Sean Newcomb (LHP), with Swanson and Newcomb being Hart imports. Indeed, Newcomb came over in exchange for one of those better-than-Vizquel shortstops, Andrelton Simmons, he of the career 21.4 UZR/150; a phenomenal figure but one of arguably less relevance since Omar’s day thanks aggressive defensive shifting. (This isn’t necessarily to say Simmons’ number is inflated by shifting, but rather that less range-y guys might provide relatively more defensive value than previously thanks to the shifts.)

Assuming Hart keeps them both, Swanson will move to third or (less likely) Albies will move to center; his bat is unlikely to carry any other position. Atlanta’s upper levels have little obvious offensive potential, with center fielder Mallex Smith being a conspicuous exception. Though still largely a stranger to top-100 prospect lists, Smith has a career .768 OPS in the minors, unaided by the PCL, and will be just 23 this year. He struggled in AAA last season, but overall looks like he could be a useful speed-oriented center fielder. And he got a big up here.

So the outlines of a playoff core are in place: Freeman, Albies, Swanson, Smith (or perhaps Ender Inciarte, another recent Braves acquisition), and Newcomb. Long-term extensions, anyone? Well, let’s see, Freeman already got his: he’ll be pulling in $22 million in 2021 in a backloaded deal that looks somewhat risky, though it ends at age 31. Swanson, Albies, and Smith will have to wait until they demonstrate some ability in the majors, but the chances that Hart can get away with low AAV contracts through the players’ late 20s seem slim.

In 1994 Hart’s contract extensions seemed like a gamble, but today they look like bargains for the team. Few agents would want to be associated with these kinds of contracts unless the player needs to give a character discount (paging Aroldis Chapman). Indeed, Freeman’s contract may be the model here – a great deal for the team in the early years, while the player claws some of it back toward the end.

With the Indians Hart seemed to generally eschew long-term contracts for pitchers – the limited information I’ve found suggests that he never went beyond four years, though often with a salary-boosting club option (see, e.g., CC Sabathia and Bartolo Colon). So perhaps Newcomb can look forward to one relatively team-friendly 4-year deal to be followed by truckloads of cash from another team. One of Julio Teheran, Aaron Blair, and Touki Toussaint will probably fill the two spot.

As for the rest of the rotation, there are a lot of guys competing for probably two spots (the guys just mentioned, plus Manny Banuelos, Mike Minor, Matt Wisler, Mike Foltynewicz, and maybe three or four guys in the minors). Again, some of these guys may get one 4-ish year deal before moving on. On the other hand, good pitchers today will probably seek at least 5 or 6 years unless, again, there are character or injury issues militating in favor of a discount.

You know his methods, Watson – Hart may attempt to fill any remaining rotation holes with old but talented pitchers. Expect the same for the lineup, but using the young players’ sweet contracts to subsidize those of the veteran imports may be more difficult now than it was in the 90s, since the youngsters are going to leave less money on the table than the old (young) Indians did.

Hart enjoys one modest but rapidly deteriorating advantage: the NL East is a tire fire right now. The purported contending teams (Mets, Nats, maybe the Marlins) are more dysfunctional than Springfield’s nuclear plant. The Phillies have done an admirable job of remaking the front office and the farm system, but the team is still a few years from contention. This sorry window is closing, though. All of Atlanta’s competitors (except the Marlins) have more money to spend than Atlanta does; their dysfunction won’t last forever (except the Marlins). And yes, the Mets have, or should have, money.

Say “John Hart” to Atlanta fans in 2019 and maybe they’ll say “World Series!” But the mountain is steep – today he faces better-informed players and more uniformly competent GM competitors, all armed with big data that was only beginning to come into view in the mid 1990s. Perhaps Hart will lead his troops to fight like Scotsmen; to succeed, they’ll probably need to.


Indians Are Legit Contenders in 2016

As a Pittsburgh native and a lifelong “yinzer,” it feels quite awkward writing about future success up in that city on the lake that they call Cleveland. While there are certainly some question marks about the current roster, there is also a lot to be excited about. As I was looking through the 2016 Steamer projections the other day, I thought it would be fun to compare the Indians 2016 rotation to the New York Mets 2016 rotation. Before I go into my findings, I would like to add that I am not declaring the Indians’ rotation to be on the same elite level as the Mets’ rotation right now. I am merely comparing some advanced statistics and showing the great potential of this young rotation.

If the season were to start tomorrow, the Indians would have this 5-man rotation:

  1. Corey Kluber
  2. Carlos Carrasco
  3. Danny Salazar
  4. Trevor Bauer
  5. Josh Tomlin

The “KluBot” has been a strikeout machine since becoming a regular in the Indians rotation in 2013. He is known for his cutter, fastball, and changeup that produce a high number of swing and misses. His sinker has above-average velocity and produces a lot of groundballs. We also can’t forget that slider that has outstanding depth. That gives him a five-pitch repertoire, which makes him incredibly effective. The 2016 Steamer projections have Kluber producing a 3.04 FIP, 5.3 WAR, and a 9.5 K/9. These numbers represent a true ace and that’s what we should expect from the former Cy Young Award winner.

After spending most of 2014 as a reliever, Carrasco emerged as a starter this past season and made a strong 30 starts for the Indians. Carrasco has been effective by throwing all five of his pitches with the same intensity and producing a lot of whiffs. He has a fastball that sits around 96 mph, a changeup and slider that sits around 89 mph, a curve that sits in the mid 80’s, and a sinker that is thrown around the same speed as his four-seam. Steamer projects Carrasco to produce an excellent 2.96 FIP with a 4.8 WAR and 9.7 K/9. Carrasco should continue to be a valuable workhorse for the Indians in 2016.

At only 25 years old, Danny Salazar was able to make 30 starts for the Indians in 2016 along with Carrasco. Salazar has the ability to throw six solid pitches, which includes his four-seam, cutter, splitter, sinker, slider, and curve. His cutter, four-seam, and sinker all show above-average velocity and generate a large number of groundballs. Steamer projects Salazar to generate a 3.53 FIP, 3.2 WAR, and 9.4 K/9. As a spectator, it is easy to be fascinated by high velocity numbers. However, I have always been a huge fan of a pitcher that can put the ball on the ground and get quick outs. These three pitchers have done that very well early in their career, which should benefit the Indians in the long run.

Trevor Bauer has been an interesting player up to this point in his career. Unlike the first three pitchers, Bauer produces a lot more fly balls on the mound. The Indians will most likely start him in the rotation in 2016, but I think a move to the bullpen is inevitable. We have seen a few unsuccessful starters rejuvenate their careers in the pen, such as Wade Davis and Andrew Miller. For now, I believe that Bauer can still be a workhorse number 4 starter and give the Indians some good innings. Steamers projects Bauer to produce a 4.39 FIP, 1.2 WAR, and 8.3 K/9.

Like Bauer, Josh Tomlin has been known to produce more fly balls that most. However, he is a solid number five starter with below-average velocity on his four-seam and sharp 12-6 curve. Last year, Tomlin put up a 7-2 record with a 3.02 ERA and 0.84 WHIP in just ten starts. Steamer projects Tomlin to generate a 4.07 FIP, 1.5 WAR, and 7.2 K/9 in 2016. Tomlin is not going to overpower anybody, but will provide a good amount of innings at the back end of the rotation.

Below, I have listed the projected Mets rotation for opening day 2016 along with steamers projections.

  1. Jacob deGrom – 3.18 FIP, 4.4 WAR, 9.3 K/9
  2. Matt Harvey – 3.11 FIP, 4.6 WAR, 9.2 K/9
  3. Noah Syndergaard – 3.07 FIP, 4.1 WAR, 9.9 K/9
  4. Steven Matz – 3.66 FIP, 2.3 WAR, 8.8 K/9
  5. Bartolo Colon – 3.90 FIP, 1.3 WAR, 6.4 K/9

There is no doubt that the Mets have the best rotation in the league right now. It will only get better in June once Zack Wheeler makes his return from Tommy John and Bartolo moves to the bullpen. When comparing these two rotations, I found that the Indians have a slightly higher FIP of 3.59 compared to the Mets FIP of 3.38. However, compared to league average, both of these FIPs would be considered above average. When comparing the WAR of both rotations, the Mets are projected at 16.7 and the Indians are at 16 (just a 0.7 win difference). Last but not least, the Indians rotation projects to sit around an 8.8 K/9, while the Mets rotation projects to be at an 8.7 K/9. While this is not a huge difference, I found it eye-catching that the Indians rotation were projected at a higher K/9 than the likes of deGrom, Harvey, Syndergaard, and Matz. This is one of many reasons to be excited about this young Indians rotation going into the 2016 season.

After looking at the rotations, I took a sneak peek at the projected bullpens for each team. Before even looking at the steamer projections, I saw more promise in the Indians bullpen. With Cody Allen, Bryan Shaw, and Zach McAllister in the later innings and Jeff Manship, Shawn Armstrong, Kyle Crockett, and Austin Adams in middle relief, the Indians bullpen is by no means excellent. However, there is some potential with the young hard-throwers of Allen, McAllister, and Armstrong. The Mets are projected to have Jeurys Familia, Addison Reed, and Hansel Robles in the later innings along with Carlos Torres, Sean Gilmartin, Erik Goeddel, and Logan Verrett in middle relief. The Indians pen is projected to have better numbers across the board in FIP, WAR, K/9, and many other key statistics. However, both teams will be relying on their great starters to go the distance in many games.

Offensively, I have been hearing many Indians fans getting frustrated over a lack of big offseason moves by Chernoff and Antonetti to improve their lineup. Personally, I do not see a reason to worry just yet. Michael Brantley is expected to be back early in the season and Rajai Davis will play his role of a fourth outfielder for most of the season. I would be content with Rajai Davis being my fourth outfielder, even though he’s mostly limited to the corners. Abraham Almonte is not the most exciting player, but it could be a lot worse (Michael Bourn) and he should provide some defensive value. If anything, the Indians should look to add a third basemen. One person that comes to mind is David Freese, who is projected at a .320 wOBA, 101 wRC+, and a 1.2 WAR. Even though we have seen a small sample of Urshela, those numbers would provide a huge upgrade at third base. Also, a healthy Yan Gomes should provide some value behind the dish for this young staff. Entering the 2015 season, many were skeptical about the Mets offense and they were projected to produce around the same WAR as the season before (18.2). Steamers projects the Indians’ batters to produce a WAR of 18.4 in 2016.

The hard truth is that we don’t know who will underperform or over perform their projections before the season starts. Lindor could end up being a 5-WAR player rather than a 3-WAR player and Kipnis could be a 1-WAR player rather than a 3-WAR player. These are purely just projections based off past performances and league averages. I chose to compare these teams because I see a lot of similarities. Until adding Yoenis Cespedes during the trade deadline this past season, the Mets offense looked underwhelming, but survived with a strong staff. Going into the 2016 season most likely without Cespedes, the Mets offense still has question marks. However, with their strong rotation, they should be right at the top of the NL East along with the Washington Nationals once again. With Kluber, Carrasco, and Salazar, I see three powerful and healthy arms that produce a ton of groundballs and strikeouts. The offense will survive with this powerful rotation and decent bullpen. Therefore, as a Pittsburgh native, I urge my fellow Believelanders to get excited about this young team in 2016 as I believe they have the potential to be something special.

Hope you enjoy and had a happy New Years!


Finding a Suitor for Jose Fernandez

One of the league’s most coveted starting pitchers, Jose Fernandez, had his names floating around in rumors all through the winter meetings. Marlins’ President Mike Hill was adamant that Fernandez wasn’t available, but rumors surfaced that his name was being talked about with multiple teams, notably the Los Angeles Dodgers. The Marlins were reported to be looking for five-or-six really good prospects. What kind of team can put together a juggernaut package as is being requested? Well…

First we need to understand what Fernandez’s real value is. Dave Cameron wrote a great article earlier, which concluded that the ace was worth somewhere in the area of $100 million. Now we know why the Marlins’ asking price is through the roof.

Now, for a team to desire such a player, they must be, a) a win-now team, which b) has a solid farm system, and c) needs rotation help. Clearly, the Dodgers fit the bill. The Astros and Red Sox could be fits, with the Yankees being a looser contender. Let’s speculate what a package from each of these teams would look like:

Dodgers

Top Five Prospects:

  1. Corey Seager, SS
  2. Julio Urias, LHP
  3. Grant Holmes, RHP
  4. Alex Verdugo, OF
  5. Jose De Leon, RHP


The Dodgers receive:

RHP Jose Fernandez

RHP A.J. Ramos


The Marlins receive:

LHP Julio Urias

OF Alex Verdugo

RHP Jose De Leon


Why the Marlins would consider this: Julio Urias is the top pitching prospect in all of baseball, and being lefty makes him all the more valuable. Six years of Urias when the Fish have an actual chance at contending, plus top prospects Verdugo and De Leon, might very well be worth Fernandez’s post-TJ seasons.

Why the Dodgers would consider this: Jose Fernandez is under team control for three more years. The Dodgers, searching for their first title since 1988 when Kirk Gibson hit the walk-off homer in Game One, are thirsty for another one. Fernandez would continue the legacy that Greinke left for $200 million – the best 1-2 punch in baseball. AJ Ramos complements Kenley Jansen, solidifying a bullpen that has been shaky in the recent years.


Astros

Top Five Prospects:

  1. Alex Bregman, SS
  2. Mark Appel, RHP (note: now outdated, but doesn’t change the general idea)
  3. Daz Cameron, OF
  4. Kyle Tucker, OF
  5. A.J. Reed, 1B


The Astros receive:

RHP Jose Fernandez

RHP A.J. Ramos


The Marlins receive:

SS Alex Bregman

RHP Mark Appel

2B/OF Tony Kemp


Why the Marlins would consider this: Alex Bregman was drafted in 2015, yet he is already a top-25 prospect in baseball. Bregman has outstanding bat speed, and unparalleled mastery of the strike zone at such a young age. Mark Appel, first overall draft pick in 2013, has a fastball that hits the upper-90s and two above-average secondary pitches to round out his arsenal. Tony Kemp is another valuable piece to help the Marlins in the future

Why the Astros would consider this: With Jose Altuve and Carlos Correa blocking out second base and shortstop (respectively) for years to come, Bregman and Kemp have no space to crack the majors under. Bergman is a major talent that would fit well in any organization, but Carlos Correa seems to be a lock for the future. Pitching prospects can be extremely volatile, so giving up Mark Appel to get a bonafide ace to bolster the rotation seems to be a steal. A.J. Ramos fills the void left by Tony Sipp, who departs via free agency.


Red Sox

Top Five Prospects:

  1. Yoan Moncada, 2B
  2. Rafael Devers, 3B
  3. Brian Johnson, LHP
  4. Andrew Benintendi, OF
  5. Michael Kopech, RHP


The Red Sox receive:

RHP Jose Fernandez

RHP A.J. Ramos


The Marlins receive:

LHP Brian Johnson

OF Andrew Benintendi

SS Deven Marrero

RHP Ty Buttrey


Why the Marlins would consider this: With Marcell Ozuna’s departure seeming imminent, Andrew Benintendi is a prospect who can fortify their outfield as soon as September 2016. Brian Johnson is the top-prospect pitcher to replace Fernandez in future years. 6-foot-6 Buttrey generates a ton of swings and misses with his mid-90s heater and nasty knuckle-curve. Marrero is a likely future Gold-Glover, with his range and arm both being near-impeccable.

Why the Red Sox would consider this: Just as with the Astros, Benintendi and Marerro are both being blocked by stars already at the major-league level, i.e. Mookie Betts and Xander Bogaerts. And just like the other fifteen teams trying to emulate the Royals’ three-headed monster in the bullpen, A.J. Ramos latches on to Carson Smith and Craig Kimbrel to shorten the game for the Sox.

All in all, I’m not sure any of these trades would be enough to quench the immense thirst of the Marlins. I’m not sure they’ll ever get enough to have their prized jewel withdrawn from them; especially when he’s a guy just coming off Tommy John. It’ll be interesting to see how these next few weeks play out, but as of now, I think the ace in orange…stays in orange. At least for the time being.


Silly Money and What Our Society Values

The Boston Red Sox recently signed starting pitcher David Price to a seven-year, $217 million contract. That works out to $31 million per year. Not to be outdone, the Arizona Diamondbacks then signed pitcher Zack Greinke to a six-year, $206.5 million contract. Using straight division, Greinke’s contract calls for an average of $34.4 million per year, but the deal includes $60 million in deferred money that will be paid out in the five years following the end of the contract, so Greinke won’t be making $34.4 million next year. No matter how you look at it, though, these are big money deals.

There are many comparisons you can make with this. For starters, each time David Price heads out to pitch next season he will be making around one million dollars. David Price has averaged 217 innings pitched over the last six seasons. If he pitches 220 innings next year, he’ll make around $140,000 per inning. At 15 pitches per inning, that’s more than $9,000 per pitch. David Price will make as much money for throwing six pitches next season as the average public school teacher makes in a year.

In the world of Major League Baseball there are good arguments to be made that Price and Greinke will be worth the cost of their contracts. The most likely scenario for a long-term, big-money contract is that the player provides surplus value in the first few years of the deal but ends up overpaid in the last part of the deal. Baseball is flush with money right now for a number of reasons, including strong attendance numbers, but the big drivers behind the current economic strength of the game are cable television contracts and Major League Baseball Advanced Media (MLBAM). Baseball has done a very good job of establishing an online presence through MLBAM, which allows fans to follow their teams on assorted electronic devices beyond TV and radio.

Also, the way people consume entertainment these days is a big factor. More and more people have an on-demand mentality when it comes to their entertainment choices. No longer do we have to be in front of the TV at nine o’clock on Wednesday night to watch Modern Family. We can just record it and watch it later. If we miss the first few seasons of a popular show, we can binge-watch past seasons and catch up. We can record a week of Jeopardy! shows, then watch five in a row on a Saturday afternoon.

Sports are different. Most people want to watch sports live and this gives baseball (and other sports) a huge advantage. Sports fans have to be in front of the TV—or watching on a smartphone, a tablet, or a computer—while the sport is happening. We want to talk about it with friends, tweet about it on Twitter, and complain about the refs on Facebook. This strong desire to watch sports live makes sport programming a highly desirable commodity for networks and results in the big money TV contracts that baseball teams are signing.

So when you read about David Price or Zack Greinke signing a contract that will pay them $30 million or more per year, you have to understand that teams have enough money to pay them. They wouldn’t dish it out if they couldn’t afford it. These contracts aren’t unreasonable in the context of the game. As much as Price and Greinke are making, the owners of their teams are making more. Getting paid $30 million per year is not so ridiculous in the context of Major League Baseball in 2015. This is the going rate for a top pitcher these days.

As a matter of fact, Major League Baseball players are earning a much lower percentage of league revenues than they did a dozen years ago. Back in 2002, MLB player salaries were 56% of league revenues, but it’s been dropping steadily ever since. Their share dropped below 40% in 2014. That’s a significant decrease. Imagine how much pitchers like Price and Greinke would be making if the players’ share of league revenue hadn’t declined so much in that time period. Where is that money going now? In the pockets of the owners, of course. Baseball is flush with money these days and player contracts reflect that, but they could actually be making much more than they are now. Instead, the owners are making it.

In the world where most of us reside financially, it seems ridiculous to have a professional athlete make that much money, especially when compared to a teacher, a construction worker, a police officer, or any other job where people put in a good day’s work to make enough money to pay their rent and feed their family. This is where it can be frustrating for fans. Most of the people sitting in the stands or watching the games on the electronic device of their choice will never come close to making the annual salary of a major league rookie (around $500,000).

And it’s not just sports. There are plenty of other high-income fields with ridiculous salaries. According to Forbes.com, movie star Robert Downey Jr. will make $80 million in 2015. Jackie Chan will make $50 million. Vin Diesel will make $47 million. On the small screen, Jim Parsons, who plays Sheldon Cooper on The Big Bang Theory, makes $29 million per year. His TV roommate, Leonard, played by Johnny Galecki, makes $27 million. Even smarmy Howard Wolowitz (Simon Helberg) and his awkward buddy Raj (Kunal Nayyar) will each make $20 million.

Howard Stern earned $95 million between June 2014 and June 2015, with $80 million of that coming from Sirius XM satellite radio. Ellen DeGeneres made $75 million in that time span. Thanks to his long-running talk show and the release of his 13th book, Dr. Phil McGraw made $70 million. Kim Kardashian nearly doubled the amount she made from the previous year thanks to her role-playing app Kim Kardashian: Hollywood. She made $52.5 million from June 2014 to June 2015.

The simple fact is, athletes and entertainers are making million and millions of dollars because we spend our money to watch them. It’s very easy to say that a famous athlete or actor shouldn’t make 500 times as much as a schoolteacher, but we all make choices in how we spend our money and those choices dictate how much the athletes we love to watch will earn. We go to the games, we watch the movies, we subscribe to cable or Netflix so we can watch our favorite shows. Every time we choose to spend our money on entertainment, we’re contributing to the high salaries these people are making.

I have friends who are continually shocked by the big contracts that baseball players sign. They think it’s ridiculous. When I get into a conversation with these people about this topic, I always think about this quote by Bill James from the book, The Mind of Bill James: How a Complete Outsider Changed Baseball (2006):

“One of the unwritten laws of economics is that it is impossible, truly impossible, to prevent the values of society from manifesting themselves in dollars and cents. This is, ultimately, the reason why we pay athletes so much money: that it is very important to us to be represented by winning teams. The standard example is cancer research; letters pop up all the time saying that it is absurd for baseball players to make twenty times as much money as cancer researchers. But the hard, unavoidable fact is that we are, as a nation, far more interested in having good baseball teams than we are in finding a cure for cancer.

That pool of money which we pour into athletics makes it inevitable that athletes are going to be better paid than cancer researchers. Dollars and cents are an incarnation of our values. Economic realities represent not what we should believe, not what we like to say we believe, not what we might choose to believe in a more perfect world, but what our beliefs really are. However much we complain about it, nobody can stop that truth from manifesting itself.”

I live in Washington state, one of only seven states that does not have a state income tax. During the Great Depression in the early 1930s, Washington came very close to instituting a state income tax. Times were very hard back then and people were struggling just to put food on the table. Voters first voted to change the constitution to allow an income tax, then voted to approve the tax, with 70% in favor. An income tax was more popular among the voters than bringing back the sale of beer.

Local business owners could see where this was headed, so they challenged the tax in court. In 1933, this challenge reached the Supreme Court in Olympia and was voted down 5-4. Since then, a state income tax has come up for a vote seven times and voters have rejected it every time.

A measure was on the 2010 ballot that would have created an income tax on earnings over $200,000. This tax would affect fewer than 70,000 people out of the state’s 6.7 million residents and would provide money for education and health care. It was rejected by 65 percent of the voters. A dozen years before, voters had approved funding for the construction of CenturyLink Field, home of the Seahawks, even though the Seahawks’ Paul Allen is the NFL’s richest owner, worth $17.5 billion. I’m sure if you ask residents of Washington which is more important, education and health care or professional sports, they would say education and health care. But how they chose to spend their money says otherwise.

Income inequality has been and will be a big topic in the news over the next year. Not to get into the politics of the issue, but the statistics are clear. There is a growing disparity between what the majority of people in this country earn and what the richest people in this country earn.

In the most simple terms possible, the rich are getting richer. We often hear about the growing disparity between what the top 1% earns compared to the other 99%. It’s true; the gap has grown significantly over the last 30 years. Looking at the difference between the top 1% and the other 99% doesn’t tell the full story, though.

This IRS report showed the top 1% had an adjusted gross income (AGI) of $434,600 or more in 2012. The MLB minimum salary in 2015 was $507,500, which means every player in the major leagues is in the top 1%. It’s the level above the top 1% where the disparity is even greater and the gap is growing more quickly. The top .01% of tax returns in 2012 had an AGI of $12 million or more. Of the roughly 750 players in Major League Baseball in 2015, 121 made at least $10 million, which is about 16%. We could estimate that 10-15% of MLB players are in the top .01% of income earners.

The top .001% of tax returns had an AGI of $62 million. No player is in that range yet, but Bryce Harper will be a free agent heading into his age-26 season in 2019. With Zack Greinke having just signed a contract worth $34.4 million per year, will Bryce Harper be baseball’s first $50 million per year player in three years? If he stays healthy, we all know he will sign a record-setting contract. When he does, it’s very likely that our friends who don’t grasp the economics of Major League Baseball will lament the fact that a baseball player is making so much money. Then they’ll go to the theater and spend $15 to watch a movie starring an actor making $60 million and think nothing of it.


Breaking Down the Astros’ 2015 Offensive Changes

The Astros were baseball’s biggest surprise of the 2015 season. Few will dispute that. This was, however, preceded by some of the worst seasons in Houston history. They posted three consecutive 100+ loss seasons from 2011-2013 followed by a somewhat bounceback 2014 campaign, posting a 70-92 record. Although they were not quite back to the winning tradition that ‘Stros fans enjoyed during the late 1990’s and early 2000’s, young potential began to show, headed by silver slugger Jose Altuve. The combination of young talent with free agent and trade market moves led to an unexpected 86-76 season and the first playoff birth since 2005 (where they eventually got swept by the White Sox in the Fall Classic). Part of this success was due to a new-found, solid bullpen and front five led by Cy Young winner Dallas Keuchel. However, the more exciting part of their success — at least for the average fan — was the explosive offense.

Houston’s 2015 opening day lineup included four new players to the organization: Luis Valbuena, Jed Lowrie, Colby Rasmus and Evan Gattis, all of which had 15+ home run seasons in the past. These lineup changes were complemented by a new hitting coach in Dave Hudgens, who preaches that being aggressive in the zone leads to a higher OBP, harder hit balls, and more runs scored. This proved to be a highly successful match, as the Astros posted impressive power numbers. They were second in the league in ISO, SLG, and home runs (all behind the Blue Jays), according to fangraphs.com. Their team wRC+ of 105 was 4th best in the league and was the best wRC+ since back in 2000 – the first year of Minute Maid Park. The most recent yearly changes have been the most impressive numbers, however.

From 2014 to 2015, they had the biggest increase in all three aforementioned categories of any team in baseball, adding 67 home runs, .046 ISO, and .054 SLG. They also increased their Z-swing% by 3.5% to 70.2%, the highest in the league and right in line with Hudgens’ approach. Surprisingly, they did this while decreasing their K% (albeit only by 0.9%). This leads to the question of how big of an impact Hudgens had on the organization and its multitude of young power hitters.

There were 11 Astros who had double-digit home runs, all who are younger than 30 years old. Five of those players broke the 20-home-run mark (Gattis – 27, Rasmus – 25, Valbuena – 25, Chris Carter – 24, Carlos Correa – 22). This is not including 29-year-old Carlos Gomez who was acquired in the latter half of the season, who only hit 12 home runs throughout his injury-plagued 2015 season. With so much raw power and youth in the organization, an active hitting coach is crucial to develop successful hitting approaches and general consistency at the plate. Hudgens seems to have been very successful in extracting the most out of his hitters in his first year.

Many of these hitters took strides to becoming more balanced at the plate. For example, slugger George Springer who posted a miserable 33.0% K% in his 2014 rookie campaign came down to a more reasonable 24.2% in 2015 while posting an above-average ISO of .183. The biggest surprise in this is that that is his lowest strikeout rate of any full year in his baseball career, including rookie and high-A ball. Another highly noticeable change is the power numbers of All-Star second baseman Jose Altuve. Known for being more of a contact hitter, the 5’6″ Venezuelan hit 15 home runs (the first double-digit home run season for Altuve) and improved his ISO from a below-average .112 in 2014 to a career high of .146. Teammates Luis Valbuena and Colby Rasmus also posted career highs in ISO at .214 and .236, respectively.

The good news for Astros fans is that this offense appears sustainable. The BABIP numbers of these Astros hitters slightly decreased for the most part. The glaring exception is George Springer, who had a BABIP of .342 compared to his rookie year’s .294 (but with his strikeout rate decreasing 8.8% and OBP increasing by .031, only time will tell if he can continue his impressive numbers at the plate once pitchers adjust and approach him differently). The Houston front office has built an offense around around younger hitters with a lot of raw power. This is not to mention their speed, as they ranked 3rd in stolen bases last year. So although the AL West has shown to be unpredictable in recent years, the way the Astros have built their team may very well provide some sustainability for them moving forward.

Side note – don’t expect the Astros to remain quiet in the off-season just because of their youth-heavy core. They have already begun shopping Jake Marisnick after retaining Colby Rasmus with a 15.8MM qualifying offer.


Hard-Hit Percentage Outliers

In the middle of June, I wrote an article looking at batted-ball data. Specifically, I grouped players into tiers based on their hard-hit percentage and looked at the statistics accumulated by the players in each group, then identified the outliers. This is a look back at that article to see if we can learn anything.

To start with, the following charts show a comparison of the correlation of other metrics to the different strengths of batted balls hit. I did this in the middle of June and will compare that chart to one I created using statistics for the entire season. In June, I used a cut-off of 150 plate appearances through June 14. This was right around the 60 game mark of the season. There were 236 players. At the end of the season, I used 350 plate appearances as the cut-off, which consisted of 249 players.

Noticeable here is the strengthening of the correlation for the power statistics with hard-hit percentage as more data came in. The three stats dealing the most with power—ISO, HR/FB, and slugging percentage—all saw an increase in their correlation with hard-hit percentage. This is true down the column until you get to batting average and BABIP, which showed a weaker correlation over a full season than over the first two and a half months. While ISO, HR/FB, and SLG all correlate with hard-hit percentage at .70 or above, batting average and BABIP are down around 0.10, and LD% is at .06.

In the June article, I separated the players into groups based on their hard-hit percentage. As you would expect, the players who hit the ball hard a higher percentage of the time were more productive hitters. Here is the breakdown again, first the chart through June 14, then the full-season chart.

Remember, these aren’t necessarily the same players within tiers in both tables. Some players could have moved from one tier to another as the season went on and more players qualified overall for the full season. The way to look at this is to go down the columns to see how the average statistics for each group change as hard-hit percentage goes down. It’s easy to see that the groups of players in the higher ranges of hard-hit percentage are more productive than the groups of players in lower ranges of hard-hit percentage. The players in the upper tier, with a hard-hit percentage of 35% and above, hit more fly balls, had more of those fly balls go over the fence, had a higher batting average, slugging percentage, and isolated slugging. Roughly 85% of these hitters had a wRC+ at 100 or better. The least productive tier was the group of players with a hard-hit percentage at 24% or below. A small number of these players were able to be league average or better hitters.

The numbers from June are similar to the numbers for the full-season. As hard-hit percentage goes up, offensive production goes up and the percentage of players who are above-average hitters (by wRC+) goes up. A similar trend emerges for ISO, fly-ball percentage, HR/FB%, and slugging percentage.

The interesting players to me are the ones in the minority among their group of hitters. Through June 14, there were seven players in the top tier who had a hard-hit percentage greater than 35%, but with a sub 100 wRC+. These players consistently hit the ball hard but were still below-average hitters. Considering how often they hit the ball hard, I expected these players to improve and more closely match the rest of the group from this point forward. Theoretically, these are the guys with upside based on their hard-hit percentage. At least, this was my hypothesis. How did these players do over the rest of the season?

The seven players who hit the ball hard a high percentage of the time but who had a wRC+ below 100 through June 14 are shown below. The following chart shows the performance of these seven hitters before and after June 14.

*note—to determine the wRC+ of the group, I just did a weighted average based on each player’s plate appearances. The other numbers are precise totals for the group.

These players did improve as a group, with their composite batting line going from .237/.292/.387 to .252/.305/.455. They improved even though their BABIP dropped from .289 to .286. The big increase was in their power. They hit more fly balls and had more fly balls go for home runs. Their ISO increased from .151 to .203 and their wRC+ went from 86 to 106.

Two of these players had fewer than 60 plate appearances after June 14, so they aren’t very helpful to us. Of the remaining five players, two stayed close to the level they had established by June 14 and the other three showed strong improvement. Here is a closer look at these players:

Jorge Soler was essentially the same hitter before and after June 14, right down to an identical 96 wRC+. His BABIP dropped from a sky-high .383 to a still very good .339, but he also struck out less often and his hard-hit percentage dropped from 39.5% to 32.3%. His hard-hit percentages in both portions of the season suggest he should have hit better than he did, but his low fly-ball percentage limited his power. Over the course of the whole season, Soler had a hard-hit percentage of 35.9%. That puts him in the top tier. The players in this tier of hitters had an average fly-ball percentage of 38%. Soler’s fly-ball percentage was 29.8%, which corresponds with the players on the lowest tier of hard-hit percentage, those players below 24%. Basically, Soler hit the ball hard as often as guys like Adrian Gonzalez, Bryan Braun, and Yoenis Cespedes, but hit the ball in the air as often as Gregor Blanco and Alcides Escobar. While he hits the ball hard with regularity, he doesn’t hit enough fly balls to take advantage of his hard-hit percentage.

Like Soler, Jay Bruce’s overall production did not improve. His wRC+ dropped slightly, from 96 to 90 even though he maintained a high hard-hit percentage. The shape of his production changed, though. He hit for much more power, with an ISO that was .040 higher after June 14 than before, but a corresponding drop in walk rate torpedoed his on-base percentage. The overall effect was going from hitting .212/.324/.394 through June 14 to .234/.277/.457 after June 14. Jay Bruce is a mystery. He had a top-tier hard-hit percentage and hit the ball in the air frequently enough, but his production didn’t compare to the other players with similar profiles.

Mark Trumbo was one of three players in this group who did improve a significant amount. Trumbo hit .242/.276/.445 through June 14 and .276/.333/.451 after. His wRC+ increased from 93 to 119 even though his hard-hit percentage dropped from 35.2% to 31.7%. The biggest change for Trumbo was an increase in BABIP from .280 to .337 and an increase in walk rate from 4.5% to 8.0%.

Both Will Middlebrooks and Matt Adams did not have enough plate appearances after June 14 to tell us much of anything.

Steve Pearce improved his wRC+ from 79 through June 14 to 106 from June 15 on even though his hard-hit percentage cratered from 35.6% to 25.4%. His BABIP was nearly the same. His walk rate and strikeout rate changed very little. He didn’t improve his on-base percentage by much. The big difference was an increase in slugging percentage from .365 to .471 with a corresponding increase in ISO from .153 to .248. He did this by greatly increasing the number of balls he hit in the air. His fly-ball rate through June 14 was 39%. After, it was 53%. That seems like a drastic change to me, so I wonder if Pearce made the decision to go all out for power by hitting fly balls as often as he could.

The final guy on this list was the greatest success story of this group, Matt Kemp. Kemp was terrible in the first part of the season. When I initially wrote about batted-ball data on June 14, Kemp was hitting .249/.289/.340 even though his hard-hit percentage of 35.8% was in the upper tier of hitters. From June 15 on, Kemp hit .270/.328/.519 with a hard-hit percentage of 45.5%. He hit fly balls at a higher rate (31% to 39%) and more of those fly balls left the yard (3.4% HR/FB% to 20.6% HR/FB%). Kemp’s ISO improved from .091 to .242 and his wRC+ went from 78 to 133.

This is a small group of players, so it is not an in-depth study. Also, two of this group of seven players didn’t have enough plate appearances to be meaningful. Of the remaining five players, three did significantly improve, while the other two continued their subpar ways.

The other group of hitters that interested me was the group of nine that had a wRC+ greater than 100 despite a hard-hit percentage below 24% through June 14. These players were somehow able to be above-average hitters despite carrying such a low hard-hit percentage.

The following chart shows these nine players (out of a group of 44) who had hard-hit percentages below 24% but with a greater than 100 wRC+. The top chart shows what they did through June 14 and the bottom chart shows what they did from June 15 on. My hypothesis was that these players would hit worse because their low hard-hit percentage would not let them sustain their above 100 wRC+.

As a group, these nine hitters went from hitting .313/.366/.404 through June 14 to .271/.315/.386 after June 14. They saw their combined wRC+ drop from 117 to 91. Only three of these nine hitters continued to have a wRC+ over 100 from June 15 on. The glaring change in BABIP from .353 to .303 for the group is likely a main culprit in their diminished production. They also walked less often and struck out more often.

Nori Aoki was the leader in wRC+ among this group of hitters on June 14th. Had he been able to sustain that for a full season, it would have been a career year. Unfortunately, he suffered a broken leg when he was hit by a pitch from Carlos Frias about a week later and wasn’t the same hitter when he came back. He also dealt with concussion issues and didn’t play after September 3. He was much worse after June 14 but injuries were obviously a big factor.

Jacoby Ellsbury was already on the DL with a knee injury at the time I wrote the original article. He missed close to seven weeks in May, June, and July and really struggled upon his return. His hard-hit percentage was just slightly lower than it had been before but his BABIP plummeted from .379 to .261 and his walk rate dropped significantly also (11.2% to 4.8%). Like Aoki, injuries were probably a big factor in Ellsbury’s diminished production.

Jose Iglesias also dealt with an injury, like Aoki and Ellsbury, but his was in September and cause him to miss the last month of the season. He had already declined from a 125 wRC+ through June 14 to an 80 wRC+ from that point forward. His BABIP dropped from .367 to .302 despite an increase in hard-hit percentage from 13.7% to 17.9%. Even with that increase, a 17.9% hard hit percentage is ridiculously low. With a hard-hit percentage that low, I wouldn’t expect Iglesias to be anywhere close to a league-average hitter going forward.

Billy Burns had the lowest hard-hit percentage (13.6%) of any qualified hitter over the entire season and the highest soft-hit percentage (30.5%). He rode a .366 BABIP to a well above average 120 wRC+ through June 14. From that point forward, his wRC+ was 97, with a BABIP of .328. Over the whole season, Burns had a 102 wRC+ despite such a low hard-hit percentage. Like Iglesias, I wouldn’t expect Burns to be league average as a hitter next year either.

Salvador Perez and Jace Peterson both increased their hard-hit percentage but still saw a drop in their wRC+ by a significant amount. Perez had fewer fly balls leave the yard (15.2% HR/FB% to 10.6% HR/FB%) and his already mediocre .292 BABIP dropped to a less-than mediocre .257. Peterson had a 106 wRC+ and .339 BABIP on June 14, with a hard-hit percentage of 23.8%. From that point forward, his hard-hit percentage was an improved 27.6%, but his BABIP was .266 and he had a 63 wRC+.

Yunel Escobar and Ian Kinsler were the only two players among this group of nine who saw an increase in wRC+ after June 14. They also greatly increased their hard-hit percentage. Yunel’s hard-hit percentage went from 23.9% to 30.4%. Kinsler’s increased from 22.1% to 28.6%. Both of these hitters were below their career rate of hard-hit balls as of June 14 and hit closer to their career marks from that point forward, which was likely a factor in their improved production.

Dee Gordon joined Escobar and Kinsler in maintaining a wRC+ over 100, but he did see a drop from 118 to 109. His BABIP through June 14 was a ridiculous .418. From that point forward, it was a silly .357. His hard-hit percentage barely changed at all (17.7% to 17.5%). Gordon has had a very low hard-hit percentage every year of his career. His production is very dependent on a high BABIP. In the three seasons when he’s had a BABIP of .345 or higher, his wRC+ was 94, 101, and 113. In the two seasons when he had a BABIP below .300, his wRC+ was 58 and 73.

Overall, just two of these hitters had an improved wRC+ after June 14 and both of those hitters also increased their hard-hit percentage. A third hitter, Dee Gordon, had a worse wRC+ after June 14 but was still an above-average hitter (109 wRC+). The other six hitters in this group were significantly worse after June 14.

This is a look at individual outliers and there are factors beyond hard-hit percentage that come into play, but I do think hard-hit percentage can help us when analyzing a player’s production during the season.


Trying to Figure Out What the Angels Are Doing

The Angels are an odd team. They are perennially competing for a spot in the playoffs and in 2014 they had the best record in the AL, but each year it seems that they are out-performing their talent.

The simplest explanation is that the team is buoyed by Mike Trout, which is true. A team with the best player in baseball, and always one of the highest payrolls in baseball, should not be lagging this much. The Angels should be more than a perennial playoff contender. They should be World Series contenders. So, if there ever was a time for Arte Moreno to hand out his money, it’s this off-season which provides the Halos with everything they need to resolve the biggest issues the team faces.

They currently have $130,278,770 in payroll obligations, excluding pre-arbitration and arbitration-eligible players. The Angels carried payrolls of $168,299,326 and $151,298,162 in 2014 and 2015, respectively. MLB Trade Rumors projects $20,100,000 in arbitration salaries for six players, which brings the Angels 2016 payroll for 14 players to $150,278,770. If you leave three spots open on the 40-man roster, giving the Angels three players to add through free agency, and estimate that the remaining 23 players will cost the Angels $500,000 each, or $11,500,000 total, it would bring the payroll to a best-case scenario of $161,728,770.

Arte Moreno has said he would cross the luxury tax threshold, but that seems more like PR than an actual possibility, so I’ll cap the potential payroll at $189,000,000. That leaves the Angels with $27,271,230 of money to spend before surpassing the luxury tax threshold.

The Angels could use an upgrade to their DH/1B depth and a player like Mike Napoli would fit well with them, but that’s not a pressing need. The bullpen is also an area that could improve, however it’s not really a dire situation.

The most glaring holes on the Angels roster are the third base position and a corner outfield spot. Technically, it’s left field, but Kole Calhoun can play in any corner, so someone who plays either right or left field would work. For that matter, they would be fine with a center fielder because Trout could probably flex out of center field if needed.

A trade, at least a meaningful one, is out of the question because the Angels gave up their only valuable assets in the Andrelton Simmons deal. That may have been a pretty big mistake depending on how much money they plan to spend this offseason.

There does not seem to be a better fit for the Angels than Daniel Murphy. He could be the solution they have been seeking in their search for a left handed bat to slide in the middle of the order. Murphy’s defensive ability, or lack thereof, is somewhat overblown. Metrics tend to be fairly neutral on him, and some of his misadventures at second base overshadow the fact that he’s a competent third baseman. That is where he would best serve the Angels. FanGraphs’ contract crowdsource pegs Murphy for a contract with a $12,000,000 average annual value. I think Murphy could end up getting more than that, but let’s roll with that. The Angels are now down to $15.3 million.

That brings us to the outfield. Jason Heyward, Yoenis Cespedes, and Justin Upton would all fit in Anaheim. However, the Angels could only afford one of them if they backload the contract, which is possible, but set that possibility aside for the moment.

The other options would be Denard Span, Gerardo Parra, Nori Aoki, and Rajai Davis.

Span would seem to be an unnecessary injury risk for a team that would need him on the field to compete for a World Series and does not have a great backup option for the position. However, a healthy Span is a good fit with the Angels. He would add some much needed speed to that lineup and would probably fit in their budget, costing around $12,000,000 on a three-year contract.

Alternatively, a platoon of Nori Aoki or Gerardo Parra with Rajai Davis would probably cost the team around $10,000,000 combined and would provide competent left field options.

The issue with Span or an Aoki or Parra/Davis platoon is that it just puts the Angels back where they were: in the mix. It doesn’t distinguish them, and it doesn’t make them World Series contenders. It’s not improbable that a team with Murphy and one of the lesser outfield options could make a World Series run, it’s just also not improbable they would be sitting at home in October.

And that’s my potential issue with the Andrelton Simmons trade.

There’s been some discussion on the best way to use minor league resources in light of the Red Sox’s trade for Craig Kimbrel. However, I think it’s much more interesting to examine the issue by looking at the Angels and what they gave up in their trade for Andrelton Simmons.

Sean Newcomb was one, and maybe the only, valuable asset that the Angels possessed that they could move in an attempt to improve the team. They undoubtedly did that by getting Andrelton Simmons, but Simmons didn’t solve any immediate issues. He’s an improvement over Erick Aybar, but Erick Aybar really wasn’t an issue. And the trade begs the question, are the Angels looking past this year? The main benefit of Simmons is what he brings the team in 2017 and 2018, being a very good shortstop under a reasonable contract.

I don’t know if Billy Eppler shopped Newcomb around for a player like Carlos Gonzalez or any other available outfielders. Maybe Newcomb wasn’t enough. And Jay Bruce seems like a good fit, but Jay Bruce is a bet; he’s one of those players whose reputation of past performance seems to outpace his recent performance (Bruce had -.9 WAR in 2014 and .1 in 2015. Steamer projects him to have a .6 WAR in 2016).

Maybe Billy Eppler has all the money he needs to add Heyward, Cespedes, or Upton, or maybe he’s convinced he has the ability to add one of them on a back-loaded contract. Jeff Weaver and C.J. Wilson are off the payroll next year and all payroll obligations owed to Josh Hamilton will be off the books after 2017, so the financial situation looks better in the future.

And there are a lot of alternatives here. The Angels could band-aid third base by bringing back David Freese, or adding Juan Uribe. That may leave them with enough money to bring in one of the marquee free agents, but it still leaves them short of being a baseball powerhouse. It just makes them another good team with a shot at making the playoffs.

All of this is to say that the Angels are an interesting team. Mike Trout keeps them on the brink of being very good each year, but if Arte Moreno is willing to spend like the Dodgers and Yankees the Angels could be great. If they added Daniel Murphy and Jason Heyward they would have to be considered one of the best teams in the league. However, if they added Simmons at the cost of only being able to address either their third base or corner outfield issue instead of addressing both, then it seems like a misuse of their only minor league asset, and of Mike Trout’s greatness.


KC’s Secret Sauce: Age-Defying Player Development

The 2006 Kansas City Royals went 62-100, tallying the team’s fourth 100-loss record in five years. In June of this particular season, owner David Glass hired a new general manager, Dayton Moore. ESPN’s first reaction was that Moore could have waited for the GM job with the Braves, who unlike the Royals were an “admired organization.” Jason Whitlock, who was in the midst of a 16-year stint as a writer for the Kansas City Star, declared that Moore was owner David Glass’ new scapegoat, and would soon be undermined by Glass’ “cheapness and incompetence.”

It took Dayton Moore a while to gain respect in Kansas City. In January of 2014, the last off-season that Moore’s Royals would endure without a World Series appearance, Royals Review mocked Moore’s tenure in Kansas City, which still only had one winning season.

Dayton Moore’s professional history before moving to Kansas City seemed to be the opposite of what a modern general manager was supposed to be. While the league’s front offices frantically shifted towards advanced statistics, Moore’s background was in scouting and player development. He established an excellent analytics office in the Royals’ organization, but his expertise and focus were drafting and signing promising young athletes and patiently developing the right type of team.

It worked, slowly. In 2009, they won 65 games. Then they won more in 2010 — and again in 2011, 2012, 2013, 2014, and 2015.

For six straight seasons, the Royals won more games than in the year before. They are the only team since World War II to do that. And they did it by being better than the rest of the league at exactly what Moore was supposed to do: develop talent.

In 2013, Jeff Zimmerman found that aging curves in baseball were changing. The fascinating and significant article showed that, in general, hitters no longer improved throughout their 20’s.

Dayton Moore’s Royals did not get the memo, and this may be what sets them apart from the rest of the league more than anything else. Sure, their bullpen is historically dominant. Yes, their solid and spectacular defense is remarkable. Their contact ability is extreme.

But all of these factors ignore something else that the Royals do historically well. Their hitters keep getting better, at points in their career when they are not supposed to.

From the ages of 23 to 26, Alex Gordon had a wRC+ of 93. That is not supposed to get better. From the age of 27 to 31, his wRC+ has been 123.

From the ages of 25 to 27, Lorenzo Cain had a wRC+ of 86. That is not supposed to get better. In his age 28 and 29 season, his wRC+ has been 121.

From the ages of 22 to 25, Mike Moustakas had a wRC+ of 82. This year, at age 26, it was 124.

This year, career 104 wRC+ hitter Eric Hosmer hit 125 at the age of 25.

Possibly most importantly for the 2015 team, Kendrys Morales followed up a 71 wRC+ season at the age of 31 with a 131 mark this year.

These players are not extremely old. None of them are at a point in their careers where they should be falling off a cliff, but recent history suggests that they should be stagnating, at best. But that’s not what the Royals have done.

Since Dayton Moore’s first full season in 2007, there have been plenty of mid-career surprises.

To create an aging curve, I measured the difference in wRC+ between consecutive seasons in which players had at least 300 PA. Then, I made every season relative to the performance at age 26, because that appears to be the first year of plateauing for the whole MLB. (Note: The results are not identical to Zimmerman’s).

From 2007-2015, with Age 26 being normalized to 100, here is what we get:

Aging Curve

Royals players dramatically improve from their early 20’s all the way until they turn 30. While the sample size is not huge, the consist improvement is remarkable. Kansas City’s players show greater improvement than MLB average at age 25, 26, 27, 28, and 30. This feat is doubly difficult when you consider that a lucky season at age 27 should naturally show a decline at age 28.

Dayton Moore and the Royals organization are rightly being showered with praise after their second consecutive World Series appearance and their seemingly invincible run through the 2015 playoffs. But their formula of success is not a frozen-in-time snapshot of the 2015 team. Player production in one year does not define the strengths of the Royals organization. Rather, the possibility that it could be even better next year does.