Author Archive

KC’s Secret Sauce: Age-Defying Player Development

The 2006 Kansas City Royals went 62-100, tallying the team’s fourth 100-loss record in five years. In June of this particular season, owner David Glass hired a new general manager, Dayton Moore. ESPN’s first reaction was that Moore could have waited for the GM job with the Braves, who unlike the Royals were an “admired organization.” Jason Whitlock, who was in the midst of a 16-year stint as a writer for the Kansas City Star, declared that Moore was owner David Glass’ new scapegoat, and would soon be undermined by Glass’ “cheapness and incompetence.”

It took Dayton Moore a while to gain respect in Kansas City. In January of 2014, the last off-season that Moore’s Royals would endure without a World Series appearance, Royals Review mocked Moore’s tenure in Kansas City, which still only had one winning season.

Dayton Moore’s professional history before moving to Kansas City seemed to be the opposite of what a modern general manager was supposed to be. While the league’s front offices frantically shifted towards advanced statistics, Moore’s background was in scouting and player development. He established an excellent analytics office in the Royals’ organization, but his expertise and focus were drafting and signing promising young athletes and patiently developing the right type of team.

It worked, slowly. In 2009, they won 65 games. Then they won more in 2010 — and again in 2011, 2012, 2013, 2014, and 2015.

For six straight seasons, the Royals won more games than in the year before. They are the only team since World War II to do that. And they did it by being better than the rest of the league at exactly what Moore was supposed to do: develop talent.

In 2013, Jeff Zimmerman found that aging curves in baseball were changing. The fascinating and significant article showed that, in general, hitters no longer improved throughout their 20’s.

Dayton Moore’s Royals did not get the memo, and this may be what sets them apart from the rest of the league more than anything else. Sure, their bullpen is historically dominant. Yes, their solid and spectacular defense is remarkable. Their contact ability is extreme.

But all of these factors ignore something else that the Royals do historically well. Their hitters keep getting better, at points in their career when they are not supposed to.

From the ages of 23 to 26, Alex Gordon had a wRC+ of 93. That is not supposed to get better. From the age of 27 to 31, his wRC+ has been 123.

From the ages of 25 to 27, Lorenzo Cain had a wRC+ of 86. That is not supposed to get better. In his age 28 and 29 season, his wRC+ has been 121.

From the ages of 22 to 25, Mike Moustakas had a wRC+ of 82. This year, at age 26, it was 124.

This year, career 104 wRC+ hitter Eric Hosmer hit 125 at the age of 25.

Possibly most importantly for the 2015 team, Kendrys Morales followed up a 71 wRC+ season at the age of 31 with a 131 mark this year.

These players are not extremely old. None of them are at a point in their careers where they should be falling off a cliff, but recent history suggests that they should be stagnating, at best. But that’s not what the Royals have done.

Since Dayton Moore’s first full season in 2007, there have been plenty of mid-career surprises.

To create an aging curve, I measured the difference in wRC+ between consecutive seasons in which players had at least 300 PA. Then, I made every season relative to the performance at age 26, because that appears to be the first year of plateauing for the whole MLB. (Note: The results are not identical to Zimmerman’s).

From 2007-2015, with Age 26 being normalized to 100, here is what we get:

Aging Curve

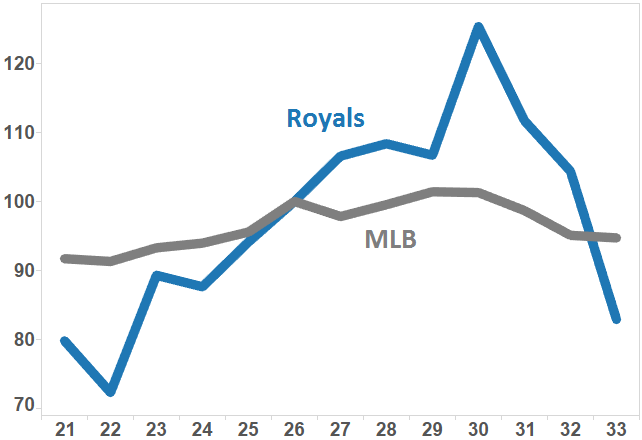
Royals players dramatically improve from their early 20’s all the way until they turn 30. While the sample size is not huge, the consist improvement is remarkable. Kansas City’s players show greater improvement than MLB average at age 25, 26, 27, 28, and 30. This feat is doubly difficult when you consider that a lucky season at age 27 should naturally show a decline at age 28.

Dayton Moore and the Royals organization are rightly being showered with praise after their second consecutive World Series appearance and their seemingly invincible run through the 2015 playoffs. But their formula of success is not a frozen-in-time snapshot of the 2015 team. Player production in one year does not define the strengths of the Royals organization. Rather, the possibility that it could be even better next year does.


The Disappearing Downside of Strikeout Pitchers

In 1977, Nolan Ryan was in the midst of his dominant tenure pitching for the California Angels. Four years before, he had broken Sandy Koufax’s modern strikeout record, and his stuff wasn’t going away. The 30 year-old finished the ’77 season three outs shy of 300 innings, and struck out 10.3 batters per nine innings. Those 341 strikeouts came with a home run rate 60% lower than league average.

Yet, somehow, Ryan was not the best pitcher in baseball that season. He finished 3rd in AL Cy Young voting. In the majors, he was 4th in pitcher WAR, 10th in Wins, 7th in ERA, and 9th in FIP. So how could such an unhittable season be so clearly something other than the best in baseball?

In 1977, Nolan Ryan walked 204 batters. That is 5.5 walks per start. With Tom Tango’s Linear Weights, we can say that Ryan’s walks cost the Angels over 60 runs, which is ~30 runs worse than if he had a league-average walk rate. Batters were fairly helpless against Nolan Ryan, but what help they did get, they got from him.

In the 1970’s, this phenomenon was not unheard of. Pitchers who struck the most hitters out tended to walk the most as well. (Note: for this article, I’m including pitchers who threw 140+ innings)

K BB 1970s

For every additional 5-6 strikeouts, you could expect an additional walk from a pitcher. This is not surprising for a few reasons. The main two that come to my mind are:

1) If a pitcher strikes out a lot of hitters, then GM’s and managers will be more willing to tolerate a lack of control, and
2) Harder throws, nasty movement, and a focus on offspeed pitches can lead to strikeouts and make balls harder to locate.

It seems natural that there would be a positive relationship here, and it goes along well with the idea that flamethrowers are wild.

But could that relationship be going away? Here’s the same chart, but instead of being the 1970’s, this is for the year 2010 and on:

K BB 2010s

In this span, it takes 20 strikeouts to expect an additional walk. There’s still a relationship, but it’s much looser.

And while it’s possibly irresponsible to look at sample sizes this small, the relationship was almost completely gone last year. If we only look at 2014 pitchers, we see the following:

K BB 2014

Given that the model here suggests that 300 strikeouts lead to one walk, I think it’s safe to say there wasn’t a meaningful relationship between strikeouts and walks last year.

It’s important to note that this is a continued trend. There has not been a specific time when strikeout pitchers decided to stop walking people. Broken up by decade, this is something that has constantly been occurring over the last 40 years.

K BB Correlation Decades

I’m not exactly sure what the big takeaway from this is, but I’m more curious about what is causing this shift. As far as the results from such a change, I do not believe this explains the drop in offense, since the trend continued through the booming offense of the late ’90s and early 2000s.

Maybe player development is better than it used to be. If coaches can better address player weaknesses, it would be possible for pitchers to be more well rounded.

Perhaps teams are less willing to tolerate players with large weaknesses, even if they are strong in another area. I find this theory unlikely in an age when almost any strength can be valued and measured.

It’s possible that pitchers try to strike batters out differently than they used to. Maybe they used to be more likely to try to get hitters to chase balls out of the zone to get a third strike, leading to more walks.

Most likely, it’s something that I am missing. But regardless, we are no longer in an era where a pitcher like Nolan Ryan leads the league in strikeouts, and you simply have to deal with his astronomical walk numbers. The modern ace is tough to hit and can command the zone, and there are plenty of them.


Baseball’s 10 Most Unusual Hitters

Baseball, more than any other major team sport, has the reputation for having the least athletic athletes. Jose Molina is obligated to, at times, sprint. Jorge de la Rosa must swing a baseball bat. David Ortiz sometimes has to play in the field. Having skills like catcher defense, pitching, and hitting with power will earn you playing time, and many players have such elite strengths that it’s worth it just to deal with those weaknesses. So many of baseball’s skills are unrelated that players have to spend a lot of time doing things they aren’t good at, at least relative to other MLB talent. A good way to make anyone look unathletic is to make them perform a long list of skills that have little to do with one another and compare them to the best in the world at those tasks.

I wanted to assemble a list of players who experienced something like this phenomenon the most frequently. Essentially, I wanted to see what players’ strengths and weaknesses were the farthest apart. To determine those players whose skills varied the most between themselves, I gathered what I consider to be the six stats that best describe what a player’s strengths and weaknesses are. BABIP and K% for contact, BB% for discipline, ISO for power, and Fielding and Baserunning values. I then gathered stats from 2011-2014 to better control for less reliable fielding metrics, assigned each player’s stats a percentile rank, and calculated the standard deviation of those six stats for each player.

For instance, Mike Trout’s attributes look like this:

Mike Trout

His strikeout rate has been higher than MLB average, but he is otherwise an exceptionally well rounded player, as we know.

The most evenly talented player in baseball has been Kyle Seager, who is almost in the middle third at every stat.

Kyle Seager

Many players have much more severe strengths and weaknesses. Here are the 10 players whose stats show the greatest variation from one another.

10. Dexter Fowler

Dexter Fowler

9. Ichiro Suzuki

Ichiro Suzuki

8. Jose Altuve

Jose Altuve

7. Curtis Granderson

Curtis Granderson

6. Mark Reynolds

Mark Reynolds

5. Giancarlo Stanton

Giancarlo Stanton

4. Miguel Cabrera

Miguel Cabrera

3. Darwin Barney

Darwin Barney

2. Adam Dunn

Adam Dunn

1. Ben Revere

Ben Revere

The whole list is fun to look through and play around with, so feel free to click here and look through all the qualifying players.


Baseball’s Most Under-Popular Hitters

Lists of baseball’s most underrated players are often interesting and thought-provoking exercises, because by definition they focus on players that tend to get less attention than they should. However, there isn’t an easy way to definitively say how players are “rated” by baseball followers. Writers often just list off players who have the attributes that they are looking for (grit, plate discipline, small market players, etc.), which isn’t a bad way of doing it.

However, there is a more scientific way of approaching a list like this. We could look at how many people are doing Google searches for specific players. It wouldn’t exactly tell us what players are most underrated, but it can tell us which players should be getting more attention; these two things are very tightly correlated. The key difference is that plenty of players get attention for things that don’t necessarily mean they are considered good players. Ryan Braun got a lot of attention during his steroid drama, Robinson Cano was heavily talked about during free agency, and people search for Carlos Santana because of this and this. But when good players draw very little interest from fans, they’re probably underrated. But the term I’ll use is under-popular.

Using Google’s Adwords Keyword Tool, I gathered the data on every player who has achieved a WAR of at least 3.0 since the beginning of the 2013 season. A regression model with those 132 players showed that an additional 1 WAR was worth 6,000 Google searches per month – not too shabby.

Here is a plot of these players, with the expected amount of Google searches on the horizontal axis, and the actual amount of searches on the vertical. While the keyword tool was incredibly useful, it rounds numbers when they get too high, and you can see a handful of players were rounded off to exactly 165,000 searches per month (FYI, these players were Mike Trout, Miguel Cabrera, David Ortiz, Robinson Cano, Bryce Harper, and Yasiel Puig). Derek Jeter has roughly double that amount, but his WAR did not qualify him for this list.

Searches vs. Expected

There are a lot of players who have played very well the last two years who are by no means household names. Welington Castillo has put up 3.8 WAR since the start of 2013, A.J. Pollock has been worth 6.1 wins, and Brian Dozier 5.8. In order to really measure who the most under-popular players are, I’ll use two methods. The first is just to simply subtract how many Google searches were expected and how many there really were.

difference

According to this measurement, Josh Donaldson is the most under-popular player in baseball, because he should have been looked up 53,000 times per month more often than he was (68k vs. 15k). That’s a big difference. There are some excellent players on this list, with many players who have an argument as the best or one of the few best players at their position. But for the most part, these are well known players who should just be more well known.

A different way to measure under-popularity, and the way I think is more telling, is to find the ratio between expected and actual searches, as opposed to just subtracting. For instance, is Edwin Encarnacion more under-popular than, say, Luis Valbuena? Encarnacion should have gotten 41,000 searches per month, but actually only got 18,000. Valbuena, however, played like someone who should have been searched 20,000 times, but was only Googled 2,400 per month. Since I believe Valbuena’s numbers are more out of whack, I prefer the second method.

Here are the top 20 players using that measurement, where we see how many times a player was searched as a percentage of how many times you would expect them to be:

Jarrod Dyson has quietly become a well above average baseball player. In about 800 career PA, Dyson has a WAR of 6.8. That is All-Star level production. His elite fielding and baserunning skills (which have combined to be worth more than 3 wins these last two years) make his wRC+ of 91 more than acceptable.

A.J. Pollock appears high on both lists, and for great reason. This year he is quietly hitting .316/.366/.554, after putting up 3.6 WAR last year.

This method of establishing players who deserve more credit for their play certainly has some flaws. WAR is not the only way to measure how good a player is, and Google searches are not a perfect representation of how popular or famous players are. However, it takes away the guess work and opinions from the standard underrated player lists, and in that there is some value.


Satchel Paige: Baseball’s Believable Myth

One of the biggest drawbacks of statistics is the how they can get in the way of our imagination. I’ve heard stories of how Pete Rose could will his team to victory on any given day of his career that spanned 23 years. Our stats claim that, actually, you can value his contributions at 80 wins. Rickey Henderson’s speed was electric and unfathomable, and no one can put a number on that, we’ve heard. FanGraphs says, really, his baserunning was worth 142 runs. Aroldis Chapman throws so hard, his fastball isn’t comparable to anyone else’s in baseball. Our data suggest that last year it was 7 runs above average.

While statistics have contributed significantly more than they’ve taken from us, it is occasionally fun to ignore them and just pretend the stories we want to believe are true. However, for a pitcher that is the focus of some of the most incredible tales in baseball history, a few stats from the end of his career are all the more reason to trust the absurd stories we have about him.

Satchel Paige pitched almost all of his professional baseball career in the Negro Leagues and barnstorming. He estimated that he played for 250 teams, though his “facts” about himself were often far from reality (for instance, he claimed that he never hit under .300, but he actually hit .097 in the majors). Baseball wasn’t integrated until Paige was 41 years old. Up until that point, he had built a legendary career that earned him the first Hall of Fame induction for any Negro Leagues player. Unfortunately, record keeping from these leagues was nearly non-existent, and almost no statistical evidence remains of his elite performances.

Stories of Paige paint a picture of arguably the most talented and entertaining pitcher to ever throw a baseball. As a teenager playing semi-pro baseball in Alabama, he supposedly got so mad at a poorly performing defense that he ordered his outfielders to sit down in the infield, where they watched him strike out the game’s last batter to complete his shutout with the bases loaded.

The greatest Negro Leagues hitter, Josh Gibson, once told Paige that he was going to hit a grand slam off of him in an upcoming game. With Gibson in the hole and one player on base, Paige intentionally walked the next two hitters, so Gibson would have an opportunity to hit a grand slam. Paige struck him out.

Joe DiMaggio called Paige the best pitcher and hardest thrower he had ever seen. Teammates claimed he could consistently throw his fastball over a gum wrapper. In his six exhibition matchups against Dizzy Dean (during two seasons in which Dean achieved a total WAR over 13), Paige won 4 games, and Dean said Paige’s fastball made his own look like a changeup.

Witnesses of Paige’s pitching would go on to tell countless other stories of his heroics, and a good number of them can’t be true. But what is possibly most remarkable is how historically effective he was when he was finally allowed to play in the majors, long after his prime.

Satchel Paige’s pitching demands were enormous, because through almost his entire career, people only paid to watch him pitch. He would frequently throw over 100 pitches in consecutive days. While his estimate of 2,500 games started is almost certainly exaggerated, he may very well have thrown more professional innings than anyone ever has. He pitched professionally for 22 years before Major League teams would allow him to join a roster; he would have done so with more financial incentive to pitch frequently than any reasonable person could expect.

Considering the wear and tear on his arm, expectations even for such a legendary pitcher would need to be very tempered for his performance in his 40’s. After all, only 67 pitchers have ever even thrown 100 innings after they turned 40.

Of those 67, Paige ranks 8th in ERA- (81). Of the seven in front of him, three were knuckleball pitchers, one pitched before World War I, and one has been held out of the Hall of Fame due to steroid allegations (whether fair or not).

In the course of his first 4 seasons, 128 pitchers threw at least 300 innings. Of those 128, Paige’s strikeout rate ranked 2nd. At the end of that four-year stretch, he was 46. 46 year olds don’t strike players out. You have to go down 20 spots to find a pitcher who was less than 10 years younger than Paige.

After Paige had been out of the majors for over a decade, the Kansas City A’s had him throw for them when he was 59 years old. He threw three scoreless innings, allowing only one runner.

It’s easy to wish we had better stats of Satchel Paige’s early career. It could help us establish if he really had, as he said, over 20 no-hitters. We could definitively say whether or not he had 250 shutouts, 2000 wins, 21 straight wins, or over 60 consecutive scoreless innings, all of which he claimed to be true. It’s quite likely all those numbers are fabricated. It’s possible that many of the stories about his pitching are exaggerated.

But when Satchel Paige was finally given a chance to prove himself, he blew away any realistic expectations anyone could have set for him. No one will ever know what stories about Satchel Paige really happened, or how trustworthy people’s observations of him were. But 25 years into his career, at years in his life few ever spend pitching professionally, he gave us a reason to believe them.


Top 10 Picks in the ’90s: Irrational Trends

The annual MLB Draft is an exciting time for baseball. Dozens of high school and college players convince fans that they have the potential to be future All-Stars, and teams make selections to stock their farm systems with talent to win in the future. But obviously, not every pick can be savvy, and the majority of these selections turn out to be regrettable. The best a team can do is make rational choices to put themselves in a position to succeed. I decided to take a look at the draft classes in the 1990s to see if teams were making these rational decisions. I chose this decade because it’s the most recent one that is almost exclusively filled with players who have finished their careers.

In the 1990s, there was a fairly even distribution of pitchers and hitters selected with early draft picks. Since roster makeup isn’t skewed much in favor of either group, this seems to make sense. Teams are just as eager to get elite pitching as they are to acquire top-tier hitters. This year, 6 of baseball’s 12 highest paid players are pitchers, 6 are hitters.

It’s not surprising that during the ’90s, 45 of the 100 Top 10 picks were pitchers. In hindsight, this seems like it was probably the result of some pretty big mistakes. There are certainly some successful examples. In 1999, Josh Beckett was selected 2nd overall, Barry Zito was 9th, and Ben Sheets was picked 10th. The hope that a pick can turn into a future ace is enough to tempt any GM to take a pitcher. But that usually didn’t go well.

I gathered the career WAR for every draft pick, and here is the expected output for each Top 10 selection.

Draft Curve

This does not paint a pretty picture for teams who decided to go with pitchers. No matter where on the chart you look, picking a hitter gives a team a better expected outcome than a pitcher, and it’s not particularly close. The average hitter taken in the Top 10 achieved a career WAR of 16.0. The average pitcher reached 7.0. That’s a big gap, and the disparity was made on a large scale.

Here’s a year-by-year average for draft picks at each position:

Draft Bars

1999 was an excellent year for pitchers, as I already mentioned. In fact, it was the best year for pitchers. But if you add it to the list of years for hitters, it would rank 6th out of 11.

Clearly, picking hitters seems like the preferable strategy of the ’90s. But teams opted not to do so roughly half the time.

Similar to what position someone plays, there’s another core attribute about a player outside of his scouting reports: whether or not he went to college. College players will be more developed and will have less room to grow. High school picks are considered riskier with higher upside. The data seem to support that. Unlike the difference between hitters and pitchers, the age of a draft pick had a more nuanced effect.

Draft Source

High school players taken at the top (of the top) of the first round are more promising than college players. This is because elite players like A-Rod, Chipper Jones, and Josh Hamilton don’t often slip under the radar when they’re 17 or 18. But what’s interesting is when you make your way to the bottom of the Top 10, college players have a better expected career WAR. I don’t want to make too many guesses why, because honestly I’m not sure. But it’s a very noticeable trend. No matter the reason, it’s clear that teams should be more eager to draft high schoolers with picks 1-5, and college players with picks 6-10. But look at the frequency of high school draft picks by selection.

Draft Source Pick

Teams do the exact opposite of what they should. The earlier in the draft, the more likely a college player is to be selected. 32.5% of Top-4 picks are drafted out of high school, while 68.3% of picks 5-10 are.

To a strong extent, this analysis is not fair to these teams. I’m looking at these numbers in 2014, and it’s easy to go back in time and point out what mistakes teams made in drafts. But these aren’t scouting report mistakes, isolated misjudgments, or bad luck decisions. Teams in the 1990s made consistent poor strategic decisions on a large scale in the draft that were often indefensible.


2014’s Most Underpaid and Overpaid Hitters

Winning is expensive in 2014. According to the FanGraphs “Dollar” variable, players in the current market should be paid $5.4m per win they contribute. But, as is the case in such an unpredictable sport, many players are paid too much, and others outperform their pay.

Although baseball is hard to predict, the Steamer projections do an exceptional job forecasting hitter performance. Using these numbers, I want to give a brief preview of what players are expected to be the best bargains and the ones who will be the most egregiously overpaid for this upcoming season. However, I want to avoid making just another list of players who are getting paid a lot and won’t play much (see Alex Rodriguez). Rather, for the overpaid players, I just want to look at guys who will play, but ineffectively. Therefore, I set a minimum at 300 projected plate appearances for each hitter.

The best and worst value players aren’t any surprise. Mike Trout, the supposed best position player in 2014, is getting paid twice the league minimum. The highest paid position player who will play in 2014, Ryan Howard, is projected to perform like a replacement level player.

This chart illustrates what severe outliers these two are.

Howard Trout Pay

That’s not groundbreaking or surprising. Instead of talking about how obviously overpaid and underpaid specific players are, I’ll just present the list of the biggest cases.

1. Mike Trout
WAR: 8.1
Salary: $1m
Value: $42.7m

2. Evan Longoria
WAR: 6.6
Salary: $8m
Value: $27.6m

3. Paul Goldschmidt
WAR: 5.2
Salary: $1.1m
Value: $27m

4. Andrew McCutchen
WAR: 6.3
Salary: $7.5m
Value: $26.5m

5. Buster Posey
WAR: 6.6
Salary: $11.3m
Value: $24.3m

6. Andrelton Simmons
WAR: 4.6
Salary: $1.1m
Value: $23.7m

7. Matt Carpenter
WAR: 4.3
Salary: $1.3m
Value: $21.9m

8. Josh Donaldson
WAR: 4.1
Salary: $0.5m
Value: $21.6m

9. Salvador Perez
WAR: 4.2
Salary: $1.5m
Value: $21.2m

10. Yasiel Puig
WAR: 4.5
Salary: $3.7m
Value: $20.6m

Value Best

This is certainly an exceptional group of players, and they got on this list for a few different reasons. For the most part, age and the renewal/arbitration system played a key role. The Rays’ deal with Longoria is widely considered one of the most team friendly deals in history. Andrelton Simmons just came off one of the greatest fielding seasons of all time, and Salvador Perez has already been worth nearly 3x his salary this season. Also, in hilarious Billy Beane fashion, Josh Donaldson is somehow getting paid the league minimum.

The front offices who have these players are hopefully counting their blessings. Some aren’t quite as lucky, though. Here are the 10 most overpaid players this year.

1. Ryan Howard
WAR: 0.1
Salary: $25m
Value: -$24.5m

2. Alfonso Soriano
WAR: 0.3
Salary: $19m
Value: -$17.4m

3. Mark Teixeira
WAR: 1.5
Salary: $23.1m
Value: -$15m

4. Adam Dunn
WAR: 0.1
Salary: $15m
Value: -$14.5m

5. Dan Uggla
WAR: 0.3
Salary: $13.1m
Value: -$11.5m

6. B.J. Upton
WAR: 0.7
Salary: $14.1m
Value: -$10.3m

7. Prince Fielder
WAR: 2.6
Salary: $24m
Value: -$10m

8. Carl Crawford
WAR: 2.1
Salary: $21.1m
Value: -$9.8m

9. Nick Markakis
WAR: 1.1
Salary: $15.4m
Value: -$9.5m

10. Victor Martinez
WAR: 0.6
Salary: $12m
Value: -$8.8m

Value Worst

A pretty common trend exists here: big free agency signings who aren’t expected to perform as well as they should this year. Prince Fielder is pretty easily the biggest surprise for me on this list, but a $24m first baseman really does need to hit remarkably well to be worth that. Derek Jeter, getting paid $12m and expected to get a WAR of 0.7, just missed the list at 11th.

Overall, young guys are more likely to be underpaid, and older guys are more likely to be overpaid, almost entirely due to the league’s free agency rules. This list is just another tiny reminder in the pile of research that a team filled with young talent will be more cost-effective than building a team through free agency.


Baseball’s Biggest Market Inefficiency

A couple years ago, The Oakland Athletics extended the contract for general manager Billy Beane for an additional 5 years, securing him through the 2019 season. They did not release the specific details of the contract, but we can guess that it’s comparable to the $3-4m that Brian Cashman and Theo Epstein make per year. The A’s are paying Alberto Callaspo $4.1m this year. Neither Beane’s nor Callaspo’s salary is particularly surprising, since both roughly reflect the current market for a top-tier GM and a 30-year-old infielder with a career .273/.335/.381 slash line. But is this reasonable? Should the owner of a baseball team be more willing to pay a mediocre infielder than an elite general manager? If the following data on front office success is any indication, absolutely not.

Using payroll data that goes back to 1998, I wanted to compare how well teams achieved success relative to the budgets they were given by their owner. In order to do so, I ran a regression model for every season to determine what sort of an effect payroll had on wins. For each season, the league average payroll is normalized to “1” to allow every season to be in this chart. As the graph shows, teams with more money tend to win more. If you’re adventurous and feel like interacting with the data you see below, click here and mouse over everything until you pass out.

Payroll Regressions

It’s no surprise that money leads to success, and the fact that certain GMs tend to outperform their budget shouldn’t stun you either. But the extent to which some general managers are better than others is enormous. There are plenty of GMs who did exactly what you’d expect given their budgets. In 9 seasons with the Expos and Mets, Oscar Minaya was given the funds to win 742 games. He won 739. Mark Shapiro was supposed to win 703. He won 704.

Some general managers have better reputations, though. Theo Epstein, former Red Sox GM and current Cubs President of Baseball Operations, was given the budgets that would have resulted in 795 wins from an average GM, but he turned that into 839 wins in Boston. Legendary Braves GM John Schuerholz led a Braves squad that won 78 more games than expected since 1998, when the data begins. The 2nd best on the list, ex-Cardinals and current Reds GM, Walt Jocketty, has been worth an astounding 106 wins.

Then there’s Billy Beane: the Billy Beane who the A’s are paying slightly less than Alberto Callaspo. Under his direction, the Oakland Athletics have won 171 more games than expected. Babe Ruth had a career WAR of 168. Ruth’s best season was worth an absurd 15.0 wins in terms of WAR. Billy Beane has had 6 seasons during which the A’s won 15+ more games than they should have. They’ve never had the money to win 50% of their games, but half their seasons have ended with 20 more wins than losses.

I could go on. But first, let’s look at some visuals.

Best General Managers

Here are the 16 general managers whose teams have exceeded their financial expectations by over 25 wins since 1998. If you want to look at every general manager’s wins and expected wins, explore this. One name I have not mentioned so far that has had an impressive stint as head of the Rays is Andrew Friedman. Since he’s been the GM of the Rays, they have been tied with St. Louis as the most cost effective winners in baseball. It’s even more impressive when you consider the dumpster fire he inherited.

Andrew Friedman

After ignoring the potential for mediocrity during his first two seasons and building for the future, Friedman’s Rays took off. In the past 6 years, the Rays have won 87 more games than they should have. While it’s not as good as Beane’s best 6-year stretch of 117, it has coincided with a relatively weak stretch for the A’s where they have only exceeded their budget-wins by 30 games.

Unfortunately, not every team can have a Billy Beane or an Andrew Friedman. Some teams, like my Royals, have had more struggles. This chart, as much as anything else, shows the overwhelming need for effective front office management.

Team Front Offices

The A’s have been 300 wins more effective than the Orioles the last 16 years. If a win is worth $5m as recent free agency has suggested, then I don’t even want to type how much Billy Beane is worth. If you’re like me, it’s worth your time to explore this chart which shows yearly expectations and results for each team. A couple teams to look for, in addition to the ones I’ve talked about: the Cardinals and Braves have been unsurprisingly excellent, and the Cubs, Royals, and Orioles are worth looking at for less exciting reasons.

So how much should teams be paying their GMs? At this point, that’s an easy answer. $1 more than everyone else will pay, because they are tremendously undervalued right now. After that, the answer isn’t as clear, but I don’t see why they wouldn’t be similarly paid to players. One easy counter argument would be that if you pay the GM too much, he can’t do his job as well because he would have less money with which to pay players. But I think there is sufficient evidence that, for example, the Blue Jays would win more games with the team that Andrew Friedman could assemble with a $97m payroll than their current $117m team. The fact that the Rays will pay $57m this year for their squad should support that claim more than enough.

The free agent market would say that an elite GM could be worth $50-$100m a year. While that might strike people as unreasonable, it’s probably closer to their real value than the replacement level infielder-pay they are receiving now.


The Royals: The AL’s Weirdest Hitters

The MLB season is quickly approaching, and I am running out of ways to entertain myself until real baseball starts again.  One way that I attempted to do so today was to prepare a guide about strengths and weaknesses of offenses by team.  I just worked with the AL because I didn’t feel like adjusting the data for DH and non-DH teams to be in the same pool.  Using FanGraphs’ infallible Depth Charts feature, I gathered every American League team’s projected totals for AVG, OBP, SLG, and FLD, in order to see some basic tendencies for each team coming into the 2014 season.  I plugged some numbers into 4 variables which I thought would give a better-than-nothing estimate of how a team’s offensive roster was set up. Here are the stats I used to define each attribute:

Contact: AVG

Discipline: OBP – AVG

Power: SLG – AVG

Fielding: FLD

These variables are about as perfect as they are creative (which is to say, not very).  However, this was intended to be a fairly simple exercise.  For each variable, I ranked all the teams and assigned a value between -7 and 7.  The best team in the AL received a 7, second best a 6, and so on.  A score of 0 is average and -7 is the worst.  Here are the results:

Dashboard 1

As an inexperienced embedding artist, I feel obligated to include this link, which should work if the above chart is not working in this window.

Immediately, one thing popped out at me. The Royals are 1st in Contact. They also are 1st in Fielding. This is good, since they project to be dead last in Discipline and Power. These facts going together really is odd. For the most part, teams fit into more general molds. The White Sox and Twins are below average in everything. The Yankees, Red Sox, and Rangers, are below average at nothing. The Rays and A’s are, to no one’s surprise, copying each other with good Discipline and Defense.

In fact, outside of the Royals, there isn’t another team who is 1st or 15th in any 2 categories, and Kansas City did it in all 4. To figure out how they got here, let’s look at some of the ways they stick out from the rest of the league.

In 2013, the American League had a 19.8% strikeout rate. Of all the Royals’ projected starters in 2014, Lorenzo Cain had the highest 2013 K% at 20.4%. Alex Gordon sat at 20.1%, and you won’t find anyone else above 16.1%. Not satisfied with an overall team strikeout rate about 3 points lower than the league average in 2013, the Royals went out and acquired Omar Infante and Nori Aoki this offseason, whose respective rates of 9.1% and 5.9% ranked 8th and 1st among all hitters with 400+ PA last year. It’s obvious why the Royals batting average is supposed to be 8 points higher than the 3rd best in the league. They put the ball in play.

Unfortunately for them, putting it in play is about as much as they can do. They’re the least likely team in the AL to be clogging up bases with walks, and they’re the least capable team to drive in runs with power.

In 2013, the American League had an average Isolated Power of .149. Alex Gordon led the Royals with his .156 mark. And that was it for the above average power hitters. Even Designated Hitter Billy Butler couldn’t muster up anything better than a .124. The team’s ISO was .119, which won’t be affected dramatically by the arrival of Aoki and Infante, whose ISO’s averaged out to .108, but who replace weak-hitting positions for the Royals.

Oh, and for discipline: they don’t walk. They don’t like it. GM Dayton Moore got in trouble for saying something dumb about it, and the data suggest Manager Ned Yost may not have been aware they existed when he played. To the Royals’ credit, they did acquire Aoki, whose 8.2% rate last year was ever so slightly higher than the AL average of 8.1%. Omar Infante’s rate was just above 4, though, and their 6.9% team rate probably won’t be much better this year.

Lastly, fielding. Kansas City could flat out field, winning 3 Gold Gloves, and saving a mind-blowing 80 runs according to UZR. That number, more than double (!!!) anyone else in the AL in 2013, was the 2nd highest UZR ever in the AL, trailing only the 2009 Mariners. Those 80 runs are almost sure to decrease in 2014, but there’s little reason to argue that any other team in the AL will be expected to save more runs with the glove this year.

Overall, the Royals offense could be nuts in 2014. They won’t strike out, and will put the ball in play. There won’t be many other ways they get on, and they won’t be hitting the ball out of the park much. If last year is any indication, they should save some runs for their pitchers when they’re out in the field. No matter how they turn out this year, there’s one thing to remember. If you’re watching a team effort from Kansas City, there’s a decent chance that no one in the rest of the league is doing it better. There’s also just as good a possibility that everyone is.