Archive for Strategy

Searching for Dexter Fowler(s): Finding Value in Fantasy Baseball

If Dexter Fowler or any of the other Dexter Fowler-type players mentioned below are sitting on your fantasy baseball waiver wire, then stop what you’re doing right now and snag them. What follows mainly applies to deeper mixed-leagues, but frankly, I’m a little tired of reading the musings of “experts” on how this or that guy is “viable only in NL-only” or “shallow-mixed” leagues. That’s all well and good, but let’s cut the crap: we want guys who produce counting stats, and Dexter Fowler and those like him do precisely that for leagues big and small. They score runs, steal bases, hit home runs, get on base, and more, but for some reason, people don’t give them the credit they deserve. For instance, Fowler, with his 10 HR, 66 R, and 16 SB, just finally cracked the ESPN Top-250 list this past week; but he’s still ranked behind the likes of Logan Morrison. See what I mean? But I digress.

Here’s my point: If you’re like me — and you probably are, to the extent that you love playing Rotisserie/fantasy baseball — then you’re looking to find value on the waiver wire or via trade; you’re looking for undervalued players who produce counting stats. Sounds easy enough, and if you look at the ownership rates of a few guys I’m particularly keen on, then it really is easy to find these guys free of charge; guys like Dexter Fowler (owned in 57% of ESPN leagues), David Peralta (27%), Preston Tucker (27%), or Marlon Byrd (34%). Are these names flashy? No, not really, but who cares; they produce.

There are plenty of other, similar players who all have a few things in common relevant to us baseball-minded folk: they produce in at least three categories and are probably on your waiver wire or sitting on someone’s bench ripe for a trade offer from you. Why these players — and those like them — are so under-owned is, in many cases, the result of playing time (i.e., platoons), but I also suspect the ownership percentages are skewed by 8-team leagues . In deeper leagues, however, like those I care about, Dexter Fowlers are must-haves.

Here’s at look at how the Dexter Fowlers I’ve identified (and there are many more) can help you. I’ve also provided some stats and thoughts on why so few people have grabbed these particular guys. In any case, these are guys you’ll want down the stretch.

Dexter Fowler: How many guys have double-digit home runs and stolen bases in MLB this year? Eighteen. 18! Fowler, recall, was once a highly touted prospect in the Rockies organization, and while he never quite turned into the superstar many had projected, he has had a fine career, and hitting in front of Kris Bryant and Anthony Rizzo (and lately, ahem, Chris Coghlan) is helping Fowler have one of his finest seasons to date. Currently on pace to destroy his single-season career high homer total of 13 set in 2012, Fowler is also on pace for his first 20 SB season since his rookie year, while remaining among the league leaders in runs scored (currently 4th in the NL at 66).

Let’s take a step back for a second: Fowler has 10 HR and 16 SB. That’s fantastic in its own right, but he gets zero love (or 57% love, as it were). The knock on Dexter, of course, is his low batting average. However, that argument is starting to fall apart, as the average is on the rise and it’s been dragged down by a career-low .297 BABIP (career BABIP of .342). Not to mention Fowler takes a ton of walks, thus helping buoy his run and stolen base totals in the absence of hits. And on top of the great counting stats and rising average, Fowler is a switch hitter, leaving him immune to benching in the face of tough lefty/righty matchups.

For perspective, consider this: Christian Yelich is ranked ESPN’s number 35 outfielder for Roto 5×5 leagues (117 player overall); Fowler is ranked OF #59 (230 overall). Here are their stats; I have no idea what drugs ESPN is taking, but I want some.

Yelich (owed in 67%): .263; 35 R; 6 HR; 25 RBI; 10 SB (note: he did spend roughly three weeks on the DL and is without the benefit of Stanton)

Fowler: .243; 66 R; 10 HR; 27 RBI; 16 SB.

Here’s more perspective: According to ZiPS projections, Yelich is on pace to finish the season with stats in all categories almost identical to what Fowler has achieved by July.

Why the disparity in rankings? You tell me — potential, I suspect, but you don’t need a PhD in statistics to tell you that Fowler is vastly outperforming Yelich this year, and we are well beyond the days where the small-sample size caveat holds water. Yelich, to his credit, is a fantastic hitter and has a bright career ahead of him, but he’s got nothing on Dexter Fowler in 2015.

Here are a few other Fowler-types to keep in mind:

David Peralta: The dude crushes right-handed pitching. Peralta, a converted pitcher, has an average batted-ball velocity of approximately 95 MPH according to baseballsavant.com (that’s really, really good). He currently owns a .281/.351/.493 triple slash with 9 HR and 48 RBI, though he rarely plays against lefties (which is perhaps stupid, but a topic for another time) despite a recent vote of confidence by Chip Hale for his improved ability to mash lefties as well.

Bottom line: Peralta flat-out hits. He’s been on a roll since Inciarte went on the DL, and thanks to the maddening way in which Hale manages his lineup, Peralta is not an everyday starter — but against righties, which make up the majority of National League pitching (by far), Peralta holds prime real estate in Arizona’s lineup and should be in your lineup as well, and ahead of guys like, for instance, Christian Yelich. And maybe even Dexter Fowler, depending on your particular needs. In addition to Peralta’s 9 HRs in 288 ABs, he’s also stolen five bases and regularly slots in the 2-hole when he’s not batting cleanup.

In a stacked Arizona lineup, opportunities to score and drive in runs are plentiful — as he’s shown over the past two months. If nothing else, just bench him against lefties and start him against righties, whom he absolutely destroys, which reminds me of Preston Tucker.

Preston Tucker: A highly regarded prospect in the Astros organization, Tucker was called up from Fresno in May. He got off to a hot start, cooled in June, but here in July/August, Tucker is again raking. Known as “Bam Bam” for his likeness to Fred Flintstone’s pal (or grandfather?), Tucker is 25 and has crushed 77 homers (minors & majors) since 2012, after being a 7th round pick in 2012. His platoon splits aren’t pretty; you won’t want to start him against the few lefties he’s allowed to face, but what he does to righties almost makes me feel bad for the pitchers: He’s slashing .296/.356/.568 against righties (OPS of .924 if you don’t like math), with 5 HR in 46 AB’s since the All-Star break.

Start Tucker with confidence; he bats second or cleanup against righties, and with Gomez in town, Jake Marisnick (a righty) is the odd man out more often than not — Tucker and his .924 OPS do too much damage to bench against RHP. Also note that Tucker gets more starts than does Colby Rasmus (until the return of Springer, when they both likely sit) another guy I like, incidentally, for his power vs. righties. Tucker’s power is real; his ISO is a lovely .204 and his .265 batting average aligns well with his minor league numbers, and his BABIP is a sustainable .299 given his hard-contact rate and minor league numbers.

Marlon Byrd: He’s hit 18 home runs and, in his last 60 games (roughly), is hitting over .290 with 15 home runs. He’s owned in 34% of ESPN leagues. Byrd has hit 25 and 24 homers the past two years, respectively. Enough said.

As I mentioned, there are plenty of other Fowlers out there, and I will cover those in my next post. Hint: Gerardo Parra (72%!); Colby Rasmus (5%); Jarrod Dyson (7%).


The Risk of Long Contracts for Middle-Market Teams

Middle-market teams have historically tried to play the game like they are mini-large-market teams. They develop talent and when they have enough to make a run at the playoffs they make moves. They buy free agents, extend players through their age 27-33 years, and trade for proven talent. Unfortunately this usually does not work and we often see one of the top six most expensive teams (or the Cardinals) in the playoffs year after year. Then, the middle-market team’s “window” has closed, and the wait starts over.

It is time to have a change in the tradition of middle-market teams, and this includes the Texas Rangers.
The focus should not be on operating on a “window” of time where a World Series run is possible, but to create a team where there are very few years where this window is not open. The Cardinals are a good example of executing this plan. They rotate talent in and out due to a solid player-development system, while making very few large free-agent signings. This leads to a team where there is never too much money tied up to one or two players, and they can afford to make short-term deals or trades for players who add value to the team immediately without tying up long-term cash.

Let’s talk about how this relates to the Rangers though, specifically Elvis Andrus and his extension as this issue extends to all of the contracts the Rangers have given out. Most people look back and ask the wrong question as it was never about whether the Rangers thought Elvis was really going to be good for his contract. The Rangers obviously thought that he would be. The question the Rangers should have asked themselves is, should a middle-market team take a large risk by signing a player whose peak will probably be around age 26 to an eight-year extension, well past his peak? For a middle-market team, the contract is near impossible to avoid down the stretch if for some reason the player does not achieve the level of success that is expected.

Other situations, like Adrian Beltre, have worked. However, can you imagine a world where the Rangers spent all that money on Beltre, only to have him be awful? Of course you can, and it would have been miserable. The Rangers were fortunate that Beltre had a second peak at 31 that has lasted five years. Beltre is the exception, not the rule, and the Rangers should not expect to get lucky on a contract like his very often. It was a very high-risk offer that ended up working out. Unfortunately, we have the opposite side of the spectrum as well. Shin-Soo Choo was given a similar contract to Beltre, at a similar age. Unfortunately, this contract appears to be flat and the Rangers are already looking for a way to move Choo on.

The Rangers made a series of high-risk contract moves when they had players in the minors who were only a year or two away from being able to contribute on a major-league team, which led to a large amount of money being tied up. This is not to say that all long-term contracts are bad. If the Rangers were able to find a franchise player who brings extreme value consistently with a skill set that ages well, the risk would be worth the shot as long as a reasonable deal could be achieved.

The ultimate conclusion is that as a middle-market team, the Rangers should have a change in focus from spending money on long-term contracts, which are huge risks, to using money and trades to put together a solid supporting cast of players on shorter-length contracts. These players will support a group of younger cost-controlled players where their risk of failure is not tied to large amounts of cash. It is a superior strategy to hoping that during a window of opportunity, where long-term contract players are not past their prime, the team will make the playoffs a few times. If played correctly, with the Rangers’ amazing farm system and development team, the Rangers could have a consistently good team for long periods of time.


The Cleveland Indians as a Fringe Playoff Contender

It’s been a disappointing year thus far for the Cleveland Indians. They are currently 42-46 heading into the All-Star Game, and are in 4th place in the competitive American League Central division. They are underperforming their BaseRuns projection by 4 wins, meaning the computers view this team as much more of a playoff threat than they actually have been thus far. Although they have the third-highest remaining projected winning percentage in the AL at .532, their rough first half has them only finishing with about 81 wins. As wide open as the wild card race is, a .500 finish would clearly not be enough. What has happened to everyone’s preseason sleeper team? Besides Sports Illustrated jinxing them of course.

Well as expected, they have had stellar starting pitching from the likes of Corey Kluber, Carlos Carrasco, Trevor Bauer, and Danny Salazar, and even have gotten good outings recently from under the radar prospect Cody Anderson. Everyone knew they had a bad defense, but many thought that the Indians’ offense could support the great starting pitching enough to propel them into the postseason. Thus far, however, that has not been the case. They are at league average or below in almost all offensive categories. They are not a power hitting team by any means, and have the 10th lowest FB% in the MLB, which makes sense seeing as to hit for power you need to get the ball in the air. However, they still run the 7th lowest BABIP in baseball, which insinuates that they have a lot of hitters who tend to roll over a lot. Lo and behold, they are 3rd in Pull %, and have a lefty heavy—heavy being an understatement—lineup.

Essentially, the Indians have amassed a lineup with a bunch of pull-happy hitters who don’t hit for much power, which doesn’t work in a league that nowadays uses the shift religiously. I think all Cleveland fans know where I’m going with this, because the phrase has been overused by Tribe fans for almost a decade now. Yes, Cleveland is lacking an impact right-handed bat. Brewer’s prized prospect Matt LaPorta was supposed to be that guy when the Indians traded C.C. Sabathia for him and others—including player to be named later Michael Brantley. However, his MLB career was as successful as Kim Kardashian’s first marriage. Ironically or not, Milwaukee has another player that I believe can push the Tribe over the hump; his name is Carlos Gomez.

The 29 year old native of the Dominican Republic, known for his fiery personality, has been extremely productive for the Brew Crew since 2011, racking up 18.4 WAR in that 4 year span. With Milwaukee sitting at the halfway point with the second worst record in all of baseball, they will most definitely be sellers at the trade deadline. I recently tweeted FanGraphs’ Jeff Sullivan asking him if Gomez would be dealt, to which he responded, “Gomez is probably moving. Lucroy not.” That doesn’t mean it is set in stone, but that shows that there is a decent chance he gets traded. Let’s just assume for arguments sake that the Indians and Brewers have mutual interest in being trade partners. Why should the Indians’ make the move?

One plus is that Gomez wouldn’t be a rental. He is under contract through 2016, and is only set to make 9 million dollars next year. If you consider 1 WAR to be worth roughly 7 million dollars, Gomez’s average of 6.6 WAR per year the last two seasons would be a huge bargain for the Tribe. With the contracts of David Murphy and Ryan Raburn likely to be coming off the books next year, an extra 9 million dollars on the payroll will be inconsequential for the notoriously conservative Dolan family. Gomez also would provide a major upgrade from primary Tribe center fielder, Michael Bourn. I have included a chart that compares their averages from the last two seasons. Why two seasons? Because that’s when Bourn signed with Cleveland, where he has not been the same player he once was.

Name Avg. WAR Avg. wRC Avg. RISP Avg. DEF Avg. ISO Avg. SLG Total PA
Bourn 1.3 53 0.298 -3.3 0.101 0.360 1,062
Gomez 6.6 93 0.298 17.2 0.208 0.492 1,234


It is easy to see who has been the more valuable player. The reason I included ISO and SLG was to demonstrate Gomez’s excellent power, not necessarily to compare it to Bourn’s (because that is not the type of hitter he is). Gomez would provide a major upgrade defensively – where the Indians struggle – and at the plate, where he is a key catalyst in manufacturing runs. Gomez has created almost 40 more runs per season than Bourn the last two years. If you take into account how every 10 runs scored or given up equates to a win or a loss, those extra 40 runs would essentially add on about 4 more wins to the Indians win total (assuming those averages hold up throughout the 2015 season). So that would take the roughly 81 win Indians and make them an 85 win team; better yes, but still not a playoff contender.

Although Bourn and Gomez have been equally as good with RISP, this season has been a different story; Bourn is hitting .216 in 68 PA and Gomez is hitting .381 in 65 PA with RISP. The Indians have the 7th worst average with RISP this season at .230, with the MLB average being .255. For a team that struggles to score runs, this would be a huge difference. Slotting Gomez in the lineup everyday behind a guy like Michael Brantley would also take a ton of pressure off of him to carry the team day in and day out.

So what does this all mean? Could Carlos Gomez really propel the Tribe into October baseball this season? Probably not. Here are their season splits against teams above and below .500.

               Wins Losses Winning Percentage
Teams ≥ .500 24 32 0.429
Teams < .500 18 14 0.563


They struggle against good teams, and beat bad ones. That is not the mark of a playoff team. In the last 74 games of the season, the average winning percentage for teams they play is .515. While I fully believe the team could make a strong second half push – I actually believe they will make the playoffs – it is not likely. Still, a trade for Carlos Gomez would not only aid them in the second half of this season, but for next season as well. Clevelanders are sick of hearing “we’re building for the future.” The Indians have an extremely strong core, one that is young and locked into team-friendly contracts. It is time to win now, because they would hate to look back years from now like a reminiscent ex-lover and say, “That was the team that got away.”


A Discrete Pitchers Study – Out & Base Runner Situations

(This is Part 4 of a four-part series answering common questions regarding starting pitchers by use of discrete probability models. In Part 1 we explored perfect game and no-hitter probabilities, in Part 2 we further investigated other hit probabilities in a complete game, and in Part 3 we predicted the winner of pitchers’ duels. Here we project the probability of scoring at least one run in various base runner and out scenarios.)

V.  I Don’t Know’s on Third!

Still far from a distant memory, the final out of the 2014 World Series was preceded by an unexpected single and a nerve-racking error that brought Alex Gordon to 3rd base with two outs. Closer Madison Bumgarner, who was on fire throughout the playoffs as a starter, allowed the hit but would be left in the game to finish the job. There is some debate as to whether Gordon should have been sent home rather than stopped at 3rd base , but it would have taken another error overshadowing Bill Buckner’s to get him home; also, next up to bat was Salvador Perez, the only player to ever ding a run off Bumgarner in three World Series. So even though the Royals’ 3rd Base Coach Mike Jirschele had to make a spur of the moment critical decision to stop Gordon as he approached 3rd base, it was a decision validated by both statistics and common sense. We will show our own evidence, by use of negative multinomial probabilities, of how unlikely the Royals would have scored the tying run off of Bumgarner with a runner on 3rd with two outs and we will also consider other potential game-tying or winning situations.

Runs are generally strung together from sequences of hits, walks, and outs; in the situations we will consider, we will only focus on those sequences that lead to at least one run scoring and those that do not. Events not controlled by the batter in the box, such as steals and errors, could also potentially reshape the situation and lead to runs, but we’ll take a very conservative approach and assume a cautious situation where steals are discouraged and errors are extremely unlikely.

Let A and B be random variables for hits and walks and let P(H) and P(BB) be their respective probabilities for a specific pitcher, such that OBP = P(H) + P(BB) + P(HBP) and (1-OBP) is the probability of an out; we combine the hit-by-pitch probability into the walk probability, such that P(BB) is really P(BB) + P(HBP) because we excluded hit-by-pitches from our models, P(HBP) > 0 against Bumgarner in the 2014 World Series, and the result on the base paths is the same as a walk. The first negative multinomial probability formula we’ll introduce considers the sequences of hits, walks, and an out that can occur after two outs have been accumulated, setting the hypothetical stage for the last play in Game 7 of the 2014 World Series.

Formula 5.1

In the 2014 World Series, Bumgarner’s dominantly low P(H) and P(BB) were respectively 0.123 and 0.027 and his (1-OBP) was 0.849; by applying these values to the formula above we can generate the probabilities of various hit and walk combinations shown in Table 5.1. The yellow highlighted cells in the table represent the combination of hits and walks that would let Bumgarner escape the inning without allowing the tying run (given a runner on 3rd with two outs and a one run lead). By combining these yellow cells, we see that the odds were overwhelmingly in in Bumgarner’s favor (0.873); all he had to do was get Perez out, walk Perez and get the next batter out, or walk two batters and get the third out.

Table 5.1: Probability of Hit and Walk Combinations after 2 Outs

0 Hits 1 Hit 2 Hits 3 Hits 4 Hits
0 Walks 0.849 0.105 0.013 0.002 0.000
1 Walk 0.023 0.006 0.001 0.000 0.000
2 Walks 0.001 0.000 0.000 0.000 0.000
3 Walks 0.000 0.000 0.000 0.000 0.000
4 Walks 0.000 0.000 0.000 0.000 0.000

The Royals could have contrarily tied the game with a simple hit from Perez given the runner on 3rd and two outs, yet this wasn’t the only sequence that would have kept the Royals hopes alive. Three consecutive walks, one walk and one hit, or any combination of walks and one hit could have also done the job; examples of these sequences are shown in the graphics below:
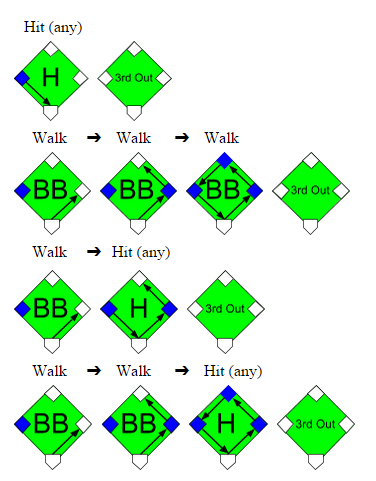
Graphic 5.1

Generally, any combination of walks and hits not highlighted yellow in Table 5.1 would have tied or won the World Series for the Royals. This glimmer of hope was a quantifiable 0.127 probability for Kansas City, so it was justified that Gordon was kept at 3rd rather than sent home after shortstop Brandon Crawford just received the ball. It would have taken an error from Crawford or Buster Posey, with respective 0.033 and 0.006 2014 error rates, to get Gordon home safely. The probability 0.127 of winning the game from the batter’s box is noticeably three times greater than the probability of winning it from the base paths (where Crawford and Posey’s joint error probability was 0.039).

We should note that the layout in Table 5.1 is a simplification of what could occur with a runner on 3rd, two outs, and a one run lead, because it only applies to innings where a walk off is not possible. In innings where a walkoff can occur, such as the bottom of the 9th, the combinations of walks and hits captured in the red highlighted cells are not possible because they would occur after the winning run has scored and the game has ended. However, Bumgarner was so dominant in the World Series that these probabilities are almost non-existent, thereby making our model is still applicable; we would otherwise exclude these red-celled probabilities for less successful pitchers.

The next probability formula considers the sequences of walks, hits, and outs that can occur after one out has been accumulated, which is situation definitely worth examining if there is a lone runner on 2nd base.

Formula 5.2

Once again we’ll use Bumgarner’s 2014 World Series statistics to evaluate this formula and insert the probabilities into Table 5.2. According to the sum of the yellow cells, Bumgarner would be able to prevent the tying run from scoring (from 2nd base with one out) with a probability of 0.762 and would otherwise allow the tying run with a probability of 0.238.

Table 5.2: Probability of Hit and Walk Combinations after 1 Out

0 Hits 1 Hit 2 Hits 3 Hits 4 Hits
0 Walks 0.721 0.178 0.033 0.005 0.001
1 Walk 0.040 0.015 0.004 0.001 0.000
2 Walks 0.002 0.001 0.000 0.000 0.000
3 Walks 0.000 0.000 0.000 0.000 0.000
4 Walks 0.000 0.000 0.000 0.000 0.000

To get out of the inning unscathed, Bumgarner would need to prevent any further hits or allow fewer than 3 walks given a runner on 2nd with 1 out; it would be possible to advance the runner to on 3rd with 2 walks and then sacrifice him home in this situation (with no hits), but this probability is insignificantly tiny especially for a dominant pitcher like Bumgarner. Once again we depict these sequences that could get the tying run home from 2nd with 1 out, with the second out inserted randomly.
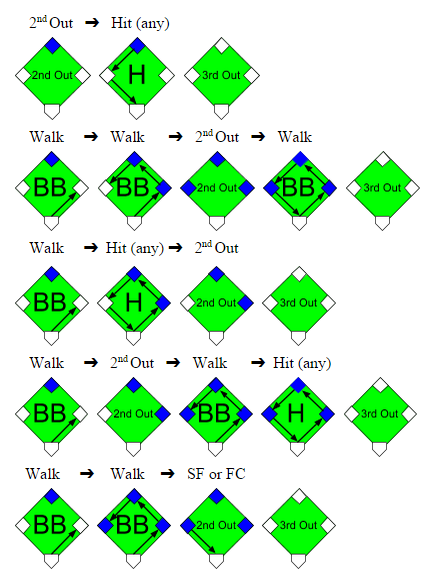
Graphic 5.2

A runner on 2nd base with one out is a scenario commonly manufactured in an attempt to tie the game from a runner on 1st with no outs situation. The logic is that if the hitting team is down by one run and the first batter leads off the inning with a single or walk, the next batter can control getting him into scoring position and hope that either of the next two batters knocks the run in with a hit. However, this method of control, a bunt, sacrifices an out to move the runner from 1st to 2nd. The defense will usually allow the hitting team to move the runner into scoring position for an out, but the out wasn’t the only sacrifice made. The inning is truncated for the hitting team with one less batter and the potential to have more hitters bat and drive in runs is reduced. Indeed, against a pitcher like Bumgarner, the out is likely not worth the meager 0.238 probability of getting that runner home.  We’ll see in the next section what exactly gets sacrificed for this chance at tying the game.

We should note that in this “runner on 2nd with 1 out” model we added few more assumptions to those we made in the prior “runner on 3rd with 2 outs” model, neither of which should be farfetched. The first assumption is that with the game close and the manager intent on tying the game rather than piling on runs, he should have a runner on 2nd base fast enough to score on a single. Another assumption is that the base runners will be precautious enough not to cause an out on the base paths, yet aggressive enough not to get doubled up or have the lead runner sacrificed in a fielder’s choice play. Lastly, we assume that the combinations of hits, walks, and outs are random, even though we know the current state of base runners and outs can have a predictive effect on the next outcome and the defensive strategy used. By using these assumptions we simplify the factors and outcomes accounted for in these models and reduce the variability between each model.

The final probability formula considers the sequences of walks, hits, and outs that can occur when we start with no outs accumulated; this allows to forge situation will allow us to forge the outcomes from a runner on 1st with no outs scenario and compare them to a runner on 2nd with 1 out scenario.

Formula 5.3

Table 5.3 below uses Bumgarner’s 2014 World Series statistics, the same as before, although in this model we deal with more uncertainty because the sequences captured in each box are not as clear cut between run scoring or not given a runner on 1st with no outs. The yellow and non-highlighted cells are still the respective probabilities of not allowing and allowing the tying run to score, however, we now introduce the green probabilities to represent the hit and walk combinations that could potentially score a run but are dependent on the hit types, sequences of events, and the use of productive outs. These factors were unnecessary in the prior two models because in those models any hit would have scored the run, the sequence of events was inconsequential, and the use of productive outs was unnecessary with the runner is already on 2nd or 3rd base (except when there is a runner on 3rd and a sacrifice fly or fielder’s choice could bring him home).

Table 5.3: Probability of Hit and Walk Combinations after 0 Outs

0 Hits 1 Hit 2 Hits 3 Hits 4 Hits
0 Walks 0.613 0.227 0.056 0.011 0.002
1 Walk 0.050 0.025 0.008 0.002 0.000
2 Walks 0.003 0.002 0.001 0.000 0.000
3 Walks 0.000 0.000 0.000 0.000 0.000
4 Walks 0.000 0.000 0.000 0.000 0.000

We must break down each green probability into subsets of yellow probabilities representing the specific sequences that would not score the tying run from 1st base with no outs; we depict these sequences below, but for simplicity, not all are depicted.
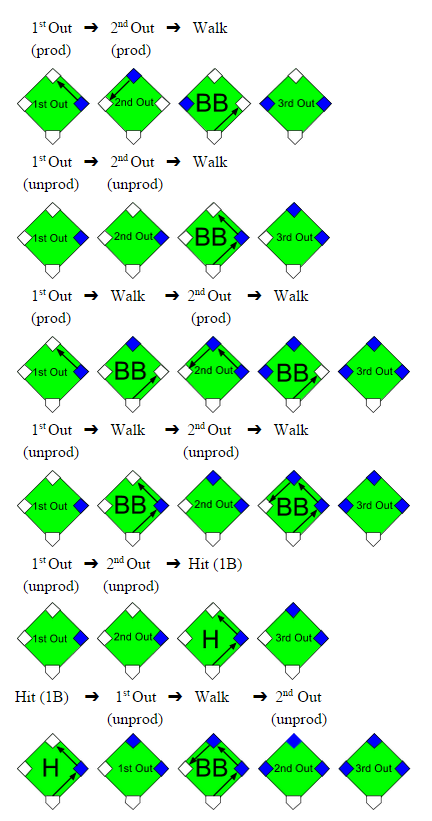
Graphic 5.3

Now that we know the conditions when a run would not score, we take the probabilities from the green cells in Table 5.3, narrow them down according to the proportion of sequences and the proportion of hit types that would not score the run, and separate them based on the usage of productive and unproductive outs; the results are displayed in Table 5.4. For example, there are 6 possible combinations for 1 hit, 1 walk, and 3 outs and 3 of these 6 combinations would not score the tying run on a single, where P(1B | H) = 0.755, with unproductive outs; yet, the run would score with productive outs, with unproductive outs on a double or better, or with unproductive outs and the other 3 combinations. When we finally sum these yellow cells, they tell us that an aggressive manager would score the tying run against Bumgarner with a 0.370 probability and Bumgarner would escape the inning with a 0.630 probability. Otherwise, a less aggressive manager would score the tying run with a mere 0.154 probability and Bumgarner would leave unscathed with a significant 0.846 probability.

Table 5.4: Probability of No Runs Scoring after 0 Outs

Productive Outs Unproductive Outs
0 Hits 1 Hit 0 Hits 1 Hit
0 Walks 0.613 x (1/1) 0.227 x (0/3) 0.613 x (1/1) 0.227 x (3/3) x 0.755
1 Walk 0.050 x (1/3) 0.025 x (0/6) 0.050 x (3/3) 0.025 x (3/6) x 0.755
2 Walks 0.003 x (2/6) N/A 0.003 x (6/6) N/A

We summarize the results from Tables 5.1-5.4 into Table 5.5 from the perspective of the hitting team.  We compare their chances of success not only against Madison Bumgarner from the 2014 World Series but also against Tim Lincecum, Matt Cain, and Jonathan Sanchez from the 2010 World Series.

Table 5.5: Probability of Allowing at least One Run to Score

2010 Tim Lincecum 2010 Matt Cain 2010 Jonathan Sanchez 2014 Madison Bumgarner
Runner on 1st & 0 Outs w/Unproductive Outs 0.305 0.224 0.531 0.154
Runner on 1st & 0 Outs w/Productive Outs 0.576 0.475 0.758 0.370
Runner on 2nd & 1 Out 0.382 0.288 0.543 0.238
Runner on 3rd & 2 Outs 0.212 0.154 0.318 0.127

Let’s return to the scenario that is the launching point for this study… The hitting team is down by one run and there is a runner on 1st base with no outs. If the game is in its early innings, where it is not mandatory that this runner at 1st gets home, the manager will likely decide against being aggressive and avoid sacrificing outs in order to increase his chances of extending the inning to score more runs; there are several studies supporting this logic. Yet, if the game is in the latter innings and base runners are hard to come by, the manager should lean towards utilizing productive outs and intentionally sacrifice the runner from 1st to 2nd base. His shortsighted goal should only be to tie the game.  By forcing productive outs rather than being conservative on the base paths, his chances of tying the game increase significantly (between 0.216 and 0.271) against our four pitchers given a runner on 1st and no outs scenario.

However, the if the manager does successfully orchestrate the runner from 1st to 2nd base with a productive out, he does still lose a little bit of probability of tying the game; between 0.132 and 0.215 of probability is lost against our pitchers. And if he decides to sacrifice the runner further from 2nd to 3rd base with another out, his team’s chances would decrease again by a comparable amount; this decision is ill-advised because a hit is likely going to be needed to tie the game and the hitting team would be sacrificing one of two guaranteed chances to hit in this situation. In general, the probability of scoring at least one run decreases as more outs are accumulated, regardless of the base runners advancing with each out. The manager could contrarily decide against sacrificing his batter if he has confidence that his batter can hit the pitcher or draw a walk, yet the imperative goal is still to tie the game. The odds of tying the game actually favor an aggressive hitting team that is able to get the runner to 2nd base with one out, by an improvement ranging from 0.012 to 0.084, over a less aggressive team with a runner at 1st with no outs. Thus, even though sacrificing the runner from 1st to 2nd base does decrease the chances of tying the game, it would be worse to approach the game lifelessly when the situation demands otherwise.


Thought Experiment: What If the Nationals Sell?

The Washington Nationals, FanGraphs staff unanimous picks to be NL East champions, are off to a rough 7-12 start. Whether those struggles will continue is a matter for another post.

We are not here to talk about what ails the Nationals, or how to fix it. We’re here for a curious hypothetical: what if the Nats’ collapse continues? What if they are below .500 at the All-Star break and become trade deadline sellers?

We’re going to examine four questions. Who would the Nationals sell, how much would the team’s core change, how much money does this save them in 2016, and when would the team contend?

1. Who would the Nationals sell?

Jordan Zimmermann, Doug Fister, Ian Desmond, and Denard Span are impending free agents. Those are four very big names. The Nationals would be poised to offer two of the most valuable starting pitchers on the summer market; Zimmermann and Fister might be rentals, but they also don’t come with Cole Hamels’ massive contract. I think the team could also deal two players who will be free agents after 2016: Stephen Strasburg and Drew Storen.

The potential return here is, obviously, massive. We’re talking about trading away three members of a pitching rotation some analysts thought would be historically great. Strasburg clocked in at #23 on Dave Cameron’s offseason trade value rankings, just behind now-injured Yu Darvish. Although it would be frivolous to speculate on trading partners, given that our scenario is already far-fetched to start with, Ian Desmond and a starting pitcher could go a long way toward solving the Padres’ roster issues.

There are probably only two or three teams in the league that could meet an asking price for Strasburg. Maybe one of them gets desperate. If so, the Nationals probably gain at least one long-term core player. It won’t be Mookie Betts, but then, most good major league regulars aren’t Mookie Betts.

2. How much would the team’s core change?

They would still have Bryce Harper, Anthony Rendon, and Ryan Zimmerman batting, and Gio Gonzalez, Tanner Roark, and Max Scherzer on the mound. You can do worse. 2016-17 will bring Michael Taylor to the outfield, Trea Turner to shortstop, and a number of pitchers into the majors, perhaps including Lucas Giolito, Reynaldo Lopez, Joe Ross, and/or A.J. Cole.

That does not a championship 2016 roster make, but GM Mike Rizzo can demand near-league-ready talent in exchange for half his rotation, his center fielder, his shortstop, and his closer. That’s a lot of bargaining chips, and Rizzo is historically good at extracting trade value. (Wilson Ramos, Tanner Roark, and Doug Fister were acquired for players who contributed a combined -1.6 WAR to their new teams. I am not making that up. Negative 1.6. This excludes Steve Lombardozzi, who never played for Detroit, but posted -0.3 WAR for Baltimore.)

Funnily enough, if this is an imaginary July 2015 where the Nationals are already struggling to reach .500, I don’t think trading everyone away would make the team much worse. The infield can limp to the offseason with Danny Espinosa and Dan Uggla; Michael Taylor can return to center field; and Tanner Roark would step back into the rotation. It’s clearly a less talented roster with less awe-inspiring pitching, but they won’t fall to the cellar, either.

3. How much money does this save in 2016?

Stephen Strasburg and Drew Storen are both entering arbitration, after earning a combined $13.1M in 2015. With Zimmermann, Fister, Desmond, and Span coming off the books, the team doesn’t exactly need to worry about money. Those six players represent $61M of the 2015 payroll. They can also buy out Nate McLouth.

Remember, though, that Rendon enters arbitration in 2016, and Harper a year later.

The only long, potentially burdensome contracts on the club belong to Scherzer (not yet a problem), Ryan Zimmerman (a few years of on-field value remain), and Jayson Werth (ditto). That could be a lot worse. The team does not have an albatross yet.

4. When would the team contend?

With the new wild-card game, the imaginary blown-up Nationals would be contending again in 2016. You still have the core talents of Scherzer, Harper, and Rendon; Gio Gonzalez and Tanner Roark eating innings; and several useful prospects for the outfield and rotation. Surround them with a raft of young talent acquired at the deadline, cross your fingers Lucas Giolito doesn’t blow out his shoulder, and the team would have playoff upside in 2016, with a chance at a division title in 2017.

Conclusion

The Nationals should be fine for 2015. This is still the best and most talented club in the NL East.

But if the Nationals implode? They have a real chance to rebuild very quickly indeed. The Red Sox just went worst-to-first, then back to worst, and now they’re bidding for first again. The “to first” part of that trajectory will be the Nats’ inspiration. If 2015 does become a nightmare in D.C., the Washington front office can use speedy recognition, honest self-assessment, and savvy trading to rebuild a new contending team, and quickly.


The NL West: Time Zones, Ballparks, and Social Investing

I think the National League West is the most idiosyncratic division in baseball. Note that I avoided a more disparaging term, like odd or weird. That’s not what I’m trying to convey. It’s not wrong; it’s just…off. Not bad–it’s home to 60% of the last five World Champions, right?–but different. Let me count the ways. (I get three.)

Time zones

EAST COAST BIAS ALERT!

It is difficult for people in the Eastern time zone to keep track of the NL West. Granted, that’s not the division’s fault. But 47% of the US population lives in the Eastern time zone. Add the Central, and you’re up to about 80%. That means that NL West weeknight games generally begin around the time we start getting ready for bed, and their weekend afternoon games begin around the time we’re starting to get dinner ready. The Dodgers, Giants, and Padres come by it naturally–they’re in the Pacific time zone. The Diamondbacks and Rockies are in the Mountain zone, but Arizona is a conscientious objector to daylight savings time, presumably to avoid prolonging days when you can burn your feet by walking barefoot outdoors. So effectively, four teams are three hours behind the east coast and the other team, the Rockies, is two hours behind.

Here’s a list of the number of games, by team, in 2015 that will be played in each time zone, ranked by the number of games in the Mountain and Pacific zones, counting Arizona among the latter:

Again, I’m fully on board with the idea that this is a feature, not a bug. But it’s a feature that means that a majority, or at least a solid plurality, of the country won’t know, for the most part, what’s going on in with the National League West teams until they get up in the morning.

Ballparks

OK, everybody knows that the ball flies in Coors Field, transforming Jose Altuve to Hack Wilson. (Check it out–they’re both 5’6″.) And the vast outfield at Petco Park turns hits into outs, which is why you can pencil in James Shields to lead the majors in ERA this year. But the other ballparks are extreme as well: Chase Field is a hitter’s park; Dodger Stadium and AT&T Park are pitchers’ havens. The Bill James Handbook lists three-year park factors for a variety of outcomes. I calculated the standard deviations for several of these measures (all scaled with 100 equal to league average) for the ballparks in each division. The larger the standard deviation, the more the ballparks in the division play as extreme, in one direction or the other. The NL West’s standard deviations are uniformly among the largest. Here’s the list, with NL West in bold:

  • Batting average: NL West 10.1, AL West 7.2, AL Central 6.5, AL East 5.8, NL East 5.2, NL Central 1.6
  • Runs: NL West 26.5, NL Central 7.9, NL East 6.9, AL East 4.0, AL Central 2.8, AL West 2.7
  • Doubles: AL East 20.3, NL West 11.3, NL East 6.2, NL Central 5.9, AL Central 5.1, AL West 2.9
  • Triples: NL West 50.6, AL Central 49.5, NL East 33.6, AL West 28.3, AL East 27.8, NL Central 11.1
  • Home runs: NL Central 30.2, NL West 23.9, NL East 20.0, AL East 18.7, AL Central 11.3, AL West 11.2
  • Home runs – LHB: NL Central 31.6, AL East 27.4, NL West 25.6, NL East 21.7, AL West 14.7, AL Central 11.7
  • Home runs – RHB: NL Central 32.1, NL West 24.0, NL East 20.0, AL East 14.4, AL Central 13.6, AL West 10.2
  • Errors: AL East 17.7, NL West 12.2, NL Central 11.6, NL East 11.5, AL West 11.2, AL Central 8.2
  • Foul outs: AL West 36.2, AL East 18.3, NL West 16.0, NL Central 15.2, AL Central 13.8, NL East 6.2

No division in baseball features the extremes of the National League West. They ballparks are five fine places to watch a game, but their layouts and geography do make the division idiosyncratic.

Social Investing

You may be familiar with the concept of social investing. The idea is that when investing in stocks, one should choose companies that meet certain social criteria. Social investing is generally associated with left-of-center causes, but that’s not really accurate. There are liberal social investing funds that avoid firearms, tobacco, and fossil fuel producers and favor companies that offer workers various benefits. But there are also conservative social investing funds that don’t invest in companies involved in alcohol, gambling, pornography, and abortifacients. This isn’t a fringe investing theme: By one estimate, social investing in the US totaled $6.57 trillion at the beginning of 2014, a sum even larger than the payrolls of the Dodgers and Yankees combined.

Here’s the thing about social investing: You’re giving up returns in order to put your money where your conscience is. That’s OK, of course. The entire investing process, if you think about it, is sort of fraught. You’re taking your money and essentially betting on the future performance of a company about which you know very little. Trust me, I spent a career as a financial analyst: I don’t care how many meals you eat at Chipotle, or how many people you know at the Apple Genius Bar, you can’t possibly know as much about the company as a fund analyst who’s on a first-name basis with the CEO. So there’s no sense in making it even harder on yourself by, say, investing in the company guilty of gross negligence and willful misconduct in a major oil spill, if that’d bother you.

Note that I said that with social investing, you’re giving up returns. Some social investing proponents would disagree with me. They claim that by following certain principles that will eventually sway public opinion or markets or regulations, they’re investing in companies that’ll perform better in the long run. That’s a nice thought, but social investing has been around for decades, and we haven’t yet hit that elusive long run. The Domini 400 Index, which was started in 1990, is the oldest social investing index. It started well in the 1990s, but has lagged market averages in the 21st century. Now called the MSCI KLD 400 Social Index, it’s been beaten by the broad market in 10 of the past 14 years. It’s underperfomed over the past year, the past three years, the past five years, and the past ten years, as well as year-to-date in 2015. The differences aren’t huge, but they’re consistent. Maybe for-profit medicine in an aberration, but acting on that meant that you missed the performance of biotechnology stocks last year, when they were up 47.6% compared to an 11.4% increase for the S&P 500. Maybe we need to move toward a carbon-free future, but stocks of energy companies have outperformed the broad market by over 100 percentage points since January 2000. I think that most social investing investors are on board with this tradeoff, but some of the industry proponents have drunk the Kool-Aid of beating the market. That’s just not going to happen consistently. In fact, a fund dedicated to tobacco, alcohol, gambling, and defense (aka “The Four B’s:” butts, booze, bets, and bombs) has outperformed the market as a whole over the past ten years.

OK, fine, but what does this have to do with the National League West? Well, two of its members have, in recent years, made a point of pursuing a certain type of player, just as social investing focuses on a certain type of company. The Diamondbacks, under general manager Kevin Towers and manager Kirk Gibson, became a punchline for grit and dirty uniforms and headhunting. (Not that it always worked all that well.) The Rockies, somewhat less noisily, have pursued players embodying specific values. Co-owner Charlie Monfort (a man not without issues) stated back in 2006,  “I don’t want to offend anyone, but I think character-wise we’re stronger than anyone in baseball. Christians, and what they’ve endured, are some of the strongest people in baseball.” Co-owner Dick Monfort described the team’s “culture of value.” This vision was implemented by co-GMs (hey, Colorado starts with co, right?) Dan O’Dowd and Bill Geivett. (OK, O’Dowd was officially GM and Geivett assistant GM, but the two were effectively co-GMs, with Geivett primarily responsible for the major league team and O’Dowd the farm system).

Now, there’s nothing wrong with players who are also commendable people. You could do a lot worse than start a team with Clayton Kershaw and Andrew McCutchen, to name two admirable stars. Barry Larkin was a character guy. So was Ernie Banks. Brooks Robinson. Walter Johnson. Lou Gehrig. All good guys.

But holding yourself to the standards set by the Diamondbacks and Rockies also means you’re necessarily excluding players who are, well, maybe more characters than character guys.  Miguel Cabrera has proven himself to be a tremendous talent and a somewhat flawed person. Jonathan Papelbon has a 2.67 ERA and the most saves in baseball over the past six years, but he’s done some things that are inadvisable. Carlos Gomez, a fine player, second in the NL in WAR to McCutchen over the past two years, has his detractors. Some of the players whom you’d probably rather not have your daughter date include Babe Ruth, Ty Cobb, Rogers Hornsby, Barry Bonds, and many of the players and coaches of the Bronx Zoo Yankees.

I want to make a distinction here between what the Diamondbacks and Rockies did and the various “ways” that teams have–the Orioles Way, the Cardinals Way, etc. There’s plenty of merit in developing a culture starting in the low minors that imbues the entire organization. That’s not what Arizona and Colorado did. They specified qualities for major leaguers, and, in the case of the Diamondbacks at least, got rid of players who didn’t meet them. I don’t know what’s wrong with Justin Upton, but for some reason, Towers didn’t like something about him, trading him away. The Braves make a big deal about character, but of course they traded for Upton, so the Diamondbacks went way beyond anything the Braves embrace.

In effect, what the Diamondbacks and Rockies have done is like social investing. They’ve viewed guys who don’t have dirty uniforms or aren’t good Christians or something the same way some investors view ExxonMobil or Anheuser-Busch InBev. Again, that’s their prerogative, but it loses sight of the goal. Investors want to maximize their returns, but as I said, most social investors realize that by focusing on only certain types of stocks, they’ll have slightly inferior performance. They’ll give up some performance in order to hew to their precepts. Baseball teams want to maximize wins, and there really isn’t any qualifier related to precepts you can append to that.

The Rockies and Diamondbacks were living under the belief that by focusing on only certain types of players, they could have superior performance. It’s like the people who think they can beat the market averages through social investing. It hasn’t happened yet. And, of course, the Diamondbacks and Rockies were terrible last year, with the worst and second-worst records in baseball. Just as social investing doesn’t maximize profits, the baseball version of social investing didn’t maximize wins in Phoenix or Denver.

I’ve used the past tense throughout this discussion. Towers, Gibson, O’Dowd, and Geivett are gone, replaced by GM Dave Stewart and manager Chip Hale in Arizona and GM Jeff Bridich in Colorado. (The Monforts remain.) Last year, the Diamondbacks created the office of Chief Baseball Officer, naming Tony LaRussa, a Hall of Fame manager who’s been less than perfect as a person and in the types of players he tolerates. These moves don’t change that these are both bad teams. But by pursuing a well-diversified portfolio of players going forward, rather than a pretty severe social investing approach, both clubs, presumably, can move toward generating market returns. Their fans, after all, never signed on to an approach that willingly sacrifices wins for the sake of management’s conscience.


The Method to the Yankees’ Madness

Last week Miles Wray examined an emerging spending pattern of the New York Yankees, suggesting that the club’s approach to free agent spending varies, depending possibly on how many dollars had recently come off their books: They appear to spend each offseason either signing seemingly every premium free agent available (2008-9, 2013-4) or they limit themselves to the bargain bin, focusing on late-offseason signings, reclamation projects, and trades.

While this description is certainly accurate, at least since 2008-9 when this pattern began to emerge, there’s little discussion of why a team would choose to invest in free agency this way.  Presumably, teams like the Yankees, the Dodgers, or the Red Sox, which are capable of fielding significantly higher payrolls than any other team in the league, would prefer to do the opposite: Selecting from a much more limited subset of free agents would limit the advantage gained over other teams.  It’s also not inconceivable that a team with as much money as the Yankees might have concerns that they’d be driving up the entire market, increasing their own cost of acquiring talent.  This approach also has very real impacts on team age and roster flexibility as an entire free agent crop begins to enter their decline years together.

Moreover, the Yankees may very well not be the only team taking this approach.  An argument can be made that the Boston Red Sox are following a similar strategy, albeit at a pace accelerated by their shorter duration contracts they signed in the 2012-3 offseason and their salary-dump trade with the Dodgers four months earlier.  The team signed both Hanley Ramirez and Pablo Sandoval, arguably the two top hitters available in free agency, only a year after they signed precisely one free agent, Mike Napoli, who was their own.

So what does a team gain by going on spending sprees followed by (relative) austerity?  I submit they pursue this approach to gain one thing: draft picks.

Consider for the moment what happens in the case where the Yankees are not following this feast/famine strategy in free agency, and instead they sign a premium free agent each year.  In 2009-10 they might’ve signed Matt Holliday or Jason Bay.  2010-1, Carl Crawford or Jason Werth.  In 2011-2, Fielder/Pujols/Reyes.  In 2012-3 Upton/Hamilton/Bourne/Grienke.  All were free agents tied to compensation, meaning in addition to the dollar-cost of signing that player, the signing team also forfeited a draft pick.  (It’s probably also worth noting how godawful most of those signings look today, but that’s the nature of free agency – The last couple of years are almost always ugly.)  The mechanics of where those picks go have changed since the 2012-3 offseason but the cost to the signing team remains the same: A first round draft pick, or a later round pick if the first round pick is already spoken for.

Instead of signing those players, over that span the New York Yankees signed only a single draft-pick-compensation free agent, Rafael Soriano, 2010-11, and it was over the objections of Brian Cashman.  They kept their first-round draft picks in 2010, 2012, and 2013, and picked up a few compensation picks from departing free agents like Nick Swisher, Javier Vázquez and Soriano.

As Miles points out, however, the Yankees simply can’t stockpile picks and rebuild like a normal team.  This restraint is made possible by lavish spending in the 2008-9 offseason, where the Yankees signed pretty much everybody and then went out and won the World Series.  Signing Teixeira, Sabathia, and Burnett means the Yankees not only forfeited their first round draft pick, but their second and third round draft picks as well.

When viewed in the whole, however, this doesn’t appear to be that bad of a deal for the Yankees.  By moving their spending forward into the 2008-9 offseason instead of spreading it out over four years, they essentially traded their second and third round draft picks in 2009 for first-round draft picks in 2010, 2012, and 2013.  They repeated this approach 2013-4, signing Brian McCann, Jacoby Ellsbury, and Carlos Beltran, and while the early returns from those transactions are not promising, it should be noted that the McCann and Ellsbury deals, at least, were considered sound at the time they were signed.  Beltran?  Not so much.  With the last free agent with draft pick compensation attached off the board, they’re keeping their 2015 first round pick as well.

At a time when the aging curve for older players have suddenly become unforgiving, the value of young players is certainly up, and the Yankees appear to be maximizing their chances of acquiring young talent in the draft by minimizing the draft pick cost of signing free agents.  This approach is remarkably similar to their strategy in the international market, where they’ve determined the best way to acquire talent is not to stick to a limited bonus pool each year, but to sign ten or eleven of the top thirty international free agents, (and possibly one more.)  This approach costs them a great deal of money in luxury tax and international bonus pool “overage” tax, but may make sense given how much surplus value an above-average, cost-controlled young player generates.  Now, if only they could do something with all those draft picks


How to Use LABR Mixed Draft to Your Benefit

The 15-team LABR Mixed Draft is the most exciting of the expert fantasy drafts each year. Amateur fantasy owners from all over the globe tune into the live spreadsheet broadcast and debate each one furiously on social media.

Most of these amateurs are looking for expert guidance to help them in their own draft. They see a player getting drafted well above their ADP and they often move the player up on their own personal big board.

I do not think this is the best way to approach and absorb the most information out of LABR. When one expert reaches on a pick, we have no idea if there is a consensus. It could have been just one expert making a stand on a player he himself feels strongly about, or there could have been several owners who felt the same way about that player. We just don’t know.

What we do know is that when certain players drop well below their public rankings, there is an agreement of pessimism. That is the information that could be significant for the rest us. Every owner in the league letting a player fall well below their ADP is the expert consensus we should be looking for.

Here’s a quick look at nine players who the experts are cool on.

Read the rest of this entry »


The Disappearing Downside of Strikeout Pitchers

In 1977, Nolan Ryan was in the midst of his dominant tenure pitching for the California Angels. Four years before, he had broken Sandy Koufax’s modern strikeout record, and his stuff wasn’t going away. The 30 year-old finished the ’77 season three outs shy of 300 innings, and struck out 10.3 batters per nine innings. Those 341 strikeouts came with a home run rate 60% lower than league average.

Yet, somehow, Ryan was not the best pitcher in baseball that season. He finished 3rd in AL Cy Young voting. In the majors, he was 4th in pitcher WAR, 10th in Wins, 7th in ERA, and 9th in FIP. So how could such an unhittable season be so clearly something other than the best in baseball?

In 1977, Nolan Ryan walked 204 batters. That is 5.5 walks per start. With Tom Tango’s Linear Weights, we can say that Ryan’s walks cost the Angels over 60 runs, which is ~30 runs worse than if he had a league-average walk rate. Batters were fairly helpless against Nolan Ryan, but what help they did get, they got from him.

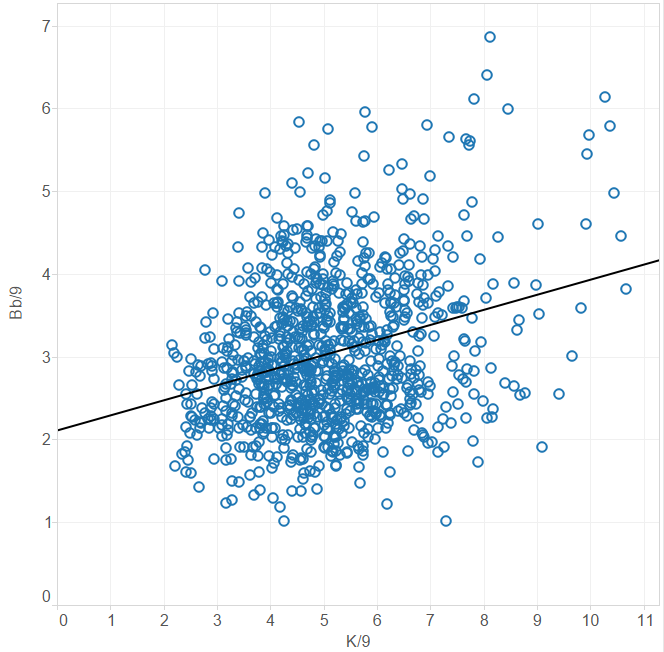
In the 1970’s, this phenomenon was not unheard of. Pitchers who struck the most hitters out tended to walk the most as well. (Note: for this article, I’m including pitchers who threw 140+ innings)

K BB 1970s

For every additional 5-6 strikeouts, you could expect an additional walk from a pitcher. This is not surprising for a few reasons. The main two that come to my mind are:

1) If a pitcher strikes out a lot of hitters, then GM’s and managers will be more willing to tolerate a lack of control, and
2) Harder throws, nasty movement, and a focus on offspeed pitches can lead to strikeouts and make balls harder to locate.

It seems natural that there would be a positive relationship here, and it goes along well with the idea that flamethrowers are wild.

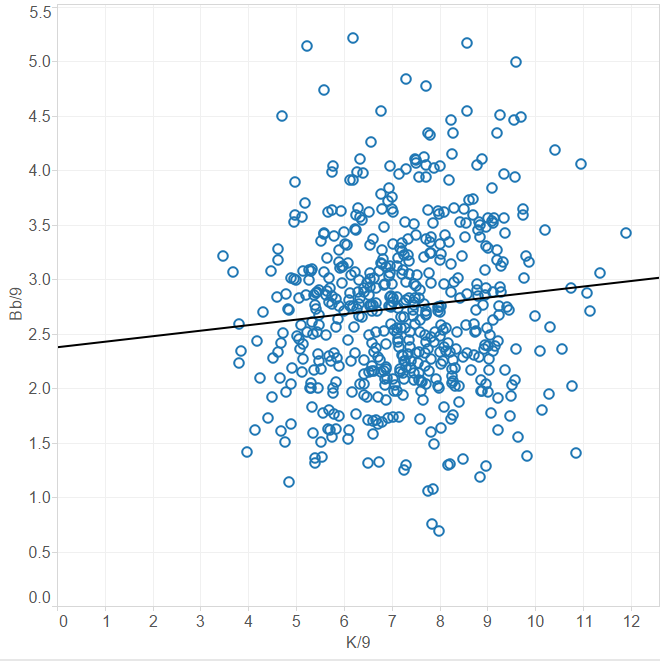
But could that relationship be going away? Here’s the same chart, but instead of being the 1970’s, this is for the year 2010 and on:

K BB 2010s

In this span, it takes 20 strikeouts to expect an additional walk. There’s still a relationship, but it’s much looser.

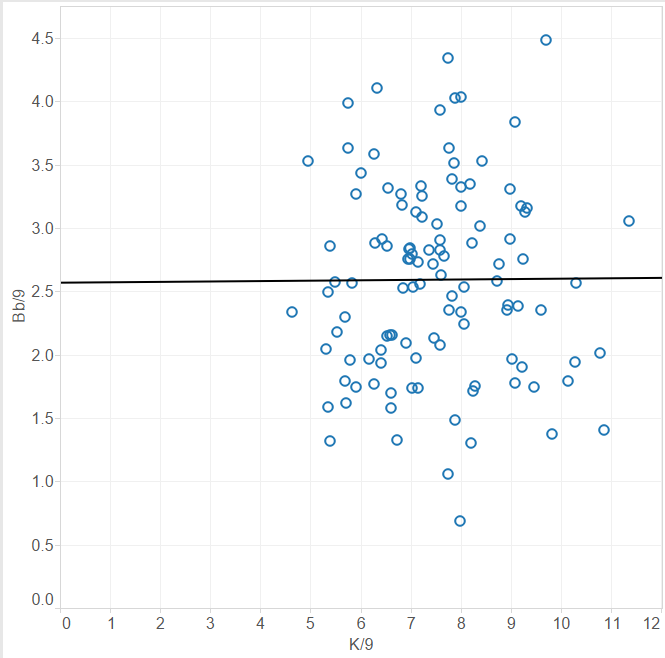
And while it’s possibly irresponsible to look at sample sizes this small, the relationship was almost completely gone last year. If we only look at 2014 pitchers, we see the following:

K BB 2014

Given that the model here suggests that 300 strikeouts lead to one walk, I think it’s safe to say there wasn’t a meaningful relationship between strikeouts and walks last year.

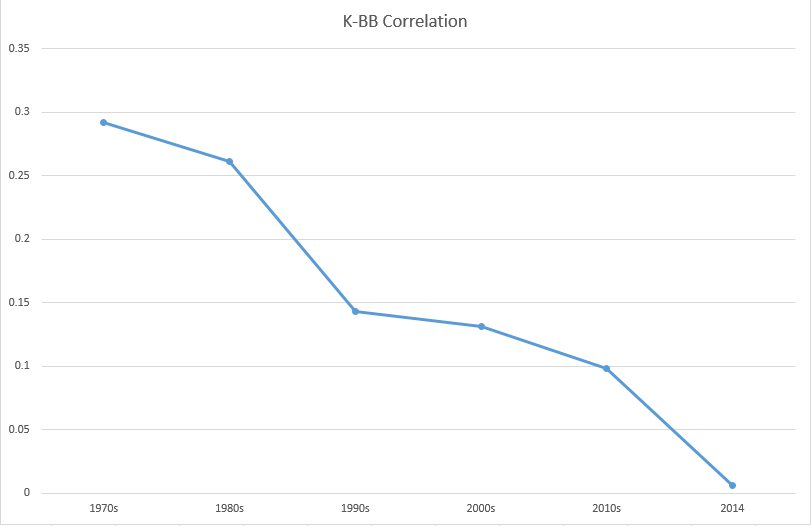
It’s important to note that this is a continued trend. There has not been a specific time when strikeout pitchers decided to stop walking people. Broken up by decade, this is something that has constantly been occurring over the last 40 years.

K BB Correlation Decades

I’m not exactly sure what the big takeaway from this is, but I’m more curious about what is causing this shift. As far as the results from such a change, I do not believe this explains the drop in offense, since the trend continued through the booming offense of the late ’90s and early 2000s.

Maybe player development is better than it used to be. If coaches can better address player weaknesses, it would be possible for pitchers to be more well rounded.

Perhaps teams are less willing to tolerate players with large weaknesses, even if they are strong in another area. I find this theory unlikely in an age when almost any strength can be valued and measured.

It’s possible that pitchers try to strike batters out differently than they used to. Maybe they used to be more likely to try to get hitters to chase balls out of the zone to get a third strike, leading to more walks.

Most likely, it’s something that I am missing. But regardless, we are no longer in an era where a pitcher like Nolan Ryan leads the league in strikeouts, and you simply have to deal with his astronomical walk numbers. The modern ace is tough to hit and can command the zone, and there are plenty of them.


A Look at SGP-Based Rankings Using Different Projection Sets (Part 1)

The bulk of the work I do pre-draft and in-season is essentially based on an SGP (standings gain points) projections and ranking system. I use SGP data from leagues that match the format and settings of the league I’m ranking for (ideally from 10+ years of data from the actual league, where possible). While I usually do my own projections for 30-40 players of specific interest, in general I’m happy to utilize the projections published by experts that actually know what they’re doing and do it for a living. Specifically (and in no particular order) I use Steamer, Pecota, and Baseball HQ.

These lists may not be useful in ‘absolute’ terms – again, the data I’m using here reflect the SGP settings I use that reflect the league I play in. However, I still believe the lists offer an interesting way to notice a) how each projection system differs on its view of individual players, and b) general overall differences in each projection system. Blindly following a projection set is probably going to be better than randomly picking players by throwing darts at the wall. But you can squeeze a lot more value out of these rankings and the projections you use by gaining a deeper understanding of how each set of projections work, and what ‘biases’ and tendencies might be part of the numbers.

What I like to do each year is generate ‘top X’ lists of players at each position for each projection set I use, then play around in the results to spot any glaring differences.  Is one projection overly conservative on expected ABs? Is one projection set basically expecting a repeat of last year’s career year? I can use that as a starting point to drill down into some of the numbers to see what might be behind the differences. Personally, I find it all too easy to get overwhelmed at all the different numbers available to be looked at – far too often I find myself deep down the rabbit’s hole, spending three hours looking at average fly ball distance on balls hit on the second Wednesday of the month on even-numbered days or something. I find this approach helps me narrow in on specific players or numbers of interest. And the benefit of doing this by SGP, broken down by category, is that it is easier to see specifically how each player is projected to impact each category. Player stats will not win your fantasy league, roto points will win you your fantasy league: I get a better understanding of the player’s ‘value components’ and how it impacts the particular league I play in.

First, a quick overview of SGP. Standings Gain Points is a way to measure the contribution of each player to your overall roto league standings. Larry Schecter’s excellent book, ‘Winning Fantasy Baseball’ is a great primer on the subject. Other places to read about SGP online are here and here. In a nutshell the system looks at the average stats needed to gain one point in the standings for a particular rotisserie category. For example, suppose in your league over the past 10 years, you needed 10 HRs to gain one point in the HR category standings. A player projected to hit 30 home runs would be credited with 3 SGPs for the HR category. Tally up all the SGPs the player is expected to add (or subtract) for all categories, and you get a total SGP score.

There’s a ton more to it, but that’s the basics – ever tried to figure out if the guy hitting a lot of HRs but no average was more valuable (and if so, by how much) than the guy hitting for a decent average and some SBs but no power? Now you have an idea.

In this first article, I look at at Catchers. I’ll add reports on all the hitter positions over the next couple of weeks. A reminder that these rankings are based on SGP values which are basically unique to my specific league, so your numbers will differ if you play in a different league format, but again, we’re looking a relative differences, not absolute numbers (For the record, the league format for the SGP rankings here: Standard 12-team 5×5 roto, 1 catcher, three OF and two util, 1250 innings cap).

Here is the list of top 12 catchers ranked by my league’s SGP, based on Baseball HQ projections:

Figure 1. Top 15 catchers by SGP & BHQ projections

Rank MLBAMID Full Name RSPG HRSPG RBISPG SBSPG AVGSPG Total
1 457763 Buster Posey 4.22 2.66 4.60 0.15 1.24 12.87
2 543228 Yan Gomes 4.22 3.08 4.28 0.15 0.12 11.84
3 519023 Devin Mesoraco 3.73 3.78 4.33 0.15 -0.31 11.67
4 594828 Evan Gattis 3.48 4.33 4.12 0.00 -0.48 11.45
5 518960 Jonathan Lucroy 3.98 2.24 3.84 0.73 0.62 11.40
6 431145 Russell Martin 3.54 2.52 3.84 1.02 -0.12 10.80
7 521692 Salvador Perez 3.54 2.38 4.01 0.00 0.46 10.39
8 435263 Brian McCann 3.42 3.50 4.01 0.15 -0.68 10.38
9 425877 Yadier Molina 3.66 1.54 3.74 0.58 0.71 10.23
10 467092 Wilson Ramos 2.86 2.52 3.84 0.00 -0.16 9.06
11 446308 Matt Wieters 3.11 2.38 3.41 0.15 -0.14 8.90
12 444379 John Jaso 3.85 1.54 3.19 0.44 -0.32 8.70
13 572287 Mike Zunino 3.66 2.80 3.68 0.00 -1.52 8.63
14 519083 Derek Norris 3.29 1.96 3.14 0.73 -0.72 8.40
15 425900 Dioner Navarro 2.61 1.96 3.25 0.29 0.05 8.16

Nobody should be surprised to see Buster Posey at the top of any catchers list; he’s there because he has such a huge advantage over everyone else at the position in Batting Average. And he has a full point advantage over the next tier of players. Gomes and Mesoraco at 2nd and 3rd? Probably more of a surprise. Gomes has legit power, and the batting average isn’t a fluke (career BABIP: .323). Mesoraco had a career year last year – his 25 HRs in 440 PA is only 6 fewer than he hit in 1,100 PAs in 2013, 2012, 2011 combined. Yes, he plays in a tiny crackerjack box of a park. But his FB% jumped 10ppt (33.8% to 43%) from 2013 and 2014, while his HR/FB rate more than doubled, from a constant 10% or so in 2011-2013 to 20.5% in 2014. Color me less than convinced. And with only .44 points separating them, the next four players (Gomes, Mesoraco, Gattis and Lucroy) are basically interchangeable.

Russell Martin’s ranking gets a big boost from expected SB contribution; if those SBs dip he falls quite a bit. Would anyone be surprised if a catcher that turns 32 in February and was only 4-of-8 in stolen base attempts last year doesn’t run that much in 2015?

Conversely, if Zunino can boost his average a bit, he could be excellent late-round value. He gets a massive -1.52 hit to his SGP total after hitting less than his weight last year. On the one hand, one could possibly expect a bit of an uptick in the batting average; his BABIP last year of .248 was the lowest mark he’s recorded at any point for a full season going back to 2012 and his days in the Arizona Fall League. On the other hand, he struck out 33% of the time last year, so…yeah.

Finally – what’s surprising about this list is who’s not on it – no d’Arnaud, no Rosario.

Figure 2. Top 15 catchers by SGP & Steamer projections

Rank MLBAMID Full Name RSPG HRSPG RBISPG SBSPG AVGSPG Total
1 457763 Buster Posey 4.29 2.66 4.06 0.15 0.87 12.02
2 594828 Evan Gattis 4.22 3.92 4.28 0.15 -0.88 11.68
3 435263 Brian McCann 3.85 3.36 3.79 0.15 -0.54 10.61
4 518960 Jonathan Lucroy 4.04 1.96 3.47 0.73 0.36 10.55
5 431145 Russell Martin 3.79 2.24 3.19 0.87 -0.81 9.28
6 518595 Travis d’Arnaud 3.29 2.38 3.25 0.29 -0.54 8.67
7 521692 Salvador Perez 3.23 1.96 3.14 0.15 0.10 8.58
8 446308 Matt Wieters 3.35 2.38 3.03 0.44 -0.68 8.52
9 543228 Yan Gomes 3.17 2.24 3.09 0.29 -0.36 8.42
10 519023 Devin Mesoraco 2.98 2.52 2.98 0.44 -0.60 8.31
11 467092 Wilson Ramos 2.86 2.24 2.98 0.15 -0.03 8.19
12 425877 Yadier Molina 2.92 1.40 2.76 0.44 0.35 7.86
13 501647 Wilin Rosario 2.30 1.96 2.44 0.29 0.16 7.14
14 518735 Yasmani Grandal 2.98 1.82 2.71 0.29 -0.69 7.11
15 455139 Robinson Chirinos 2.73 1.68 2.49 0.29 -0.80 6.39

The first thing to notice about this list – in general the total ‘SGP’s provided are considerably lower than for the BHQ group above. At 8.90 total SGPs, Wieters wasn’t even in the top 10 in the BHQ list; 8.90 SGPs almost makes him a top-5 pick on this list. The numbers suggest that Steamer is a bit more conservative (or BHQ overly optimistic) in its forecasts, particularly for HR and RBIs. My understanding is that BHQ’s projections are largely based on playing time projections, so perhaps the numbers will change as we get closer to spring training and the start of the season and jobs are won/lost etc. It will be interesting to see how (if) these numbers change.

Looking at the list itself, Posey and Gattis again in the top five, no surprise there. McCann in the top five looks somewhat surprising (despite a rather big gap between Gattis and McCann). Maybe Steamer remembers that McCann still hit 23 HRs last year and still plays in a favorable park? His LD% was stable last year, GB% down a tick, FB% up a tick. His HR/FB rate was down quite a bit from 2013, which is surprising given that the conventional wisdom suggested he was moving to a more favorable ballpark…but his 2014 HR/FB rate was almost exactly in line with his average since 2008. Steamer might also be expecting an uptick on that awful .231 BABIP from 2014, although not sure if it’s factoring in the increased defensive shifts he saw last year. Less than .50 points separate d’Arnaud at #6 and Ramos at #11. Of the group, Wieters is now the grizzled veteran of the bunch and looked like he was on his way to a career year before getting hurt last year. If he’s healthy, he ironically could be the ‘safe’ pick of the bunch.

Grandal makes an appearance. Interestingly, Steamer is forecasting almost exactly the same number of Runs, RBIs and HRs this year – in the same number of at-bats – as last year, despite Grandal moving from a horrible Padres team (last year at least) to a much better Dodgers team (last year at least). I’d normally expect a bit of an uptick in those numbers.

Spoiler alert, but this is the only projection where Chirinos comes in the top 15; Steamer appears to be a bit more optimistic in projected at-bats, giving him a bump in Runs and RBIs that he doesn’t enjoy in the other projections.

Figure 3. Top 15 catchers by SGP & Pecota projections

Rank MLBAMID Full Name RSPG HRSPG RBISPG SBSPG AVGSPG Total
1 594828 Evan Gattis 4.41 4.19 4.82 0.0 -0.6 12.82
2 457763 Buster Posey 4.47 2.66 4.33 0.15 0.90 12.51
3 435263 Brian McCann 4.10 3.36 4.12 0.15 -0.78 10.93
4 431145 Russell Martin 4.85 2.38 3.30 1.16 -1.13 10.56
5 518960 Jonathan Lucroy 3.98 1.96 3.68 0.87 0.06 10.54
6 518595 Travis d’Arnaud 3.91 2.66 3.68 0.15 -0.57 9.83
7 521692 Salvador Perez 3.54 1.96 3.68 0.0 0.33 9.51
8 446308 Matt Wieters 3.66 2.38 3.57 0.29 -0.77 9.14
9 425877 Yadier Molina 3.42 1.54 3.19 0.58 0.39 9.12
10 572287 Mike Zunino 3.79 3.08 3.74 0.29 -1.79 9.1
11 543228 Yan Gomes 3.23 2.24 3.09 0.15 -0.03 8.67
12 518735 Yasmani Grandal 3.66 2.10 3.09 0.29 -0.56 8.58
13 519023 Devin Mesoraco 3.23 2.38 3.25 0.29 -0.68 8.47
14 455104 Chris Iannetta 4.04 1.96 3.19 0.44 -1.46 8.16
15 467092 Wilson Ramos 3.11 1.96 2.92 0.0 -0.26 7.73

Pecota loooooves it some Gattis, putting him in the top spot over Posey. The Pecota rankings for catchers have fairly clear tiers: Gattis and Posey at the top, a substantial gap to McCann, Martin, and Lucroy, then another gap, followed by only a point or so between d’Arnaud at #6 and Iannetta at #14. Iannetta actually only shows up here because Pecota is significantly more bullish on Iannetta across the board vs the other projection sets; this almost certainly is due to differing views on ABs; Pecota’s AB projection for Iannetta is about 80 ABs higher than the BHQ projection, and over 150 more than the Steamer projection.

The difference between the Pecota numbers for Yan Gomes and the BHQ numbers are interesting – BHQ projects Gomes as one of the top 3-4 HR hitters at the catcher spot; here he’s projected to be 8th.

Martin again gets a big SB bump, which just manages to offset a rather large Avg hit (particularly compared to, say the BHQ projection, where the Avg hit was minor). Pecota is probably looking at his .290 average last year and figuring it’s a .336 BABIP-fueled fluke; Martin hadn’t had a BABIP over .290 since 2008.

Zunino again projects to have great all-around numbers except for the black hole at Batting Average. If he somehow is able to hit even .250, Zunino would likely be a top-five fantasy play behind the plate.

Looking at all three rankings, the projections differ – sometimes significantly – on some players. The BHQ-based SGP rankings loved Yan Gomes and Mesoraco; Steamer and Pecota, not so much. At the other end of the spectrum: Salvador Perez was ranked 7th in all three projection systems, largely because he’s one of the few catchers expected to make a reasonably-sized positive contribution to batting average. Although we saw last time that maybe targeting batting average wasn’t all that important…