A Discrete Pitchers Study – Out & Base Runner Situations
(This is Part 4 of a four-part series answering common questions regarding starting pitchers by use of discrete probability models. In Part 1 we explored perfect game and no-hitter probabilities, in Part 2 we further investigated other hit probabilities in a complete game, and in Part 3 we predicted the winner of pitchers’ duels. Here we project the probability of scoring at least one run in various base runner and out scenarios.)
V. I Don’t Know’s on Third!
Still far from a distant memory, the final out of the 2014 World Series was preceded by an unexpected single and a nerve-racking error that brought Alex Gordon to 3rd base with two outs. Closer Madison Bumgarner, who was on fire throughout the playoffs as a starter, allowed the hit but would be left in the game to finish the job. There is some debate as to whether Gordon should have been sent home rather than stopped at 3rd base , but it would have taken another error overshadowing Bill Buckner’s to get him home; also, next up to bat was Salvador Perez, the only player to ever ding a run off Bumgarner in three World Series. So even though the Royals’ 3rd Base Coach Mike Jirschele had to make a spur of the moment critical decision to stop Gordon as he approached 3rd base, it was a decision validated by both statistics and common sense. We will show our own evidence, by use of negative multinomial probabilities, of how unlikely the Royals would have scored the tying run off of Bumgarner with a runner on 3rd with two outs and we will also consider other potential game-tying or winning situations.
Runs are generally strung together from sequences of hits, walks, and outs; in the situations we will consider, we will only focus on those sequences that lead to at least one run scoring and those that do not. Events not controlled by the batter in the box, such as steals and errors, could also potentially reshape the situation and lead to runs, but we’ll take a very conservative approach and assume a cautious situation where steals are discouraged and errors are extremely unlikely.
Let A and B be random variables for hits and walks and let P(H) and P(BB) be their respective probabilities for a specific pitcher, such that OBP = P(H) + P(BB) + P(HBP) and (1-OBP) is the probability of an out; we combine the hit-by-pitch probability into the walk probability, such that P(BB) is really P(BB) + P(HBP) because we excluded hit-by-pitches from our models, P(HBP) > 0 against Bumgarner in the 2014 World Series, and the result on the base paths is the same as a walk. The first negative multinomial probability formula we’ll introduce considers the sequences of hits, walks, and an out that can occur after two outs have been accumulated, setting the hypothetical stage for the last play in Game 7 of the 2014 World Series.
In the 2014 World Series, Bumgarner’s dominantly low P(H) and P(BB) were respectively 0.123 and 0.027 and his (1-OBP) was 0.849; by applying these values to the formula above we can generate the probabilities of various hit and walk combinations shown in Table 5.1. The yellow highlighted cells in the table represent the combination of hits and walks that would let Bumgarner escape the inning without allowing the tying run (given a runner on 3rd with two outs and a one run lead). By combining these yellow cells, we see that the odds were overwhelmingly in in Bumgarner’s favor (0.873); all he had to do was get Perez out, walk Perez and get the next batter out, or walk two batters and get the third out.
Table 5.1: Probability of Hit and Walk Combinations after 2 Outs
| 0 Hits | 1 Hit | 2 Hits | 3 Hits | 4 Hits | |
| 0 Walks | 0.849 | 0.105 | 0.013 | 0.002 | 0.000 |
| 1 Walk | 0.023 | 0.006 | 0.001 | 0.000 | 0.000 |
| 2 Walks | 0.001 | 0.000 | 0.000 | 0.000 | 0.000 |
| 3 Walks | 0.000 | 0.000 | 0.000 | 0.000 | 0.000 |
| 4 Walks | 0.000 | 0.000 | 0.000 | 0.000 | 0.000 |
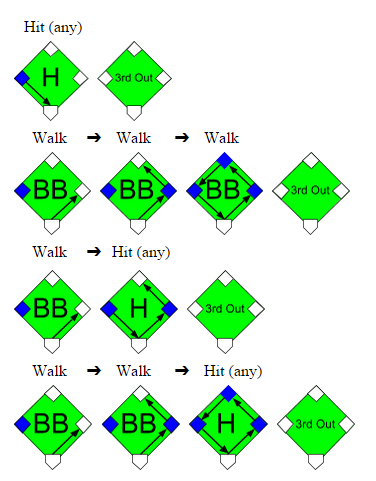
The Royals could have contrarily tied the game with a simple hit from Perez given the runner on 3rd and two outs, yet this wasn’t the only sequence that would have kept the Royals hopes alive. Three consecutive walks, one walk and one hit, or any combination of walks and one hit could have also done the job; examples of these sequences are shown in the graphics below:
Generally, any combination of walks and hits not highlighted yellow in Table 5.1 would have tied or won the World Series for the Royals. This glimmer of hope was a quantifiable 0.127 probability for Kansas City, so it was justified that Gordon was kept at 3rd rather than sent home after shortstop Brandon Crawford just received the ball. It would have taken an error from Crawford or Buster Posey, with respective 0.033 and 0.006 2014 error rates, to get Gordon home safely. The probability 0.127 of winning the game from the batter’s box is noticeably three times greater than the probability of winning it from the base paths (where Crawford and Posey’s joint error probability was 0.039).
We should note that the layout in Table 5.1 is a simplification of what could occur with a runner on 3rd, two outs, and a one run lead, because it only applies to innings where a walk off is not possible. In innings where a walkoff can occur, such as the bottom of the 9th, the combinations of walks and hits captured in the red highlighted cells are not possible because they would occur after the winning run has scored and the game has ended. However, Bumgarner was so dominant in the World Series that these probabilities are almost non-existent, thereby making our model is still applicable; we would otherwise exclude these red-celled probabilities for less successful pitchers.
The next probability formula considers the sequences of walks, hits, and outs that can occur after one out has been accumulated, which is situation definitely worth examining if there is a lone runner on 2nd base.
Once again we’ll use Bumgarner’s 2014 World Series statistics to evaluate this formula and insert the probabilities into Table 5.2. According to the sum of the yellow cells, Bumgarner would be able to prevent the tying run from scoring (from 2nd base with one out) with a probability of 0.762 and would otherwise allow the tying run with a probability of 0.238.
Table 5.2: Probability of Hit and Walk Combinations after 1 Out
| 0 Hits | 1 Hit | 2 Hits | 3 Hits | 4 Hits | |
| 0 Walks | 0.721 | 0.178 | 0.033 | 0.005 | 0.001 |
| 1 Walk | 0.040 | 0.015 | 0.004 | 0.001 | 0.000 |
| 2 Walks | 0.002 | 0.001 | 0.000 | 0.000 | 0.000 |
| 3 Walks | 0.000 | 0.000 | 0.000 | 0.000 | 0.000 |
| 4 Walks | 0.000 | 0.000 | 0.000 | 0.000 | 0.000 |
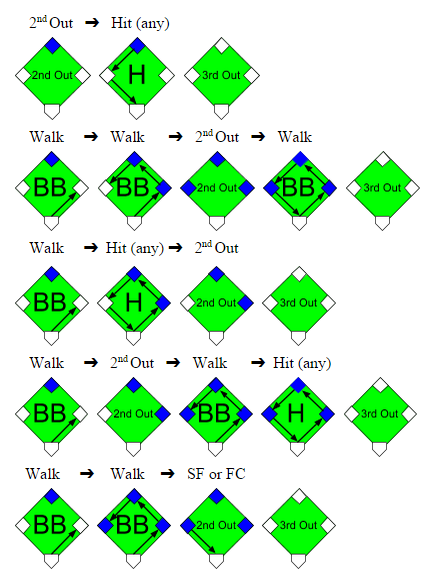
To get out of the inning unscathed, Bumgarner would need to prevent any further hits or allow fewer than 3 walks given a runner on 2nd with 1 out; it would be possible to advance the runner to on 3rd with 2 walks and then sacrifice him home in this situation (with no hits), but this probability is insignificantly tiny especially for a dominant pitcher like Bumgarner. Once again we depict these sequences that could get the tying run home from 2nd with 1 out, with the second out inserted randomly.
A runner on 2nd base with one out is a scenario commonly manufactured in an attempt to tie the game from a runner on 1st with no outs situation. The logic is that if the hitting team is down by one run and the first batter leads off the inning with a single or walk, the next batter can control getting him into scoring position and hope that either of the next two batters knocks the run in with a hit. However, this method of control, a bunt, sacrifices an out to move the runner from 1st to 2nd. The defense will usually allow the hitting team to move the runner into scoring position for an out, but the out wasn’t the only sacrifice made. The inning is truncated for the hitting team with one less batter and the potential to have more hitters bat and drive in runs is reduced. Indeed, against a pitcher like Bumgarner, the out is likely not worth the meager 0.238 probability of getting that runner home. We’ll see in the next section what exactly gets sacrificed for this chance at tying the game.
We should note that in this “runner on 2nd with 1 out” model we added few more assumptions to those we made in the prior “runner on 3rd with 2 outs” model, neither of which should be farfetched. The first assumption is that with the game close and the manager intent on tying the game rather than piling on runs, he should have a runner on 2nd base fast enough to score on a single. Another assumption is that the base runners will be precautious enough not to cause an out on the base paths, yet aggressive enough not to get doubled up or have the lead runner sacrificed in a fielder’s choice play. Lastly, we assume that the combinations of hits, walks, and outs are random, even though we know the current state of base runners and outs can have a predictive effect on the next outcome and the defensive strategy used. By using these assumptions we simplify the factors and outcomes accounted for in these models and reduce the variability between each model.
The final probability formula considers the sequences of walks, hits, and outs that can occur when we start with no outs accumulated; this allows to forge situation will allow us to forge the outcomes from a runner on 1st with no outs scenario and compare them to a runner on 2nd with 1 out scenario.
Table 5.3 below uses Bumgarner’s 2014 World Series statistics, the same as before, although in this model we deal with more uncertainty because the sequences captured in each box are not as clear cut between run scoring or not given a runner on 1st with no outs. The yellow and non-highlighted cells are still the respective probabilities of not allowing and allowing the tying run to score, however, we now introduce the green probabilities to represent the hit and walk combinations that could potentially score a run but are dependent on the hit types, sequences of events, and the use of productive outs. These factors were unnecessary in the prior two models because in those models any hit would have scored the run, the sequence of events was inconsequential, and the use of productive outs was unnecessary with the runner is already on 2nd or 3rd base (except when there is a runner on 3rd and a sacrifice fly or fielder’s choice could bring him home).
Table 5.3: Probability of Hit and Walk Combinations after 0 Outs
| 0 Hits | 1 Hit | 2 Hits | 3 Hits | 4 Hits | |
| 0 Walks | 0.613 | 0.227 | 0.056 | 0.011 | 0.002 |
| 1 Walk | 0.050 | 0.025 | 0.008 | 0.002 | 0.000 |
| 2 Walks | 0.003 | 0.002 | 0.001 | 0.000 | 0.000 |
| 3 Walks | 0.000 | 0.000 | 0.000 | 0.000 | 0.000 |
| 4 Walks | 0.000 | 0.000 | 0.000 | 0.000 | 0.000 |
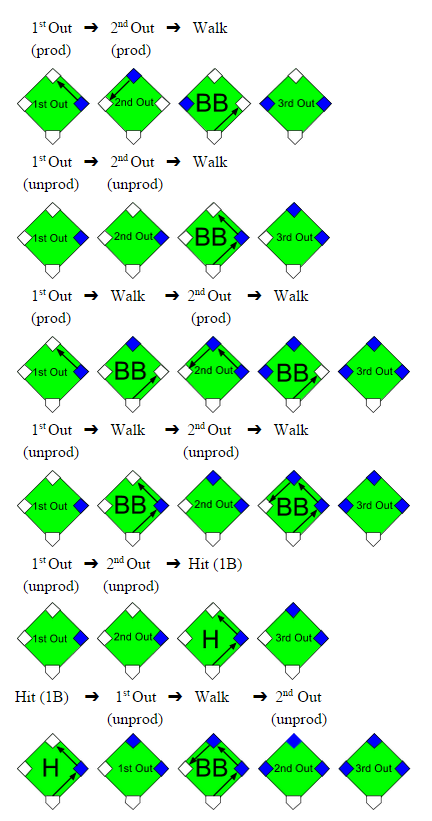
We must break down each green probability into subsets of yellow probabilities representing the specific sequences that would not score the tying run from 1st base with no outs; we depict these sequences below, but for simplicity, not all are depicted.
Now that we know the conditions when a run would not score, we take the probabilities from the green cells in Table 5.3, narrow them down according to the proportion of sequences and the proportion of hit types that would not score the run, and separate them based on the usage of productive and unproductive outs; the results are displayed in Table 5.4. For example, there are 6 possible combinations for 1 hit, 1 walk, and 3 outs and 3 of these 6 combinations would not score the tying run on a single, where P(1B | H) = 0.755, with unproductive outs; yet, the run would score with productive outs, with unproductive outs on a double or better, or with unproductive outs and the other 3 combinations. When we finally sum these yellow cells, they tell us that an aggressive manager would score the tying run against Bumgarner with a 0.370 probability and Bumgarner would escape the inning with a 0.630 probability. Otherwise, a less aggressive manager would score the tying run with a mere 0.154 probability and Bumgarner would leave unscathed with a significant 0.846 probability.
Table 5.4: Probability of No Runs Scoring after 0 Outs
| Productive Outs | Unproductive Outs | |||
| 0 Hits | 1 Hit | 0 Hits | 1 Hit | |
| 0 Walks | 0.613 x (1/1) | 0.227 x (0/3) | 0.613 x (1/1) | 0.227 x (3/3) x 0.755 |
| 1 Walk | 0.050 x (1/3) | 0.025 x (0/6) | 0.050 x (3/3) | 0.025 x (3/6) x 0.755 |
| 2 Walks | 0.003 x (2/6) | N/A | 0.003 x (6/6) | N/A |
We summarize the results from Tables 5.1-5.4 into Table 5.5 from the perspective of the hitting team. We compare their chances of success not only against Madison Bumgarner from the 2014 World Series but also against Tim Lincecum, Matt Cain, and Jonathan Sanchez from the 2010 World Series.
Table 5.5: Probability of Allowing at least One Run to Score
| 2010 Tim Lincecum | 2010 Matt Cain | 2010 Jonathan Sanchez | 2014 Madison Bumgarner | |
| Runner on 1st & 0 Outs w/Unproductive Outs | 0.305 | 0.224 | 0.531 | 0.154 |
| Runner on 1st & 0 Outs w/Productive Outs | 0.576 | 0.475 | 0.758 | 0.370 |
| Runner on 2nd & 1 Out | 0.382 | 0.288 | 0.543 | 0.238 |
| Runner on 3rd & 2 Outs | 0.212 | 0.154 | 0.318 | 0.127 |
Let’s return to the scenario that is the launching point for this study… The hitting team is down by one run and there is a runner on 1st base with no outs. If the game is in its early innings, where it is not mandatory that this runner at 1st gets home, the manager will likely decide against being aggressive and avoid sacrificing outs in order to increase his chances of extending the inning to score more runs; there are several studies supporting this logic. Yet, if the game is in the latter innings and base runners are hard to come by, the manager should lean towards utilizing productive outs and intentionally sacrifice the runner from 1st to 2nd base. His shortsighted goal should only be to tie the game. By forcing productive outs rather than being conservative on the base paths, his chances of tying the game increase significantly (between 0.216 and 0.271) against our four pitchers given a runner on 1st and no outs scenario.
However, the if the manager does successfully orchestrate the runner from 1st to 2nd base with a productive out, he does still lose a little bit of probability of tying the game; between 0.132 and 0.215 of probability is lost against our pitchers. And if he decides to sacrifice the runner further from 2nd to 3rd base with another out, his team’s chances would decrease again by a comparable amount; this decision is ill-advised because a hit is likely going to be needed to tie the game and the hitting team would be sacrificing one of two guaranteed chances to hit in this situation. In general, the probability of scoring at least one run decreases as more outs are accumulated, regardless of the base runners advancing with each out. The manager could contrarily decide against sacrificing his batter if he has confidence that his batter can hit the pitcher or draw a walk, yet the imperative goal is still to tie the game. The odds of tying the game actually favor an aggressive hitting team that is able to get the runner to 2nd base with one out, by an improvement ranging from 0.012 to 0.084, over a less aggressive team with a runner at 1st with no outs. Thus, even though sacrificing the runner from 1st to 2nd base does decrease the chances of tying the game, it would be worse to approach the game lifelessly when the situation demands otherwise.


