Archive for Research

Effect of Stats So Far on Depth Charts RoS Projections

Major League Baseball teams have played more than one-fourth of their schedule so for and there is new data to incorporate into projections. Some players are off to amazing starts (Bryce Harper and Nelson Cruz), while others have really struggled (Troy Tulowitzki and Steve Pearce). With that in mind, I thought I’d look at which players have seen their rest-of-season projections change the most from their preseason projections. I used the preseason Depth Charts projections and compared each player’s preseason projection for AVG/OBP/SLG and wOBA to their rest-of-season Depth Charts projection. All statistics are from May 25th.

The Biggest Losers


SS Troy Tulowitzki (-.019)


.272/.288/.415, .301 wOBA—current

.307/.386/.539, .400 wOBA—preseason

.300/.370/.515, .381 wOBA—rest-of-season


The statistic that stands out most when looking at Tulowitzki is an extremely low walk rate of just 2.6%. Tulo’s career walk rate is 9.8% and the lowest single-season walk rate he’s had was an 8.4% mark in 2007, his second year in the major leagues. He also has a strikeout rate (21.7%) that is 5.7% higher than his career mark. According to Pitch f/x Plate Discipline, Tulowitzki is swinging at more pitches outside the strike zone (on pace for a career high of 32.9% O-Swing%) and more pitches inside the strike zone (65.6%, career mark is 57.8%) and making less contact than he ever has in a season (78.2% Contact%). When it comes to balls in play, Tulowitzki has seen just 4.3% of his fly balls leave the yard, far below his career rate of 15.1% HR/FB. Despite his struggles, his rest-of-season projection of a .381 wOBA is still elite for a shortstop even if it’s dropped .019 from his pre-season projection of .400.

2B/OF/1B Steve Pearce (-.018)


.188/.262/.323, .259 wOBA—current

.266/.346/.471, .358 wOBA—preseason

.254/.333/.446, .340 wOBA—rest-of-season


Pearce is striking out slightly more than he did last year (20.6% to 19.8%) and walking a bit less (7.5% to 10.4%), but nothing as glaringly different from the norm as Troy Tulowitzki has shown so far (see above). One of the biggest problems for Pearce has been a .197 BABIP, down from .322 last year and well below his .287 career mark. His BABIP is down despite a career-best 25.3% line drive rate. His HR/FB is also close enough to last year’s rate to not be anything to worry about (14.3% this year, 17.5% last year). According to Pitch f/x Pitch Types, Pearce has seen a much lower percentage of two-seam fastballs (4.5%) than he did last year (14.1%) even though his overall percentage of fastballs is up (45.1% to 43.7%), so pitchers are attacking him a bit differently. The heat maps below show the swing percentage for Steve Pearce in 2014 on the left and his swing percentage for 2015 on the right. It looks like pitchers are getting Pearce to swing at more pitches in the upper half and inside part of the strike zone with four seam fastballs. Can he adjust?

OF Carlos Gonzalez (-.017)


.206/.285/.326, .275 wOBA—current

.281/.346/.509, .370 wOBA—preseason

.270/.338/.481, .353 wOBA—rest-of-season


Unlike his equally disappointing teammate, Troy Tulowitzki, Carlos Gonzalez is walking more and striking out less than he has in the last couple seasons. His walk rate of 10.1% is higher than his career mark of 8.0% and his strikeout rate of 20.8% is below his career mark of 22.3%. Like Steve Pearce, CarGo has a BABIP problem. From 2008 to 2013, Gonzalez never had a BABIP below .318 and his career mark over 2826 plate appearances was .350. Last year, he had a .283 BABIP. This year, it’s down to .238. His batted ball profile shows a 22.9% line drive rate, which is higher than his career rate of 20.2%. He’s hitting more ground balls and fewer fly balls than he has historically, which should help his BABIP. When looking at Gonzalez’ hard hit percentage, we find his 27.3% mark this year is his lowest since his rookie year. In his two best season’s (2010 and 2013), CarGo had his two best Hard Hit percentages, at 43.8% and 38.8%. With Gonzalez and his history of injuries, you never know if he’s truly healthy. His plate discipline numbers suggest he’s fine in that regard but that low hard hit percentage is troublesome.

OF Melky Cabrera (-.014)


.241/.287/.271, .253 wOBA—current

.292/.342/.436, .342 wOBA—preseason

.286/.335/.414, .328 wOBA—rest-of-season


Melky is suffering from a low BABIP of .252 (career mark is .308) but his batted ball profile isn’t much different from last year as far as line drives, ground balls, and fly balls are concerned. His HR/FB is way down at 2.4% (last year it was 10.7%) and his Hard% of 19.6% is well below his 2014 rate of 30.5%. He’s walking about as much as he usually walks and is striking out less often than he ever has so he’s making contact, it just hasn’t been good contact.

2B Robinson Cano (-.013)


.253/.295/.337, .279 wOBA—current

.296/.361/.455, .353 wOBA—preseason

.289/.351/.438, .340 wOBA—rest-of-season


Through more than one-fourth of the season, Robinson Cano has just one home run. Other than a terrible 2.9% HR/FB, his batted ball profile looks much like last year and his Hard% of 32.6% is better than last season’s 28.5% mark. As for plate discipline, his walk rate is down to 5.4% after averaging over 9% in the three previous seasons. He also currently has the highest strikeout rate of any season of his career, at 16.7%, with a contact percentage down by approximately 5% on pitches both inside and outside of the strike zone.


The Biggest Winners


OF Bryce Harper (+.019)


.333/.471/.727, .494 wOBA—current

.279/.363/.491, .372 wOBA—preseason

.287/.383/.528 .391 wOBA—rest-of-season


Bryce Harper’s monster start to the season has raised his wOBA projection by .019, the largest increase for any player. This looks like the year Harper has made the jump to elite level. His walk rate of 20.9% is well above his career rate of 11.6%. He’s been hitting so well, and with such power, that pitchers just don’t want to throw him anything to hit. His percentage of strikes out of all pitches thrown was 61.7% in his first three years in the major leagues. This year, pitchers are throwing strikes to Harper just 55.8% of the time. He’s also swinging less often on pitches both inside and outside the strike zone and has a career-best 40.0 Hard% when he does make contact. His HR/FB of 35.6% is almost double his career rate and he’s increased the percentage of fly balls he’s hit and the percentage of balls he’s pulled. It looks like he’s matured into the player everyone thought he’d be.

C Stephen Vogt (+.019)


.307/.410/.598, .424 wOBA—current

.255/.303/.398, .308 wOBA—preseason

.263/.322/.429, .327 wOBA—rest-of-season


Stephen Vogt has some of the same indicators as Bryce Harper. Vogt is also seeing fewer strikes (58.2% after seeing 64.1% strikes in his first three seasons) and has a career-best walk rate of 15.1% (career rate is 8.1%). His HR/FB rate of 22.2% is more than double his career rate (10.6%) and he’s pulling more balls than he ever has.

OF Nelson Cruz (+.016)


.341/.398/.688, .458 wOBA—current

.250/.309/.457, .334 wOBA—preseason

.262/.322/.492, .350 wOBA—rest-of-season


Unlike Harper and Vogt, Cruz has a walk rate that is very close to his career mark. He’s also striking out just a little more than he has during his career, so he’s not walking or striking out at a much different rate than he normally does. He does have a very high .374 BABIP (career BABIP is .302) and the best HR/FB rate of his career, at 31.5% (career mark is 17.9%). With Cruz being on the positive side of the biggest changes in projected wOBA from the preseason to now and his teammate Robinson Cano being on the negative side, the only explanation is that Cruz stole Cano’s mojo.

The interesting thing is that the Cruz and Cano combined are not far off from preseason projections when pro-rated to their current 376 combined plate appearances:

376 PA, 44 R, 14 HR, 49 RBI, .274/.336/.456—Combined preseason projection for Cano & Cruz pro-rated to their current 376 plate appearances.

376 PA, 48 R, 18 HR, 48 RBI, .296/.346/.508—Current combined hitting statistics for Cano & Cruz.

DH Alex Rodriguez (+.015)


.262/.363/.545, .388 wOBA—current

.231/.311/.386, .310 wOBA—preseason

.236/.323/.417, .325 wOBA—rest-of-season


Heading into his age 39 season and having missed all of 2014, expectations were low for Alex Rodriguez this year. And yet, here he is with a very good .263/.363/.545 batting line and 10 home runs in 41 games. His current .388 wOBA would be his highest since 2009. Of course, the projections don’t see that happening but they have bumped up his wOBA from .310 before the season started to .325 for the rest of the season. A-Rod is walking and striking out at similar rates to his 2013 season and has a similar BABIP to that year as well, but he’s increased his HR/FB percentage from 15.6% in 2013 to 23.3% so far this year. That rate would be his best since 2007.

1B Mark Teixeira (+.015)


.236/.362/.563, .387 wOBA—current

.229/.319/.422, .327 wOBA—preseason

.234/.332/.454, .342 wOBA—rest-of-season


Mark Teixeira has seen a projected increase of .015 in his wOBA from the preseason to the rest-of-season thanks to a .387 wOBA through his first 43 games. Teixeira is doing this despite a .191 BABIP, which is well below his career mark of .285. Of course, Teixeira routinely had BABIPs above .300 in the first seven years of his career but has been below .250 in each of the last five years. He is walking more than he ever has (15.6% BB%) and striking out at a career-low rate (12.1%). He also has a 25.5% HR/FB, which would be a career high.
Being Drafted and Making the Show the Same Year

At this point we’re less than a month away from the June 8th, 2015 Major League Draft. Which essentially means we’re in draft season. A lot of mock drafts are coming out, and most fans are excited to see which young talent their team will add to their minor-league system. While the draft can be an exciting event to some, it’s very different than the NBA or NFL draft. Unlike in the NBA and NFL draft where a player will have an immediate impact on the team upon being drafted, the players drafted in the Major League draft will have to spend some time in the minors before making an impact. Most fans therefore won’t be able to see the fruition of the draft for several years. This can be frustrating.

But every now and then a rare event in baseball occurs. A player sometimes reaches the Majors the same year he’s drafted. This event actually happened last year. Brandon Finnegan, you see, was drafted 17th overall, in the first round of last year’s draft by the Kansas City Royals. He eventually went on to make his Major League debut that same season on September 6th and helped the Royals reach the playoffs for the first time since 1985. Finnegan, however, is not the first player to accomplish this feat. Since the draft was first implemented in 1965, a total of 55 players who have been drafted made the majors the same season. This of course does not include international free agents.

But is this feat becoming more or less prevalent? Are certain organizations more likely to promote a player quickly? Is there a certain position that get’s promoted more frequently? And is this even a smart strategy? Will this affect a player’s long-term success? Are the players capable of actually helping the Major League squad? These are all questions I will attempt to answer.

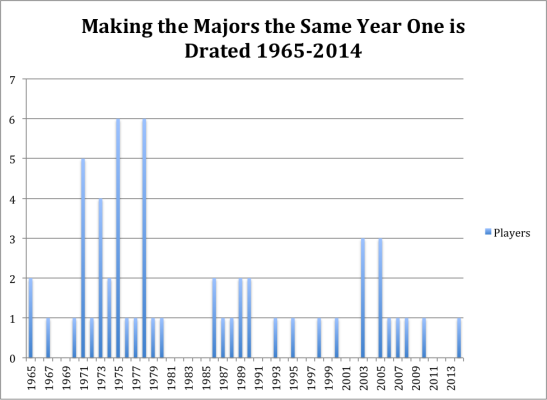
First will look at the prevalence of this feat.

Maikng majors trend

As you can see this was actually not an uncommon occurrence in the 70s. It was actually pretty popular, in 1975 and 1978 as a total of 6 players made the majors upon being drafted. In fact this event actually happened at least once a year for ten straight seasons (1970-1980). Now, however, the trend is far less frequent. Brandon Finnegan was the first player to accomplish the feat since 2010, when Chris Sale was promoted by the White Sox to the Major Leagues.

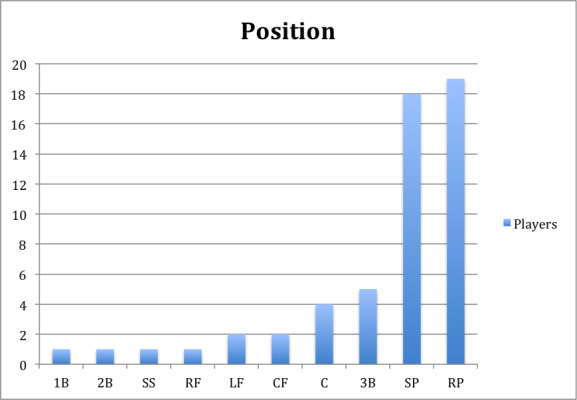
What you may have noticed at this point, is that both players are pitchers. In fact both players were promoted to the majors as relief pitchers. I think at this point most of us would assume that the vast majority of players promoted to the majors upon being drafted would be pitchers. It simply makes sense. Some pitchers coming out of college who have devastating stuff can theoretically come up and get batters out. A position player, however, probably needs more time in the minors to develop an acceptable hitting approach before he can help a team. Developing a hitting approach takes time. So below is the list of all 55 players separated by their different positions.

making majors by position


If you happened to read my latest Tommy John article you probably noticed that a relief pitcher was defined as GS/G < 0.5. I again used this barometer to define a relief pitcher. The position of the player was also defined as, the position that was most often played, the year of the promotion. So for example normally Chris Sale would be defined as a starter, but since he was primarily used as a reliever when promoted, I put him in the reliever group.

At this point you’ve probably noticed that the majority of players promoted are in fact pitchers. As for the reasons stated above this shouldn’t be very surprising.

So now let’s look at whether this is an effective strategy. Most teams are probably hoping that these players make an impact, or else why would they be promoting them, which would speed up their free agent clock, and theoretically affect their development.

Basically what I did was rather simple. I looked at the average stats of all the players when they were promoted. I also, obviously, split the pitchers and position players into two different groups. There were a total of 38 different pitchers and 17 position players.

Pitchers
Age Innings ERA+ PWARP
20.8 27.52 107.5 0.05


Position Players
Age PA wRC+ WAR
20.76 77 101.11 0.14

The results seem to look good, while ERA+ isn’t a perfect statistic by any measure it gives us a sense of the situation and here it looks like the pitchers who are promoted to the majors upon being drafted give above-average production. The hitters fare less well but again give an above-average production. For rookies who have just been called up, I’d say that’s pretty good. This is of course an average look at the players and one needs to consider that not all of them were productive. Also, this strategy for teams is only productive if they’re filling in a need. If a player for example, is performing below league average then this would be an effective strategy, if he were performing above league average then you’re probably better off keeping your everyday player in the lineup.

If we also take a look at the PA and innings, it seems that these players are being used as role players. So basically part-time fielders, or mostly relief pitchers. The position chart above, however, doesn’t support this claim, as the second-most frequent position was starting pitcher.

Another explanation therefore could be that these players are called up later in the season; for example, I would guess that most of them are called up in September. Fortunately though I don’t have to guess I have the results, so here they are.

Months Players
April 1
May 0
June 11
July 7
August 10
September 24

As one might have expected most players are called up by September. This is not surprising. What might be surprising was that a player was called up in April. This might be surprising to some especially considering that the draft begins in June. Some of you might think this is an error. It, however, is not. You see, initially baseball’s draft was divided into three separate drafts. The first and largest was in June. The second was in January, to adhere to the players who graduated in the winter semesters. The third and final round then took place in August. The August draft only lasted two years, while the January draft lasted until 1986. For those interested the one player who was called up in April was drafted in the January draft, his name was Dick Ruthven, and the Philadelphia Phillies called him up April 17th 1973.

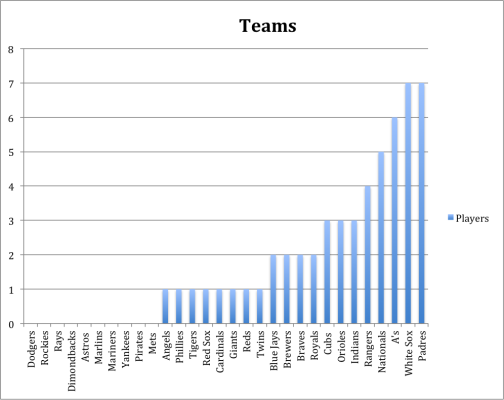
What might be even more interesting is that not only was Dick Ruthven the only player who was called up in April; he was the only players who was ever called up by the Phillies (The same year he was drafted). The Phillies though are not the only team who are squeamish about this strategy. In fact, there are 10 teams who have never called up a player the same year he was drafted. Below are the results.


making majors teams


As you can see the Padres and White Sox seem to be the ones who feel most comfortable promoting a player so early in his development process. That being said, while I have described this as a “strategy” earlier on, this is probably just statistical noise. It’s not like there’s a team or a few teams that are doing this a lot more than other teams. If I had to venture a hypothesis, I would guess that teams probably make the decision to promote someone so quickly, based on need and how advanced the player already is in his development. Personally, however, I would be hesitant to do so in fear that it might affect the player in the long run. For example, he might come up to the majors earlier than he should and therefore will not be able to develop into the player he could have been in the minors.

So now I’ll look to answer my final question and that’s how being promoted the first year a player is drafted affect his career production?

For this I looked at the average of all the player’s career stats. Again splitting the position players and pitchers. I wanted to see if these players ended up having successful careers.

Pitchers (Career)
MLB Games Innings ERA+ WARP
223.52 872.53 94.73 5.93


Position Players (Career)
MLB Games PA wRC+ WAR
961.58 3575.17 89.58 15.43


This time it looks like the position players were more successful than the starters, which was surprising to me. Maybe, it has something do to with the sample size, but I would have either way expected the pitchers to be better.

These career statistics also don’t leap off the screen. These are not superstars, for the most part, but seem to be serviceable Major League players. To me that’s a definite success. It’s a successful draft pick and it shows that the promotion doesn’t overly affect the players. (Of course I’m speaking generally here, I have no way of knowing if it affected a particular player.) This might be a controversial or surprising statement to some but the fact remains that most players who get drafted simply don’t make it to the Major Leagues, let alone have any semblance of a career. The fact that the position players, on average participate in 961.58 games shows that on average they’ve had a respectable career. The same thing goes for the pitchers. While being in 223.52 games might not seem like a lot, that’s more than an entire season’s worth of baseball, which most minor leaguers would kill to have.


Statistics were found at Baseball Prospectus, FanGraphs, and Baseball Reference.


The database for players making it to the majors the same year they were drafted was found at The Baseball Cube, which is a great website where a lot of good research can be done.


Using Markov Chains to Predict K% and BB%

There are 12 “states” of the count in baseball: 0-0, 0-1, 0-2, 1-0, 1-1, 1-2, 2-0, 2-1, 2-2, 3-0, 3-1, 3-2. In addition there are 3 “states” in which a plate appearance can end: strikeout, walk, and ball in play. This means that MLB plate appearances lend themselves wonderfully to analysis with Markov chains.

Every pitch thrown in MLB can be classified as a swinging strike, called strike, ball, foul, or ball in play. Each of these classifications has a defined effect in each count. For example, a swinging strike in an 0-1 count leads to an 0-2 count, and a foul in a 2-2 count leads to another 2-2 count.

Using PITCHf/x plate discipline statistics and a little algebra, it is possible to calculate the chance of each of these occurrences on any given pitch. Called strikes, swinging strikes, and balls are easy enough to calculate, but it gets tricky with fouls and balls in play. They both have the same requirements, in that the batter must swing and must make contact. To separate fouls from balls in play, then, we need to find how many pitches a pitcher allowed to be contacted, and then subtract the number of pitches that were put into play. This is easily found, since every batter faced by a pitcher either strikes out, walks, or puts the ball in play.

Unfortunately for the Markov process, major league players do not act randomly. In different counts, pitchers are more or less likely to throw the ball in the zone, and hitters are more or less likely to swing. This must be accounted for or the simulation will bear only a passing resemblance to the game actually played on the field. Using BaseballSavant, I found the rate at which pitchers throw in and out of the zone on every count, and then created an index stat like wRC+, where 100 is average and 110 is 10% more than average. For example, 3-0 counts have a Zone index of 129, and 0-2 counts have a Zone index of just 62. I did the same thing for Z-swing% and O-swing%. One caveat is that the Zone% numbers I got on BaseballSavant do not match those found in the PITCHf/x plate discipline stats. However, since these index stats are all RELATIVE to league average, it should not make a difference.

  ZONE+ ZSWING+ OSWING+
0-0 110 61 53
0-1 88 112 98
0-2 62 131 117
1-0 113 91 82
1-1 99 119 115
1-2 75 134 135
2-0 121 91 80
2-1 115 123 120
2-2 95 137 152
3-0 129 18 19
3-1 128 114 106
3-2 122 139 169

Once we have all this data for a pitcher, we can use a Markov chain to essentially simulate an infinite number of plate appearances for him. Every plate appearance starts at 0-0. By knowing the chances of all the per-pitch results, we can estimate how many 1-0 and 0-1 counts the pitcher would get into, and how many times the pitch would be put into play. From 1-0, we can estimate how many counts become 2-0 or 1-1 or balls in play, and from 0-1, we can estimate how many become 0-2 or 1-1 or balls in play. Simulating in this way, every plate appearance will eventually lead to a strikeout, walk, or ball in play.

For every pitcher who qualified for the ERA title in 2014, I imported his Zone%, Z-swing%, O-swing%, Z-contact%, O-contact%, TBF, K, BB, and HBP (the last 4 only to calculate fair/foul%). Using these, I created a transition matrix for each pitcher that shows the probabilities of moving to any state of the count from any other given count. For example, here is Clayton Kershaw’s 2014 transition matrix.

  0-0 0-1 0-2 1-0 1-1 1-2 2-0 2-1 2-2 3-0 3-1 3-2 K BB IP
0-0 0 0.546 0 0.344 0 0 0 0 0 0 0 0 0 0 0.110
0-1 0 0 0.471 0 0.350 0 0 0 0 0 0 0 0 0 0.180
0-2 0 0 0.207 0 0 0.395 0 0 0 0 0 0 0.221 0 0.177
1-0 0 0 0 0 0.542 0 0.290 0 0 0 0 0 0 0 0.168
1-1 0 0 0 0 0 0.509 0 0.283 0 0 0 0 0 0 0.208
1-2 0 0 0 0 0 0.240 0 0 0.317 0 0 0 0.238 0 0.204
2-0 0 0 0 0 0 0 0 0.564 0 0.260 0 0 0 0 0.175
2-1 0 0 0 0 0 0 0 0 0.541 0 0.225 0 0 0 0.234
2-2 0 0 0 0 0 0 0 0 0.283 0 0 0.231 0.246 0 0.241
3-0 0 0 0 0 0 0 0 0 0 0 0.664 0 0 0.298 0.038
3-1 0 0 0 0 0 0 0 0 0 0 0 0.567 0 0.203 0.229
3-2 0 0 0 0 0 0 0 0 0 0 0 0.332 0.242 0.144 0.282
K 0 0 0 0 0 0 0 0 0 0 0 0 1 0 0
BB 0 0 0 0 0 0 0 0 0 0 0 0 0 1 0
IP 0 0 0 0 0 0 0 0 0 0 0 0 0 0 1

The left column represents the count before a given pitch is thrown. The top row represents the count after that pitch has been thrown. The intersection of any column and row is the chance of that particular transition occurring. So, for 2014 Kershaw, there was a 54.6% chance that he would get ahead of a batter 0-1, a 34.4% chance he would fall behind 1-0, and an 11% chance the batter would put the first pitch into play. Since the transition matrix shows the probabilities associated with throwing one pitch, raising the matrix to the second power simulates throwing 2 pitches. Similarly, finding the limit of the matrix simulates throwing an infinite number of pitches, after which a plate appearance is certain to be over. This is why the limit of Kershaw’s matrix (shown below) only has non-zero probabilities in the last 3 columns; after an infinite number of pitches, a plate appearance will have finally reached a conclusion of a strikeout, walk, or ball in play.

  0-0 0-1 0-2 1-0 1-1 1-2 2-0 2-1 2-2 3-0 3-1 3-2 K BB IP
0-0 0 0 0 0 0 0 0 0 0 0 0 0 0.285 0.041 0.674
0-1 0 0 0 0 0 0 0 0 0 0 0 0 0.369 0.023 0.608
0-2 0 0 0 0 0 0 0 0 0 0 0 0 0.530 0.014 0.455
1-0 0 0 0 0 0 0 0 0 0 0 0 0 0.243 0.082 0.675
1-1 0 0 0 0 0 0 0 0 0 0 0 0 0.341 0.046 0.613
1-2 0 0 0 0 0 0 0 0 0 0 0 0 0.505 0.029 0.466
2-0 0 0 0 0 0 0 0 0 0 0 0 0 0.202 0.197 0.602
2-1 0 0 0 0 0 0 0 0 0 0 0 0 0.295 0.111 0.594
2-2 0 0 0 0 0 0 0 0 0 0 0 0 0.459 0.069 0.471
3-0 0 0 0 0 0 0 0 0 0 0 0 0 0.136 0.515 0.349
3-1 0 0 0 0 0 0 0 0 0 0 0 0 0.205 0.326 0.469
3-2 0 0 0 0 0 0 0 0 0 0 0 0 0.362 0.216 0.422
K 0 0 0 0 0 0 0 0 0 0 0 0 1 0 0
BB 0 0 0 0 0 0 0 0 0 0 0 0 0 1 0
IP 0 0 0 0 0 0 0 0 0 0 0 0 0 0 1

Now, to predict Kershaw’s K% and BB%, we need only look at the top row, since all plate appearances begin with an 0-0 count. After a 0-0 count, we estimate Kershaw has a 28.5% chance to strike out any given batter and a 4.1% chance to walk him. Kershaw in 2014 actually had a 31.9% strikeout rate and a 4.1% walk rate.

This method produces a very robust r-squared of .86 when plotting xK% vs. actual K%. Unfortunately, r-squared drops to .54 when plotting xBB% vs. actual BB%.

I then imported the same statistics for batters, because there really is no reason why this method should not work equally well for both pitchers and hitters. It actually seems to work better as a whole on batters, with an r-squared of .81 for batters’ strikeouts and .77 for batters’ walks.

If there are any players in particular you’re interested in, I have included the full list of all qualified pitchers and position players, with both their expected and actual strikeout and walk rates.

Player              xK%       2014 K%            xBB%    2014 BB%
Hughes 19.1 21.8 1.8 1.9
Kershaw 28.5 31.9 4.1 4.1
Price 25.6 26.9 3.7 3.8
Sale 31.3 30.4 6.1 5.7
Zimmermann 23.2 22.8 3.3 3.6
Scherzer 28.5 27.9 6.4 7
Bumgarner 24.9 25.1 5.1 4.9
Lackey 22 19.7 3.7 5.6
Kluber 28.1 28.3 4.9 5.4
Strasburg 26.8 27.9 5.6 5
Samardzija 24.4 23 4.8 4.9
Hamels 24.8 23.9 5.6 7.1
McCarthy 20.1 20.9 4.4 3.9
Cueto 23.6 25.2 6.8 6.8
Wood 24.9 24.5 6.3 6.5
Kennedy 24.8 24.5 7.5 8.3
Greinke 25.4 25.2 6.4 5.2
Odorizzi 24.1 24.2 9 8.2
Hutchison 23.1 23.4 7.2 7.6
Teheran 21.4 21 5.2 5.8
Harang 20.8 18.4 6 8.1
Eovaldi 17.9 16.6 4.9 5
Felix 26 27.2 6.8 5
Dickey 21.9 18.9 6.3 8.1
Fat Bartolo 17.4 17.8 4 3.5
Kazmir 20.9 21.1 6.5 6.4
Wainwright 21.4 19.9 5.1 5.6
Wheeler 25.2 23.6 9.8 9.9
Ventura 21.2 20.3 6.9 8.8
Fister 17.8 14.8 4.4 3.6
Chen 17.8 17.6 5.9 4.5
Norris 20 20.2 8.4 7.6
Lester 22.6 24.9 8.1 5.4
Richards 24.9 24.2 8 7.5
Porcello 18.3 15.4 4.6 4.9
Shields 20.8 19.2 6.5 4.7
Lewis 18.8 17.5 5.7 6.3
Simon 18.3 15.5 5.5 6.8
Iwakuma 18.6 21.7 5.5 3
Lynn 20.3 20.9 8.6 8.3
Wood 18.3 18.7 8.4 9.7
Hammel 22.5 22.1 7.7 6.2
Noesi 18.9 16.8 6.3 7.6
Verlander 18.5 17.8 6.8 7.3
Miller 17.9 16.6 6.9 9.6
Young 18.2 15.7 7.5 8.7
Koehler 20.3 19.1 6.6 8.8
Archer 22.9 21 8.1 8.8
Roark 19 17.3 5.9 4.9
Haren 19.1 18.7 7.6 4.6
Peavy 18.4 18.5 7.4 7.4
Ross 25.2 24 9 8.9
Niese 17.9 17.6 5.3 5.7
Tillman 17.5 17.2 7.9 7.6
Cobb 22.6 21.9 8.4 6.9
Danks 19.4 15.1 7.1 8.7
Garza 18.3 18.5 7.4 7.4
Santana 22.1 21.9 7.3 7.7
Quintana 20.4 21.4 9.1 6.3
Alvarez 15.7 14.4 3.9 4.3
Liriano 27.3 25.3 10.8 11.7
Volquez 20.5 17.3 7.1 8.8
Guthrie 16.1 14.4 6.3 5.7
Buchholz 18.7 17.9 7.3 7.3
Gray 20.5 20.4 7.7 8.2
Burnett 21.5 20.3 8.8 10.3
Collmenter 16.4 16 6.9 5.4
Vargas 19.2 16.2 6.9 5.2
Lohse 17.4 17.3 6.9 5.5
de la Rosa 19.2 18.1 10 8.7
Leake 16.7 18.2 6.9 5.5
Vogelsong 17.9 19.4 9.6 7.4
Cosart 18 15 8.4 9.5
Weaver 19.2 19 8.2 7.3
Hudson 16.1 15.2 5.8 4.3
Feldman 15.6 14 8.3 6.5
Kuroda 17.3 17.8 8 4.3
Hernandez 17.4 14.5 9 10.1
Buehrle 14.7 13.9 6.2 5.4
Keuchel 18.5 18.1 8.3 5.9
Peralta 16.5 18.4 9.5 7.3
Elias 19.5 20.6 11.1 9.2
Miley 18.3 21.1 10.3 8.7
Kendrick 15.1 14 7.3 6.6
Wilson 21 19.8 13.1 11.2
Gibson 15.8 14.1 8.5 7.5
Stults 14.5 14.5 8.7 5.9
Gallardo 16.3 17.9 11.1 6.6
McCutchen 19.8 17.7 11.7 13
V-Mart 13.9 6.6 8.3 10.9
Abreu 23.7 21.1 6.5 8.2
Stanton 27.6 26.6 12.9 14.7
Trout 27.9 26.1 12.4 11.8
Bautista 19.8 14.3 12 15.5
Rizzo 23.2 18.8 9.5 11.9
E5 20.3 15.1 9.5 11.4
Brantley 10.9 8.3 8 7.7
Cabrera 17.6 17.1 7.1 8.8
Beltre 16.6 12.1 6.7 9.3
Puig 17.5 19.4 10.4 10.5
Werth 24 18 11.4 13.2
Freeman 18.7 20.5 12.3 12.7
Morneau 11.8 10.9 5.7 6.2
Posey 15.5 11.4 7.5 7.8
Cruz 22 20.6 7 8.1
Kemp 24.8 24.2 7.9 8.7
Ortiz 16.7 15.8 11.1 12.5
Lucroy 18.3 10.8 6.4 10.1
Gomez 19.4 21.9 7.1 7.3
Harrison 17.9 14.7 3.8 4
Upton 27 26.7 8.2 9.4
Altuve 9 7.5 3.3 5.1
Han-Ram 16.2 16.4 9.9 10.9
Duda 25.3 22.7 11.5 11.6
Rendon 17.9 15.2 8.7 8.5
Cano 12.2 10.2 6.6 9.2
Holliday 14.3 15 9.5 11.1
Marte 25.2 24 6.3 6.1
Smith 20 16.7 11.6 13.2
LaRoche 19.8 18.4 12.5 14
Walker 15.2 15.4 9 7.9
Cabrera 13.5 10.8 7.1 6.9
Santana 22.6 18.8 14.2 17.1
Gonzalez 19.3 17 6.1 8.5
Donaldson 19.9 18.7 10.5 10.9
Frazier 22 21.1 8.4 7.9
Fowler 20.8 21.4 13.2 13.1
Seager 18.7 18 9.7 8
Gordon 22.9 19.6 9.9 10.1
Carter 32.4 31.8 9.1 9.8
Peralta 19 17.8 8.7 9.2
Valbuena 24.7 20.7 8.8 11.9
Span 14.3 9.7 5.6 7.5
Calhoun 19.7 19.4 6.3 7.1
Castro 18 17.6 7.3 6.2
Yelich 22.9 20.8 10.9 10.6
Pence 20.8 18.4 8.6 7.3
Jones 20 19.5 5.2 2.8
Gomes 23 23.2 5.6 4.6
Eaton 20.7 15.4 5.3 8
Pujols 14.7 10.2 5.7 6.9
Braun 19.9 19.5 6 7.1
Chisenhall 20.2 18.6 5.2 7.3
Dozier 25.9 18.2 8.6 12.6
Moss 27.8 26.4 9.7 11.6
Blackmon 16.3 14.8 5.7 4.8
Carpenter 25.1 15.7 9.9 13.4
Ozuna 27.8 26.8 6.8 6.7
Adams 19 20.2 5.6 4.6
Hunter 16 15.2 4.6 3.9
Ramirez 13.9 14.1 4.7 4
Dunn 30.9 31.1 14.1 13.9
Zobrist 17.6 12.8 9.4 11.5
Gardner 25.6 21.1 9.6 8.8
Plouffe 19.7 18.7 9.3 9.1
Davis 21.6 22.2 7.6 5.8
Gillaspie 14.9 15.4 6.7 7.1
Byrd 29.4 29 4.3 5.5
Heyward 18 15.1 9.7 10.3
Desmond 27.4 28.2 6.9 7.1
Kendrick 19.9 16.3 5.7 7.1
Ellsbury 14 14.6 7.9 7.7
Cespedes 20.6 19.8 5.4 5.4
Markakis 16.1 11.8 8.1 8.7
Utley 15.8 12.8 8.5 8
Suzuki 15.9 9.1 6.8 6.8
Prado 18.2 14 6.9 4.5
Murphy 13.4 13.4 6.4 6.1
Sandoval 12.1 13.3 4.9 6.1
Mauer 23.5 18.5 9.2 11.6
Choo 26.7 24.8 9.9 11
Reyes 12.7 11.1 5.6 5.8
Granderson 25.3 21.6 10.1 12.1
Aoki 11 8.9 8 7.8
Rollins 21.4 16.4 8.2 10.5
McGehee 16 14.8 8.5 9.7
Kinsler 11.3 10.9 5.7 4
Loney 12.7 12.3 7.2 6.3
Pedroia 19.3 12.3 6 8.4
Solarte 14.6 10.8 7.9 9.9
Teixeira 24.2 21.5 10.3 11.4
Longoria 20.3 19 6.2 8.1
Jones 20.4 21.2 8.9 8.4
Headley 21.9 23 10.9 9.6
Navarro 18 14.6 5.9 6.2
Ramirez 13.2 12.3 4.8 3.7
Crisp 18.3 12.3 8.9 12.3
Freese 24.9 24.3 7.3 7.4
Hosmer 17.4 17 7.7 6.4
Jennings 22.2 19.9 8.3 8.7
Gordon 20.5 16.5 4.5 4.8
Butler 17.3 15.9 5.6 6.8
de Aza 24.6 22.5 6.4 7.4
Crawford 24.8 22.9 7.4 10.5
Rios 18.7 17.9 7.1 4.4
Wright 18.7 19.3 7 7.2
Davis 34.1 33 10 11.4
Aybar 11 9.7 4.7 5.6
Cabrera 16.7 17.5 7.2 8
Montero 19.5 17.3 7.5 10
Castellanos 23.9 24.2 6.7 6.2
Escobar 14.8 13.4 4.6 3.7
Martin 20.5 19.6 5.5 6.7
Howard 30.1 29.3 9.8 10.3
McCann 16.9 14.3 7 5.9
Ackley 19.9 16.6 5.8 5.9
Revere 15.1 7.8 3.9 2.1
Perez 14 14 3.4 3.6
Hardy 24.8 18.3 5 5.1
Viciedo 20.2 21.7 6.5 5.7
Lowrie 13.6 14 7.3 9
Mercer 19.5 16 5.5 6.3
Escobar 10.9 11.3 8.9 8.1
Parra 14.8 17.4 7.3 5.6
Bogaerts 26.3 23.2 6.8 6.6
Jackson 23.4 22 8 7.2
LeMahieu 16.5 18 6 6.1
Castro 27 29.5 8.1 6.6
Andrus 18.5 14 8.5 6.7
Hechavarria 13.2 15 4 4.5
Hill 17.7 17 7.4 5.2
Kipnis 22.3 18 7.6 9
Johnson 26 26 3.9 3.8
Bruce 26.1 27.3 8.5 8.1
Hamilton 20.4 19.1 6 5.6
Brown 15.2 17.8 8.4 6.6
Infante 14.6 11.8 6.2 5.7
Jeter 12.1 13.7 5.5 5.5
Upton 29.3 29.7 7.4 9.8
Simmons 11.1 10.4 5.1 5.6
Segura 15.6 12.6 4.3 5
Craig 21.6 22.4 7.2 6.9
Dominguez 21.9 20.6 5.2 4.8
Cozart 15.3 14.5 5.3 4.6

One advantage of this method over any of the many regression based estimates using plate discipline stats is that this can be further tailored to each player. The reason for this is that ZONE+, ZSWING+, and OSWING+ are all league average indexes, and some players’ talents are just not captured by league averages. For example, Dustin Pedroia’s expected strikeout rate is nowhere near his actual strikeout rate. Presumably, Pedroia has swing tendencies in certain counts that are markedly different from the average hitter. By examining these swing tendencies, it is likely possible to predict Pedroia’s yearly strikeout rates with much greater accuracy, as those tendencies are probably part of his approach at the plate year after year. Still, as preliminary research into this area, these I think these results as a whole are very promising.


Velocity and the Likelihood of Tommy John Surgery

Around a month ago I wrote an article entitled “Tommy John Surgery and Throwing 95+ MPH”. Basically what I was trying to find out was, are pitchers who throw harder more likely to have Tommy John. The article fell short of this discovery, mainly because I only looked at pitchers who threw 95 or more. I wanted to get more in-depth but as my semester was coming to an end, I simply didn’t have the time to do an expanded study. Since then my semester has ended and I do have the time to get more in-depth.

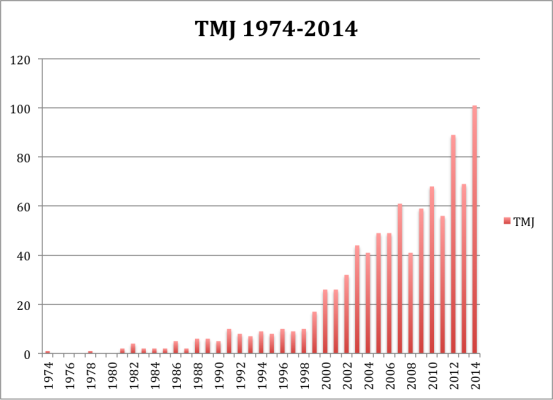
First, however, we’re going to tread back and look at old work. In November 2012, Jon Roegele came out with an article introducing his and Jeff Zimmerman’s Tommy John surgery list. At this point, I think it’s pretty safe to say it’s the most complete list of Tommy John surgeries. The list can be found on Jeff’s site baseballheatmaps.com. Below is an updated chart of the list.


TMJ


Then in July of 2013 Will Carroll came out with an article stating that 33% of opening day Major League pitchers had undergone the surgery. I, however, found the study problematic, which I discussed in my previous article.

In March of 2014, Jeff looked at players who threw a pitch 100MPH or harder and found that 25% of them had the surgery. And finally at this year’s Sloan Sports Analytics Conference, Dr. Glenn Fleisig found that 16% of all pitchers had Tommy John, 15% of Minor Leaguers had Tommy John, and 25% of Major Leaguers fell under the knife.

So how does this relate to velocity? Well in my previous article I found that 32% of pitchers who threw 95+ MPH on average had the surgery. If we are to believe Will Carroll’s findings then really there isn’t any significant risk of throwing harder. If we, however, choose to look Dr. Fleisig’s results then throwing harder does increase your chances of having Tommy John.

There are essentially two sources where velocity data can be found, PITCHfx, which dates back to 2007 and Baseball Info Solution (BIS), which dates back to 2002. Below is the yearly velocity data.


Year PITCHfx BIS
2002 89.56
2003 89.6
2004 89.77
2005 90.01
2006 90.17
2007 91.67 90.05
2008 91.39 90.43
2009 91.6 90.71
2010 91.82 91.01
2011 92.21 91.19
2012 92.34 91.32
2013 92.5 91.44
2014 93.05 91.43

As you can see velocity is on the rise. There are also discrepancies in the data. This is why when I did my study I looked at PITCHfx and BIS data separately to see if I would get different results.

Before we get into my results, however, I’ll explain my methodology. I gathered the PITCHfx data in Baseball Prospectus’ leaderboard. I looked at all the years available and did not set an innings limit, in order to get as large of a sample size as possible. This gave me 1484 pitchers to work with. I then looked up, which pitchers had Tommy John surgery. I basically did the same thing for the BIS data, which was gathered at FanGraphs. Again did not set an innings limit and this gave me a sample size of 2097 pitchers. I did not include position players as I felt they would skew the data.

I also set buckets for the velocity. The goal was to get as close to the exact velocity, while at the same time maintaining a respectable sample size. I did my best with this; you’ll find that in some cases there are some sample size issues.

So let’s begin. Below you will find the percent of pitchers who have had Tommy John surgery based on their velocity group.


PITCHfx

Velo Sample Size TMJ Count TMJ %
96+ 99 36 36.36%
95+ 196 61 31.12%
92 to 95 584 158 27.05%
89 to 92 530 106 20%
86 to 89 151 34 22.51%
86- 23 4 17.39%


BIS

Velo Sample Size TMJ Count TMJ %
96+ 36 8 22.22%
95+ 113 40 35%
92 to 95 547 147 26.87%
89 to 92 890 190 21.34%
86 to 89 429 83 19.34%
85- 118 16 13.55%


From this data it’s pretty clear that velocity does increase one’s likelihood of getting Tommy John surgery. The biggest increase happens from the 89-92 bucket to the 92-95 bucket. There is also a pretty big increase when looking at the 95+ bucket, in both tables, although I would argue that the sample size there is somewhat small. This doesn’t mean, however, that we can’t come to any conclusions. A 113 or 196 sample is definitely not as accurate as a 500 sample, but I don’t think that it’s unreasonable to suggest, based on this data, that throwing 95+ increases one’s likelihood of getting the surgery.

Also you might have noticed that in the PITCHfx table the 86 to 89 buckets are actually more likely to have Tommy John than the 89 to 92 group. This can be due to a couple of factors: A) We can definitely attribute some of this to a small sample size, especially since in the BIS table (where the sample is bigger) it shows a drop in percentage. B) The pitchers who are throwing in that group are probably older and therefore are more prone to the injury.

You’re at this point probably curious to see the results, so here they are. I was debating (with myself) whether I should show this or not. The sample is really small and I’m not sure we can really conclude anything from it. But I figured that showing some data is better than no data.


PITCHfx Age

Velo Sample Size Avg. Age
96+ 36 23.44
95+ 61 23.48
92 to 95 158 24.85
89 to 92 106 25.56
86 to 89 34 27.05
86- 4 33.5


BIS Age

Velo Sample Size Avg. Age
96+ 8 25.87
95+ 40 23.87
92 to 95 147 24.51
89 to 92 190 25.65
86 to 89 83 27.02
85- 16 28.68


So pitchers in the lower groups are older, this would seem to make sense, although again each sample is small. More data needs to be gathered here to come to an accurate conclusion. (The age chosen, for each individual pitcher, was the age of the year the Tommy John surgery occurred).

I also wanted to look at the difference between starting pitchers and relievers, or at least see if there was a difference. The logic being that on average relief pitchers will throw harder than starters so maybe they would have a higher likelihood of getting Tommy John surgery based on their velocity.

A relief pitcher was defined as this: GS/G < 0.5. Jeff Zimmerman deserves the credit here. For a while now I’ve been struggling to define what qualifies as a relief pitcher. Then I read Jeff’s latest article at The Hardball Times and stupidly asked how he defined a relief pitcher. Obviously he had defined it in the article (GS/G <0.5) and I missed it. I personally like this barometer for a relief pitcher. While I could have simply sorted the pitchers by there type on FanGraphs and BP, I don’t know where they draw the line on a relief pitcher. This at least gives us a concrete definition of what a reliever is. I also like this better than an arbitrary innings limit.

Important to also note is that the overall relief and starting pitcher data has nothing to do with velocity. It is rather the overall percentage of relief and starting pitchers who have undergone Tommy John. For BIS it dates back to 2002 and PITCHfx it’s 2007. Ok enough chitter-chatter, here are the results.


Overall PITCHfx RP

Sample Size TMJ Count TMJ %
1016 241 23.72%


Overall BIS RP

Sample Size TMJ Count TMJ %
1475 321 21.76%


PITCHfx RP

Velo Sample Size TMJ Count TMJ %
96+ 89 30 33.70%
95 + 175 51 29.14%
92 to 95 412 110 26.69%
89 to 92 340 61 17.94%
86 to 89 77 16 20.77%
86- 12 3 25%


BIS RP

Velo Sample Size TMJ Count TMJ %
96+ 35 8 22.85%
95+ 101 32 31.68%
92 to 95 437 121 27.68%
89 to 92 604 118 19.53%
86 to 89 262 42 16.03%
86- 71 8 11.26%


And now the starters.


Overall PITCHfx SP

Sample Size TMJ Count TMJ %
464 121 26.07%


Overall BIS SP

Sample Size TMJ Count TMJ %
623 155 24.87%


PITCHfx SP

Velo Sample Size TMJ Count TMJ %
95 to 98 20 9 45%
92 to 95 169 48 28.40%
89 to 92 190 45 23.68%
89- 85 19 22.35%


BIS SP

Velo Sample Size TMJ Count TMJ %
94 to 97 23 10 43.47%
91 to 94 191 47 24.60%
88 to 91 272 69 25.36%
88- 137 29 21.16%


Ok, let’s start with the relief pitchers, they’re less complicated. Basically the results aren’t very surprising, the harder one throws the higher chance one will fall under the knife. There again seems to be this vast increase between the 89 to 92 bucket and 92 to 95. Also, and this was surprising to me, the overall results for relievers show that they are actually less likely to have Tommy John, than the starters. Even more interesting was while BIS and PITCHfx data show different numbers, they seem to be telling the same story here. That starting pitchers are about 3% more likely to have Tommy John than relief pitchers.

Now let’s focus on the starters, and this is where there is a serious discrepancy in the data. With PITCHfx it shows that velocity does impact a starter’s likelihood of getting the surgery. While with the BIS data, the evidence is more ambiguous and the sample size is larger in the BIS data. I’m not sure what to personally make of this. Some might point out that the sample is not ideal. I would agree with that, a sample of 400 or 500 would be more accurate but a sample of 272 or even 169 are nothing to sneeze at. This is when the evidence is starting to take shape. What was even more surprising was that it was the BIS data that was more ambiguous because the sample is bigger.

There could also be a larger number of factors at play here. Starting pitchers throw more innings than relief pitchers, which puts added stress on the arm. They also throw more pitches, which based on which pitch they throw could also increase their chances of getting the surgery. Finally, and this is more of a hypothesis than anything, starting pitchers tend to have longer careers than relief pitchers. Therefore the older a pitcher gets the more likely he is to having a drop in velocity, while still maintaining the risk of Tommy John. This is of course a hypothesis. I think more data needs to be acquired to make a more accurate statement, but now at least I wouldn’t be surprised if the starting pitchers data was more ambiguous.

Finally let’s look at the overall results. This has nothing to do with velocity, just general Tommy John percentage.


Overall PITCHfx

Sample Size TMJ Count TMJ %
1484 363 24.46%


Overall BIS

Sample Size TMJ Count TMJ %
2097 476 23%


As you can see these results are more in line with Dr. Fleisig’s results (25% Major League pitchers). I don’t think it’s unreasonable there are some differences, however. This would depend on our methods of gathering the data and how we defined what a Major League pitcher is. My definition was very loose. Basically if a pitcher came up and threw one inning, then I put him in the results. The reason why I didn’t have a stricter definition of what a Major League pitcher was was because my goal wasn’t to find the percentage of Majors League pitchers who had Tommy John. Rather it was to examine the relationship between velocity and Tommy John surgeries. This is really just an added bonus. Also, Dr. Fleisig’s goal was to see how many current pitchers had Tommy John. My results are the percentage of pitchers who have had Tommy John since 2002 and 2007. We, however, now can accurately conclude, in my estimation, that Carroll’s results were way too high and that velocity does increase a player’s chance of having Tommy John.

This can make pitcher selection now very interesting. For example, if you are trying to decipher whether to get a pitcher who throws 96 MPH who is just as good as a pitcher who throws 90 MPH, you might be better off taking the guy who throws 90. By doing that you would be reducing the odds that that pitcher has Tommy John by about 7 to 10 percent, which is pretty good if you ask me. Also if you’re a GM or in fantasy and are terrified of relievers because you think they all tear their ulnar collateral ligaments, well you shouldn’t be. Your starters are actually slightly more likely to tear their UCL. There are of course other factors to consider here but these can serve as basic general guidelines. Finally velocity does increase your likelihood of tearing your UCL, although with starters the data is a little murkier.


Bonus: Pitchers who have had multiple Tommy John surgeries.

PITCHfx

Sample Size Velo Age
25 93.53 24.68


BIS

Sample Size Velo Age
31 92.17 25.12


Hardball Retrospective – The “Original” 2012 Los Angeles Dodgers

In “Hardball Retrospective: Evaluating Scouting and Development Outcomes for the Modern-Era Franchises”, I placed every ballplayer in the modern era (from 1901-present) on their original team. Therefore, Frank E. Thomas is listed on the White Sox roster for the duration of his career while the Yankees declare Fred McGriff and the Twins claim Rod Carew. I calculated revised standings for every season based entirely on the performance of each team’s “original” players. I discuss every team’s “original” players and seasons at length along with organizational performance with respect to the Amateur Draft (or First-Year Player Draft), amateur free agent signings and other methods of player acquisition.  Season standings, WAR and Win Shares totals for the “original” teams are compared against the “actual” team results to assess each franchise’s scouting, development and general management skills.

Expanding on my research for the book, the following series of articles will reveal the finest single-season rosters for every Major League organization based on overall rankings in OWAR and OWS along with the general managers and scouting directors that constructed the teams. “Hardball Retrospective” is available in digital format on Amazon, Barnes and Noble, GooglePlay, iTunes and KoboBooks. The print edition will be available soon. Additional information and a discussion forum are available at TuataraSoftware.com.

Don Daglow (Intellivision World Series Major League Baseball, Earl Weaver Baseball, Tony LaRussa Baseball) contributed the foreword for Hardball Retrospective. The foreword and preview of my book are accessible here.

Terminology

OWAR – Wins Above Replacement for players on “original” teams

OWS – Win Shares for players on “original” teams

OPW% – Pythagorean Won-Loss record for the “original” teams

Assessment

The 2012 Los Angeles Dodgers      OWAR: 47.1     OWS: 289     OPW%: .546

Five General Managers shaped the roster of the 2012 Dodgers over a 24-year period. Henry Blanco (1989) and Miguel Cairo (1990) were acquired before Paco Rodriguez was born! 37 of the 49 team members were selected through the Amateur Draft process. Notable exceptions (signed as amateur free agents) include Hiroki Kuroda, Adrian Beltre and Carlos Santana. Based on the revised standings the “Original” 2012 Dodgers edged the Diamondbacks by two games to secure the National League Western Division crown.

Adrian Beltre paced Los Angeles with 28 Win Shares, collected his fourth Gold Glove Award and posted a .321 BA with 36 round-trippers. Three backstops made significant contributions to the Dodgers in 2012 as A.J. Ellis, Russell Martin and Carlos Santana combined for 52 circuit clouts. Matt “The Bison” Kemp batted .303 with 23 jacks in an injury-shortened campaign and first-sacker Paul Konerko swatted 26 big-flies.

LINEUP POS WAR WS
Alejandro DeAza LF/CF 2.78 17.96
A. J. Ellis C 3.86 21.15
Adrian Beltre 3B 4.16 28.4
Matt Kemp CF 2.92 20.41
Paul Konerko 1B 2.24 18.69
Shane Victorino RF/LF 2.31 18.05
Tony Abreu 2B -0.07 1.24
Dee Gordon SS -0.36 3.86
BENCH POS WAR WS
Russell Martin C 3.26 11.15
Carlos Santana C 3.12 19.28
Justin Ruggiano CF 2.24 12.17
David Ross C 1.28 7.63
Franklin Gutierrez CF 0.9 4.56
Xavier Paul LF 0.34 2.91
Trayvon Robinson LF 0.32 2.54
Elian Herrera LF 0.28 4.7
Ivan De Jesus 2B -0.08 0.71
Jason Repko CF -0.13 0.2
Jerry Sands LF -0.15 0.11
Scott Van Slyke RF -0.31 0.39
Koyie Hill C -0.33 0.17
Blake DeWitt 2B -0.36 0.21
Henry Blanco C -0.4 1.46
Josh Bell 3B -0.45 0.25
Miguel Cairo 1B -1.08 1.01
James Loney 1B -1.28 4.62

Clayton Kershaw (14-9, 2.53) led the National League in ERA and WHIP (1.023) while placing runner-up in the Cy Young balloting. Hiroki Kuroda notched a career-best 16 victories along with a 3.32 ERA and a 1.165 WHIP. The bullpen excelled as Jonathan Broxton, Joel Hanrahan and Kenley Jansen saved a collective 90 games.

ROTATION POS WAR WS
Clayton Kershaw SP 6.1 19.56
Hiroki Kuroda SP 5.38 16.72
Eric Stults SP 1.71 6.82
Edwin Jackson SP 1.64 8.43
Chad Billingsley SP 1.53 8.3
BULLPEN POS WAR WS
Kenley Jansen RP 1.52 13.48
Jonathan Broxton RP 1.17 10.11
Joel Hanrahan RP 1.16 10.39
Wesley Wright RP 0.84 4.61
Javy Guerra RP 0.77 5.1
Steve Johnson SP 1.53 5.08
Nathan Eovaldi SP 0.7 3.86
James McDonald SP 0.64 7.12
Scott Elbert RP 0.63 3.36
Ted Lilly SP 0.3 3.36
Paco Rodriguez RP 0.2 0.65
Josh Lindblom RP 0.11 4.07
Bryan Morris RP 0.03 0.36
Josh Wall RP -0.05 0.34
Rubby De La Rosa RP -0.17 0
Shawn Tolleson RP -0.31 1.7
Takashi Saito RP -0.83 0
Cory Wade RP -1.18 0

The “Original” 2012 Los Angeles Dodgers roster

NAME POS WAR WS General Manager Scouting DIrector
Clayton Kershaw SP 6.1 19.56 Ned Colletti Logan White
Hiroki Kuroda SP 5.38 16.72 Ned Colletti Tim Hallgren
Adrian Beltre 3B 4.16 28.4 Fred Claire Terry Reynolds
A. J. Ellis C 3.86 21.15 Dan Evans Logan White
Russell Martin C 3.26 11.15 Dan Evans Logan White
Carlos Santana C 3.12 19.28 Paul DePodesta Logan White
Matt Kemp CF 2.92 20.41 Dan Evans Logan White
Alejandro De Aza CF 2.78 17.96 Kevin Malone Ed Creech
Shane Victorino LF 2.31 18.05 Kevin Malone Ed Creech
Paul Konerko 1B 2.24 18.69 Fred Claire Terry Reynolds
Justin Ruggiano CF 2.24 12.17 Paul DePodesta Logan White
Eric Stults SP 1.71 6.82 Dan Evans Logan White
Edwin Jackson SP 1.64 8.43 Kevin Malone Ed Creech
Chad Billingsley SP 1.53 8.3 Dan Evans Logan White
Steve Johnson SP 1.53 5.08 Paul DePodesta Logan White
Kenley Jansen RP 1.52 13.48 Paul DePodesta Logan White
David Ross C 1.28 7.63 Fred Claire Terry Reynolds
Jonathan Broxton RP 1.17 10.11 Dan Evans Logan White
Joel Hanrahan RP 1.16 10.39 Kevin Malone Ed Creech
Franklin Gutierrez CF 0.9 4.56 Kevin Malone Ed Creech
Wesley Wright RP 0.84 4.61 Dan Evans Logan White
Javy Guerra RP 0.77 5.1 Paul DePodesta Logan White
Nathan Eovaldi SP 0.7 3.86 Ned Colletti Tim Hallgren
James McDonald SP 0.64 7.12 Dan Evans Logan White
Scott Elbert RP 0.63 3.36 Paul DePodesta Logan White
Xavier Paul LF 0.34 2.91 Dan Evans Logan White
Trayvon Robinson LF 0.32 2.54 Paul DePodesta Logan White
Ted Lilly SP 0.3 3.36 Fred Claire Terry Reynolds
Elian Herrera LF 0.28 4.7 Dan Evans Logan White
Paco Rodriguez RP 0.2 0.65 Ned Colletti Logan White
Josh Lindblom RP 0.11 4.07 Ned Colletti Tim Hallgren
Bryan Morris RP 0.03 0.36 Ned Colletti Logan White
Josh Wall RP -0.05 0.34 Paul DePodesta Logan White
Tony Abreu 2B -0.07 1.24 Dan Evans Logan White
Ivan De Jesus 2B -0.08 0.71 Paul DePodesta Logan White
Jason Repko CF -0.13 0.2 Kevin Malone Ed Creech
Jerry Sands LF -0.15 0.11 Ned Colletti Tim Hallgren
Rubby De La Rosa RP -0.17 0 Ned Colletti Tim Hallgren
Scott Van Slyke RF -0.31 0.39 Paul DePodesta Logan White
Shawn Tolleson RP -0.31 1.7 Ned Colletti Logan White
Koyie Hill C -0.33 0.17 Kevin Malone Ed Creech
Blake DeWitt 2B -0.36 0.21 Paul DePodesta Logan White
Dee Gordon SS -0.36 3.86 Ned Colletti Tim Hallgren
Henry Blanco C -0.4 1.46 Fred Claire Ben Wade
Josh Bell 3B -0.45 0.25 Paul DePodesta Logan White
Takashi Saito RP -0.83 0 Ned Colletti Logan White
Miguel Cairo 1B -1.08 1.01 Fred Claire Ben Wade
Cory Wade RP -1.18 0 Paul DePodesta Logan White
James Loney 1B -1.28 4.62 Dan Evans Logan White

Honorable Mention

The “Original” 1973 Dodgers             OWAR: 45.9     OWS: 308     OPW%: .552

Jack Billingham (19-10, 3.04), Bill Singer (20-14, 3.22) and Don Sutton (18-10, 2.42) established a formidable rotation for the L.A. crew. Joe Ferguson (.263/25/88) topped the squad with 26 Win Shares. Ron Cey smashed 15 long balls and knocked in 80 runs in his rookie campaign. Los Angeles tied Cincinnati for second place with a record of 89-73 as Houston claimed the Western Division title with 92 victories.

On Deck

The “Original” 2005 Angels

References and Resources

Baseball America – Executive Database

Baseball-Reference

James, Bill. The New Bill James Historical Baseball Abstract. New York, NY.: The Free Press, 2001. Print.

James, Bill, with Jim Henzler. Win Shares. Morton Grove, Ill.: STATS, 2002. Print.

Retrosheet – Transactions Database

Seamheads – Baseball Gauge

Sean Lahman Baseball Archive


Introducing a Concussions Database

Today, all everybody seems to care about is the Tommy John surgery. The surgery is on the rise and people want to find a solution. This is not unreasonable, according to Jeff Zimmerman and Jon Roegele’s Tommy John database; there are now 100 players who suffered the surgery, alone in 2014. It’s therefore understandable that many people are not only talking about it but also studying it, and trying to find solutions.

But, what about other baseball injuries? Sure, the Tommy John surgery is a devastating injury, but it’s certainly not the only devastating injury in baseball. What about torn labrums, torn Achilles, fractures, concussions? Most other types of baseball injuries haven’t had a lot of studies on them. (As you can probably guess from the title, I’m going to be focusing on concussions). 

So I decided to zig to everyone’s zag. Over the past month I’ve constructed a concussions database. My database for the time being includes the start and end date of the concussion, days missed, DL type, Position, Team, Age, and cause. So far I’ve recorded 189 concussions.. This may not seem like a lot, especially when you compare it to Zimmerman and Roegele’s Tommy John database, which contains 962 cases of Tommy John. But concussions as I’ve found are not that common in baseball.

My database ranges from the years, 1985 to 2015. This, however, is very misleading. Since the year 2000 I found 187 recorded concussions, before the year 2000 I only found two. One was in 1985, suffered by Roy Smith, by a batted ball, which landed him on the 15-day DL. The other was by Ivan Rodriguez in 1999, which happened due to a collision at home plate; he was not put on the DL and didn’t even miss a game. I will obviously keep doing research and will try to find more players, but for the time being it appears that concussions were infrequently diagnosed or reported before 2000.

The database was constructed through many ways. My primary tool was the Pro Sports Transactions. I scoured through their injury database. I also used MLB Transactions, although that proved to be a very ineffective tool. A lot of the concussions I found on the Pro Sports Transactions were not included, and all of the concussions I found with MLB Transactions I already had compiled thanks to Pro Sports Transactions. Pro Sports Transactions, however, also had injury types described as “head”. While not all head injuries are concussions, I decided to do a player search of every player who suffered a “head” injury (according to Pro Sports Transactions).

I looked at many players through the Baseball Prospectus (BP) profile page because each players BP profile page includes their injury history. This also proved to be an indispensable tool in doing my research. It allowed me to find not only the injury type but also the injury cause. I therefore double-checked every player I found on the Pro Sports Transactions with their BP player profile page. The results and dates almost always matched up. If they didn’t I looked at other sources, such as online articles, or Rotoworld, which had a great transaction events in the players profile page. I also used bleacher reports and other news reports, which allowed me to find some but not lots info. (If you know of another site or way I could check to expand my list PLEASE let me know in the comment section or by email).

Finally before I get started I want to point out that I am not the first that will undergo or do studies on concussions. There was an article written by the NY Times recently, which identified a study published by the American Journal of Sports Medicine, which suggested that players performed worse when returning from concussions. The study, however, “…identified 66 position players who had concussions between 2007 and 2013, including some who never went on the disabled list.” There was also a study published by the SciMedCentral called “Epidemiology and Outcomes of Concussions in Major League Baseball”. The study looked at players from 2001 to 2010 who had concussions. The problem is that they only found 33 players who had concussions during that time. In both cases the sample size is really too small to come to any conclusion.

The way I see it the only database that can actually compete with mine is the BP, database, which according to this Ben Lindbergh article, “The Year of Living Less Dangerously,” contains 175 players from 2001 to 2013. I unfortunately, however, don’t know how big the database is today; the article was written in 2014 for Grantland.

What I hope to do with this database is construct similar and more complicated studies. The difference I believe, in the similar studies I will be conducting, is that my database simply has a larger sample size, which will allow us to get more accurate results.

For today, however, we’re just going to start off slowly. First we’re simply going take an overall look at the concussions I recorded. The chart below will show you the total amount of concussions I’ve been able to find from 2000 to 2014. The chart is also interactive — I used Tableau to create it. If you do some clicking around you’ll see that I’ve also included all the players who’ve landed on the DL, the players who’ve landed on the 7-day DL, the 15-day DL, 60-day DL, and those that didn’t end up on the DL (due to a concussion).

If for any reason you cannot interact with this graph here is a link to Tableau Public, which will allow you to interact with it. 

https://public.tableau.com/profile/publish/Concussion1_0/Story1#!/publish-confirm


Overall and DL Concussions data (2000-2014)

So hey look Tommy John surgeries are not the only thing that’s on the rise, concussions are too. While there’s a ton of variance in the 15-day, 60-day, and even the non-DL graphs, the amount of players landing on the DL due to a concussion is on the rise, and there might be an explanation for that.

You see, in the winter of 2011 Major League Baseball and the Players Association adopted new protocols regarding to concussions. The biggest change according to this Cash Karuth article “MLB, union adopt universal concussion policy” was the implementation of a seven-day disabled list for concussions. The protocol also forces teams to clear a, “club-submitted “Return to Play” form to Major League Baseball’s medical director. The submission of the form is required regardless of whether the player was placed on the disabled list.”

“New procedures will be implemented for evaluating players and umpires for possible concussions after such incidents as being hit in the head by a pitched, batted or thrown ball or bat; a collision with a player, umpire or fixed object; or any time the head or neck of a player or umpire is forcibly rotated.” (For more information I recommend reading the article.)

While there is a rise of concussions after the protocol was implemented, it’s hard to decipher based on these graphs whether it actually had a huge impact. Concussions were on the rise before the protocol was implemented and while there is a drastic increase in the 7-day DL department that was presumably inevitable due to the new rule. When looking at the overall concussions the drastic increase happened in years 2013 and 2014. For the overall DL stints it happened in 2013. In both cases it didn’t happen directly after the protocol was implemented. Maybe the protocol didn’t necessarily have a huge impact. Perhaps it only started to get enforced in 2013?

I also don’t know how many concussions were either not diagnosed or not reported. Before 2005 players rarely went on the DL due to a concussion. The concussions info before 2000 is almost non-existent. It’s hard to believe that players are suddenly getting concussed. This information was either not made public or poorly handled by Major League Baseball. Also maybe it’s simply that doctors are getting better at detecting concussions? Or they might just be paying more attention to it? These are questions unfortunately I simply don’t have an answer to at this point.

Let’s now take a look at which teams have been most impacted by this injury. The graph below again is interactive. The important element to note is that the bigger the circle the more concussions the team has suffered. If you’re not familiar with these types of interactive graphs, they’re relatively simple. Just bring your mouse over the circles and all the data will be there.

If for any reason you cannot interact with this graph here is a link to Tableau Public, which will allow you to interact with it. https://public.tableau.com/profile/julien1554#!/vizhome/Concussions2/Sheet1

Team Concussions 2000-2014

If we were living in an alternate universe and I had a gun to your head and made you guess the team which had suffered the most concussions, you’d probably guess the Twins. And you would be correct; since 2000 no team had suffered more concussions than the Twins, that is of course if you don’t count the Mets. Both teams have had a lot of players who underwent this injury. The Twins have most notably had Joe Mauer and Justin Morneau; both players’ careers have been seriously hampered by injuries. The Mets most notably had Jason Bay and David Wright.

Perhaps another interesting element to note is that the White Sox have the least amount of concussions suffered, at only two. That is of course if you don’t count the Padres who also have two. But for the sake of interesting trends let’s ignore the Padres.

The White Sox you see seem to have a knack or secret sauce for keeping their players healthy. According to this article by Jeff Zimmerman “2014 Disabled List Information and So Much More,” the White Sox have suffered the least amount of injuries since 2002. Also if we look this article by Jon Roegele, “Tommy John Surgeries: A More Complete List” the White Sox have suffered the least amount of Tommy John surgeries. I don’t and will not pretend to know what’s going on up there but it seems as though the White Sox are better than just about any other team at keeping their players healthy.

While I could have displayed a bigger sample of my database, I think all leave it here for today. I’ve given you a lot of information to absorb, and don’t want to overwhelm anyone.


Hardball Retrospective – The “Original” 1992 Chicago White Sox

In “Hardball Retrospective: Evaluating Scouting and Development Outcomes for the Modern-Era Franchises”, I placed every ballplayer in the modern era (from 1901-present) on their original team. Therefore, John Smoltz is listed on the Tigers roster for the duration of his career while the Rockies declare Matt Holliday and the Royals claim Carlos Beltran and Johnny Damon. I calculated revised standings for every season based entirely on the performance of each team’s “original” players. I discuss every team’s “original” players and seasons at length along with organizational performance with respect to the Amateur Draft (or First-Year Player Draft), amateur free agent signings and other methods of player acquisition.  Season standings, WAR and Win Shares totals for the “original” teams are compared against the “actual” team results to assess each franchise’s scouting, development and general management skills.

Expanding on my research for the book, the following series of articles will reveal the finest single-season rosters for every Major League organization based on overall rankings in OWAR and OWS along with the general managers and scouting directors that constructed the teams. “Hardball Retrospective” is available in digital format on Amazon, Barnes and Noble, GooglePlay, iTunes and KoboBooks. The print edition is coming soon. Additional information and a discussion forum are available at TuataraSoftware.com.

Terminology

OWAR – Wins Above Replacement for players on “original” teams

OWS – Win Shares for players on “original” teams

OPW% – Pythagorean Won-Loss record for the “original” teams

Assessment

The 1992 Chicago White Sox         OWAR: 48.7     OWS: 278     OPW%: .547

GM Roland Hemond acquired 48% (12 of 25) of the ballplayers on the 1992 White Sox roster. Larry Himes’ brief term as the GM of the Pale Hose yielded a bumper crop of future stars including Frank E. Thomas, Robin Ventura, Jack McDowell and Alex Fernandez. 20 of the 25 team members were selected through the Amateur Draft process. Based on the revised standings the “Original” 1992 White Sox outpaced the Athletics by a five-game margin in the American League Western Division race.

Thomas (.323/24/115) paced the Junior Circuit with 46 doubles, 122 walks and a .439 OBP. The “Big Hurt” was inducted into the Baseball Hall of Fame in 2014 after posting a .301 lifetime batting average with 521 home runs and 1704 RBI. Ventura (.282/16/93) ripped 38 two-base hits and earned his second of six Gold Glove Awards. Brian Downing (.407 OBP) and Harold Baines platooned as the Sox’ designated hitter.

Thomas ranks tenth among first basemen in “The New Bill James Historical Baseball Abstract.” Ventura (22nd-3B), Downing (38th-LF) and Baines (42nd-RF) also placed in the top 100 at their respective positions.

LINEUP POS WAR WS
Brian Downing DH 1.85 13.83
Randy Velarde SS 1.89 12.15
Frank Thomas 1B 5.99 36.23
Robin Ventura 3B 5.27 28.53
Ron Karkovice C 2.58 12.13
Daryl Boston LF 1.18 10.4
Tim Hulett 2B/3B 0.65 4.19
Cecil Espy RF 0.06 3.81
John Cangelosi CF/LF -0.16 0.81
BENCH POS WAR WS
Craig Grebeck SS 2.17 9.71
Harold Baines DH 0.44 12.52
Mike Maksudian 1B -0.04 0
Matt Merullo C -0.38 0.25

Doug Drabek (15-11, 2.77) fashioned a WHIP of 1.060 and whiffed a career-high 177 batsmen. Jack McDowell notched 20 victories with a 3.18 ERA and finished fifth in the 1992 American League Cy Young balloting. “Black Jack” claimed the award in the subsequent campaign with a 22-10 mark. Bobby Thigpen struggled in the closer’s role (22 SV, 4.75) and eventually relinquished the title to Scott Radinsky (15 SV, 2.73). Rich “Goose” Gossage rates 37th among pitchers in the “NBJHBA”.

ROTATION POS WAR WS
Doug Drabek SP 5.18 19.31
Jack McDowell SP 5.17 19.77
Alex Fernandez SP 0.21 6.39
Bob Wickman SP 0.43 2.91
Buddy Groom SP -0.57 0
BULLPEN POS WAR WS
Scott Radinsky RP 0.49 6.98
Rich Gossage RP 0.4 2.33
Bobby Thigpen RP -0.56 3.07
Donn Pall RP -1.17 2.17
Vicente Palacios RP/SP 0.08 1.92
Tony Menendez RP 0.09 0.68
Pedro Borbon RP -0.04 0

The “Original” 1992 Chicago White Sox roster

NAME POS WAR WS General Manager Scouting DIrector
Frank Thomas 1B 5.99 36.23 Larry Himes Al Goldis
Robin Ventura 3B 5.27 28.53 Larry Himes
Doug Drabek SP 5.18 19.31 Roland Hemond
Jack McDowell SP 5.17 19.77 Larry Himes
Ron Karkovice C 2.58 12.13 Roland Hemond
Craig Grebeck SS 2.17 9.71 Ken Harrelson
Randy Velarde SS 1.89 12.15 Roland Hemond
Brian Downing DH 1.85 13.83 Ed Short
Daryl Boston LF 1.18 10.4 Roland Hemond
Tim Hulett 3B 0.65 4.19 Roland Hemond
Scott Radinsky RP 0.49 6.98 Ken Harrelson
Harold Baines DH 0.44 12.52 Roland Hemond
Bob Wickman SP 0.43 2.91 Larry Himes Al Goldis
Rich Gossage RP 0.4 2.33 Ed Short
Alex Fernandez SP 0.21 6.39 Larry Himes Al Goldis
Tony Menendez RP 0.09 0.68 Roland Hemond
Vicente Palacios SP 0.08 1.92 Roland Hemond
Cecil Espy RF 0.06 3.81 Roland Hemond
Mike Maksudian 1B -0.04 0 Larry Himes
Pedro Borbon RP -0.04 0 Larry Himes
John Cangelosi LF -0.16 0.81 Roland Hemond
Matt Merullo C -0.38 0.25 Ken Harrelson
Bobby Thigpen RP -0.56 3.07 Roland Hemond
Buddy Groom SP -0.57 0 Larry Himes
Donn Pall RP -1.17 2.17 Roland Hemond

Honorable Mention

The “Original” 2006 White Sox          OWAR: 45.0     OWS: 293     OPW%: .533

Chicago captured the American League Central division title by 5 games over Cleveland. “Big Hurt” rebounded from two sub-par campaigns to swat 39 big-flies and drive in 114 runs. Mike Cameron clubbed 22 round-trippers, pilfered 25 bags and claimed his third Gold Glove Award. Joe Crede established personal-bests with 30 jacks, 94 ribbies and a .283 BA. Likewise second baseman Ray Durham set career-highs in home runs (26) and RBI (93). Carlos “El Caballo” Lee slugged 37 circuit clouts and plated 116 baserunners. Magglio Ordonez contributed a .298 BA with 24 dingers and 104 ribbies.

On Deck

The “Original” 2012 Dodgers

References and Resources

Baseball America – Executive Database

Baseball-Reference

James, Bill. The New Bill James Historical Baseball Abstract. New York, NY.: The Free Press, 2001. Print.

James, Bill, with Jim Henzler. Win Shares. Morton Grove, Ill.: STATS, 2002. Print.

Retrosheet – Transactions Database

Seamheads – Baseball Gauge

Sean Lahman Baseball Archive


Rafael Montero Scouting Report

Rafael Montero is one of the New York Mets’ top pitching prospects, and he was given the spot start the other evening against the Mets’ division rival the Miami Marlins.  Montero got the loss after giving up three runs in the sixth but looked sharp striking out six and walking one over 5.2 innings.  Although Montero was sent back to the Mets’ Triple-A affiliate in Las Vegas, he will be back up later this season for bullpen help and will be the first called up to replace any starters that get injured during the long 162-game season.

Positives

Fastball movement and command

Although Montero’s fastball is not overpowering (90-93 mph, topping out at 94 mph), he placed it on both sides of the plate and kept it knee-high throughout his start.  This translated into Marlins hitters taking called strikes early in their at-bats, striking out looking (See first inning Dee Gordon and third inning Adeiny Hechavarria) and a good groundball rate of 48.1% for Montero (50%+ is considered an above-average groundball pitcher).  Montero’s fastball also showed strong arm-side run and sink at 90-93 mph, which projects a continued strong groundball rate in future outings.

Kept pitches down in the zone

Montero kept nearly all of his fastballs and off-speed pitches thigh high or below which resulted in very few hard-hit balls by Marlins hitters.  The only three pitches that were hard hit off of Montero were:

  1. A Gordon fourth inning double on a four-seam fastball that was more a case of Gordon’s ability to hit rather than poor command by Montero.
  2. A Giancarlo Stanton fourth inning line out to Mets third baseman Eric Campbell that was a product of a knee-high and inside two-seam fastball which showed the importance of keeping the ball down in the zone. If that fastball was a bit higher, it could have resulted in either a double down the third-base line or a two-run home run.
  3. A Gordon sixth-inning single (advanced to second on Curtis Granderson fielding error) on a four-seam fastball that was left up in the strike zone. It was one of the few poor pitches left up and over the plate by Montero all night.

Use of slider

After a few appearances last year where Montero threw nearly 80% fastballs, the Mets have pushed him to throw his off-speed pitches more often.  Although Montero only threw 46% of his sliders for strikes last night, he did throw his slider for a strike when he needed to (see sixth inning Stanton 3-1 slider for called strike).  The 46% strike percentage can also be misleading because many of the times Montero threw his slider low and out of the strike zone in an attempt to cause a swing and miss.

Negatives

First-pitch strikes

Analyst that argue first-pitch strikes are overrated due to the small differences in 0-1 and 1-0 batting averages fail to understand that the first pitch of an at-bat will dictate which pitches will be thrown in the following pitches.  This is the reason that every pitching coach in America stresses the importance of first-pitch strikes to their pitchers.

Having said that, Montero did an average job getting ahead of hitters with first-pitch strikes or creating balls in play on the first pitch at a combined rate of 60%.  If Montero wants to become a second or third starter in a rotation, it will be imperative to get the first pitch of the at-bat into the strike zone closer to 75% to 80%.  When Montero does not get ahead of hitters, it is difficult for him to come back in an at-bat from 1-0, 2-0 and 2-1 counts because his off-speed pitches aren’t sharp enough to create many swing and misses.  This will force him to throw more predictable fastballs that will be hit into play harder.

Pitches up in the sixth inning

There were two notable pitches in the sixth inning that led to the Marlins go ahead runs:

  1. The four-seam fastball noted earlier to Gordon that resulted in a line drive single to right field.
  2. A 3-2 fastball to Stanton which resulted in a RBI single to left field.

On both of those fastballs, Montero didn’t get his hand on top of the baseball during his release or more commonly known as “finishing his pitch”.  This causes his four-seam fastball to stay up in the zone and allows his two-seam fastball to come back on a flat plane over the plate as opposed to a sinking plane left to right over the plate.  The reason Montero wasn’t able to finish his pitches well was most likely due to his small frame becoming tired on his 90th pitch of the game.

Comparison

Montero’s body type is similar to Pedro Martinez with his six-foot, 185-pound frame but large enough hands to have the ability to manipulate movement on the baseball.  The one main difference is Martinez threw a consistent mid-90’s fastball and much sharper breaking off-speed pitches.  Montero’s repertoire of pitches can better be compared to Tim Hudson with his low-90’s two-seam sinker and the ability to locate an above-average slider.


When Do Stars Become Scrubs?

Baseball is a game driven by stars. They create the most exciting highlight reels that captivate audiences and leave us all in awe. However, eventually every star player loses their battle with Father Time. The purpose of this research was to try and determine when a star player’s production declines to the point where they can become easily replaceable. I decided to use a process called survival analysis to determine when this event occurs.

Methodology

Survival analysis attempts to determine the probability of when an event will occur. In any survival analysis problem, you need to determine three things. You need to determine the requirements for your population, the variables to predict the time of event, and the event.

For this problem, I decided that I would include any player that had their first season of 4 WAR or higher between 1920 and 1999 in my population. I decided to use for my variables: the age when they recorded their first star season, body mass index, offensive runs above average per 150 games, and defensive runs above average per 150 games as my variables. The event I chose to predict was when the player would have his first season below 1 WAR following their star season. The cutoffs for determining stars and scrubs were fairly arbitrary, but I chose these cutoffs because the FanGraphs glossary loosely defines an All-Star season as 4-5 WAR and a scrub season as 0-1 WAR.

Determining the variables was much more difficult. I wanted to pick variables that would represent a player’s performance, age, and overall health. The age was simple enough to find, but it was difficult to find any injury history for players so I decided to calculate a player’s BMI from their listed height and weight. Obviously this isn’t a perfect representation, because a player’s weight is constantly changing throughout his career, but it’s the best that I could do given my limited resources. In order to limit my performance variables, I thought it was best to settle for the offensive runs and defensive runs component of WAR. However, since these are accumulating statistics, I had to recreate them as rate statistics in order to avoid creating correlation issues with the age variable in the model. I would have liked to use more offensive variables, but I feared that adding more inputs would make the model too convoluted and affect the accuracy of the player predictions. Alright, that’s enough preparation; let’s dive into the actual data.

Survival Rate Data

As a jumping off point, I’ll start by presenting a table of the survival rates for my population. Each season indicates the percentage of players from the original population that had not yet recorded a scrub season.


Season 1 2 3 4 5 6 7 8 9 10
Survival Function 87.62% 74.28% 65.20% 54.88% 45.80% 39.06% 32.32% 26.96% 22.15% 17.19%
Season 11 12 13 14 15 16 17 18 19 20
Survival Function 13.76% 10.73% 7.57% 5.50% 3.44% 2.06% 1.24% 0.69% 0.28% 0.00%

Let’s make some quick observations. The data shows that no star player has gone more than 20 seasons without recording a season below 1 WAR. It also appears that the survival function decays exponentially.  I also found it interesting that over 50% of stars turn into scrubs by their fifth season and that only 17% of star players survive 10 years in the majors before they register a scrub season. Looking at this data really helps to appreciate how rare it is when players like Derek Jeter and Adrian Beltre perform at a consistent level on a year to year basis.

Hazard Rate Data

Next, we will look at the hazard rate of the players in the population. One of the purposes of examining the hazard rate is to see how the rate of failure changes in a population over time. To find the hazard rate for each time period, you divide the amount of events recorded during a time period by the amount of players that have not yet registered a scrub season. Below is the following calculation for each time period in table format.

Season 1 2 3 4 5 6 7 8 9 10
Hazard Function 12.38% 15.23% 12.22% 15.82% 16.54% 14.71% 17.25% 16.60% 17.86% 22.36%
Season 11 12 13 14 15 16 17 18 19 20
Hazard Function 20.00% 22.00% 29.49% 27.27% 37.50% 40.00% 40.00% 44.44% 60.00% 100.00%

As you can see by the table above, the hazard rate generally increases with each passing season. This makes sense, because as players age, their skill level decreases and their odds of registering a scrub season will increase. However, the hazard rates are fairly constant for the first ten years and then rapidly increase from then on. I’m rather surprised that the hazard rates stayed so consistent for the first ten or so years. I would have guessed that the hazard function would have increased much more rapidly with each passing season.

Determining the Model

It is important to identify the trend of the hazard function, because it helps determine which distribution to use when creating a parametric model. If the hazard rate increases exponentially, you are supposed to use a Weibull distribution. If the hazard rate is constant, you are supposed to use an exponential distribution. Since the hazard function was increasing, I originally attempted to the use the Weibull distribution for the model but I found that the model was predicting too many players to fail in the first few seasons, so I decided to try an exponential distribution instead.

I found that the exponential distribution model was more accurate at predicting survival rates in the first ten years, but severely under predicted the amount of players that would record a scrub season after ten years. I decided to use the exponential distribution, because I believe that it would be far more useful to accurately predict the first ten years instead of the last ten years, since only 17% of players survive ten years. I also believe that any franchise would be thrilled to obtain ten years of stardom from a player and anymore production is just an added bonus.

Survival Rate Estimates

Below is a table of each star player from 2000 to 2014 with the year they entered the population, the time until they became a scrub, every variable included in the model and their predicted survival rate for each of their first ten seasons since becoming a star.

Year Entered Name Time of Event Age BMI Off Def Season 1 Season 2 Season 3 Season 4 Season 5 Season 6 Season 7 Season 8 Season 9 Season 10
2000 Bobby Higginson 2 29 25.1 14.7 -11.0 77.83% 60.58% 47.15% 36.70% 28.56% 22.23% 17.30% 13.47% 10.48% 8.16%
2000 Darin Erstad 6 26 25.0 8.2 8.0 83.94% 70.46% 59.14% 49.64% 41.67% 34.98% 29.36% 24.64% 20.68% 17.36%
2000 Jorge Posada 8 28 27.6 11.2 7.1 80.94% 65.51% 53.02% 42.91% 34.73% 28.11% 22.75% 18.41% 14.90% 12.06%
2000 Jose Vidro 4 25 24.4 3.1 -4.9 83.43% 69.61% 58.07% 48.45% 40.42% 33.72% 28.14% 23.47% 19.58% 16.34%
2000 Phil Nevin 2 29 23.1 5.1 -2.8 76.52% 58.55% 44.80% 34.28% 26.23% 20.07% 15.36% 11.75% 8.99% 6.88%
2000 Richard Hidalgo 2 25 27.5 19.6 9.5 87.32% 76.24% 66.57% 58.13% 50.75% 44.32% 38.69% 33.79% 29.50% 25.76%
2000 Shannon Stewart 5 26 23.7 9.9 -3.2 83.26% 69.33% 57.73% 48.07% 40.02% 33.32% 27.75% 23.10% 19.24% 16.02%
2000 Todd Helton 8 26 28.2 25.4 -1.4 86.03% 74.01% 63.67% 54.77% 47.12% 40.53% 34.87% 30.00% 25.81% 22.20%
2000 Troy Glaus 3 23 26.1 12.2 9.0 88.69% 78.66% 69.76% 61.87% 54.87% 48.66% 43.16% 38.28% 33.95% 30.11%
2001 Albert Pujols 12 21 28.7 47.2 0.8 93.62% 87.66% 82.07% 76.84% 71.94% 67.35% 63.06% 59.04% 55.27% 51.75%
2001 Aramis Ramirez 1 23 27.0 -3.7 -2.3 85.43% 72.99% 62.35% 53.27% 45.51% 38.88% 33.22% 28.38% 24.24% 20.71%
2001 Bret Boone 3 32 25.8 -4.0 -0.5 66.26% 43.91% 29.09% 19.28% 12.77% 8.46% 5.61% 3.72% 2.46% 1.63%
2001 Cliff Floyd 5 28 26.1 13.4 -6.7 79.99% 63.98% 51.18% 40.94% 32.75% 26.19% 20.95% 16.76% 13.41% 10.72%
2001 Corey Koskie 6 28 26.9 11.2 7.7 81.02% 65.64% 53.18% 43.08% 34.90% 28.28% 22.91% 18.56% 15.04% 12.18%
2001 Eric Chavez 6 23 28.4 8.8 3.4 87.79% 77.06% 67.65% 59.39% 52.13% 45.77% 40.18% 35.27% 30.96% 27.18%
2001 Ichiro Suzuki 10 27 23.7 26.6 7.5 85.65% 73.36% 62.83% 53.82% 46.10% 39.48% 33.82% 28.96% 24.81% 21.25%
2001 J.D. Drew 10 25 26.4 25.6 10.8 88.29% 77.95% 68.82% 60.76% 53.65% 47.37% 41.82% 36.92% 32.60% 28.78%
2001 Lance Berkman 11 25 29.0 35.8 -6.9 88.44% 78.21% 69.17% 61.17% 54.10% 47.84% 42.31% 37.42% 33.09% 29.27%
2001 Mike Sweeney 3 27 25.7 12.9 -7.4 81.67% 66.70% 54.48% 44.49% 36.34% 29.68% 24.24% 19.80% 16.17% 13.21%
2001 Paul Lo Duca 6 29 27.7 11.2 14.7 79.86% 63.78% 50.94% 40.68% 32.49% 25.95% 20.72% 16.55% 13.22% 10.56%
2001 Placido Polanco 5 25 28.1 -9.1 12.1 82.55% 68.14% 56.25% 46.43% 38.33% 31.64% 26.12% 21.56% 17.80% 14.69%
2001 Rich Aurilia 6 29 23.1 4.1 10.1 77.86% 60.63% 47.21% 36.76% 28.62% 22.28% 17.35% 13.51% 10.52% 8.19%
2001 Ryan Klesko 5 30 27.5 21.8 -10.8 77.39% 59.89% 46.35% 35.87% 27.76% 21.48% 16.63% 12.87% 9.96% 7.71%
2001 Torii Hunter 13 25 28.9 -11.5 7.3 81.57% 66.53% 54.27% 44.26% 36.10% 29.45% 24.02% 19.59% 15.98% 13.03%
2002 Adam Dunn 6 22 32.9 25.5 -4.2 90.45% 81.82% 74.01% 66.94% 60.55% 54.77% 49.54% 44.81% 40.54% 36.67%
2002 Adrian Beltre N/A 23 30.7 -0.8 10.8 86.84% 75.41% 65.49% 56.87% 49.39% 42.89% 37.24% 32.34% 28.09% 24.39%
2002 Alfonso Soriano 7 26 25.7 11.8 -11.3 82.81% 68.57% 56.78% 47.02% 38.93% 32.24% 26.70% 22.11% 18.31% 15.16%
2002 Austin Kearns 2 22 30.0 31.7 17.8 92.26% 85.12% 78.53% 72.45% 66.84% 61.67% 56.89% 52.49% 48.43% 44.68%
2002 David Eckstein 5 27 27.4 4.8 5.3 81.22% 65.97% 53.58% 43.52% 35.34% 28.71% 23.31% 18.94% 15.38% 12.49%
2002 Edgar Renteria 7 25 26.4 -6.1 8.4 82.83% 68.61% 56.83% 47.08% 38.99% 32.30% 26.76% 22.16% 18.36% 15.21%
2002 Eric Hinske 2 24 30.2 21.6 4.6 88.41% 78.16% 69.10% 61.09% 54.00% 47.74% 42.21% 37.31% 32.99% 29.16%
2002 Jacque Jones 2 27 25.1 0.5 4.9 80.34% 64.54% 51.85% 41.66% 33.47% 26.89% 21.60% 17.35% 13.94% 11.20%
2002 Jose Hernandez 1 32 23.7 -8.5 8.1 66.31% 43.97% 29.16% 19.34% 12.82% 8.50% 5.64% 3.74% 2.48% 1.64%
2002 Junior Spivey 1 27 25.1 15.0 0.7 82.92% 68.76% 57.01% 47.28% 39.20% 32.50% 26.95% 22.35% 18.53% 15.37%
2002 Mark Kotsay 4 26 29.8 -0.1 11.5 82.51% 68.08% 56.18% 46.35% 38.25% 31.56% 26.04% 21.49% 17.73% 14.63%
2002 Miguel Tejada 8 28 32.5 3.5 1.8 78.40% 61.46% 48.19% 37.78% 29.62% 23.22% 18.20% 14.27% 11.19% 8.77%
2002 Pat Burrell 1 25 28.6 16.1 -15.1 84.76% 71.84% 60.90% 51.62% 43.75% 37.08% 31.43% 26.64% 22.58% 19.14%
2002 Randy Winn 8 28 22.5 -3.9 -0.8 76.68% 58.80% 45.09% 34.57% 26.51% 20.33% 15.59% 11.95% 9.17% 7.03%
2003 Bill Mueller 3 32 24.4 9.6 2.9 71.27% 50.80% 36.20% 25.80% 18.39% 13.11% 9.34% 6.66% 4.75% 3.38%
2003 Garret Anderson 1 31 23.7 2.7 0.7 71.50% 51.13% 36.56% 26.14% 18.69% 13.37% 9.56% 6.83% 4.89% 3.49%
2003 Hank Blalock 2 22 25.3 2.4 12.3 88.77% 78.80% 69.94% 62.09% 55.11% 48.92% 43.43% 38.55% 34.22% 30.37%
2003 Javy Lopez 3 32 23.1 8.8 7.8 71.83% 51.59% 37.06% 26.62% 19.12% 13.73% 9.87% 7.09% 5.09% 3.66%
2003 Jeff DaVanon 2 29 25.1 3.7 9.6 77.61% 60.23% 46.75% 36.28% 28.16% 21.85% 16.96% 13.16% 10.21% 7.93%
2003 Juan Pierre 5 25 25.8 -9.8 10.9 82.36% 67.84% 55.87% 46.02% 37.90% 31.22% 25.71% 21.18% 17.44% 14.37%
2003 Luis Castillo 5 27 20.2 0.5 3.3 80.34% 64.55% 51.86% 41.67% 33.48% 26.89% 21.61% 17.36% 13.95% 11.21%
2003 Marcus Giles 4 25 27.4 17.2 9.8 86.98% 75.66% 65.81% 57.24% 49.79% 43.31% 37.67% 32.77% 28.50% 24.79%
2003 Mark Loretta 2 31 23.7 -1.0 -1.9 69.97% 48.96% 34.25% 23.97% 16.77% 11.73% 8.21% 5.74% 4.02% 2.81%
2003 Melvin Mora 6 31 27.9 4.1 5.8 72.44% 52.48% 38.01% 27.54% 19.95% 14.45% 10.47% 7.58% 5.49% 3.98%
2003 Mike Lowell 2 29 23.7 7.4 2.3 77.70% 60.37% 46.90% 36.44% 28.31% 22.00% 17.09% 13.28% 10.32% 8.02%
2003 Milton Bradley 6 25 29.2 -2.7 7.1 83.29% 69.36% 57.77% 48.11% 40.07% 33.37% 27.80% 23.15% 19.28% 16.06%
2003 Morgan Ensberg 1 27 27.0 14.4 10.3 83.64% 69.96% 58.52% 48.95% 40.94% 34.25% 28.64% 23.96% 20.04% 16.76%
2003 Orlando Cabrera 1 28 28.0 -10.3 10.2 76.18% 58.04% 44.21% 33.68% 25.66% 19.55% 14.89% 11.34% 8.64% 6.58%
2003 Rafael Furcal 8 25 29.6 2.7 6.5 84.23% 70.94% 59.75% 50.33% 42.39% 35.70% 30.07% 25.33% 21.33% 17.97%
2003 Trot Nixon 4 29 25.7 16.8 -0.3 79.54% 63.27% 50.33% 40.04% 31.85% 25.33% 20.15% 16.03% 12.75% 10.14%
2004 Aaron Rowand 4 26 28.5 8.6 10.6 84.15% 70.81% 59.58% 50.14% 42.19% 35.50% 29.87% 25.14% 21.15% 17.80%
2004 Aubrey Huff 1 27 27.4 12.5 -11.3 81.13% 65.82% 53.40% 43.32% 35.15% 28.52% 23.14% 18.77% 15.23% 12.35%
2004 Brad Wilkerson 2 27 27.1 13.8 -3.1 82.23% 67.62% 55.61% 45.73% 37.61% 30.93% 25.43% 20.91% 17.20% 14.14%
2004 Carl Crawford 7 22 28.9 -3.4 13.0 87.93% 77.31% 67.98% 59.77% 52.56% 46.21% 40.63% 35.73% 31.41% 27.62%
2004 Carlos Guillen 5 28 28.4 4.7 5.7 79.30% 62.89% 49.87% 39.55% 31.36% 24.87% 19.72% 15.64% 12.40% 9.84%
2004 Carlos Lee 5 28 34.7 9.9 -3.6 79.19% 62.71% 49.66% 39.32% 31.14% 24.66% 19.53% 15.46% 12.25% 9.70%
2004 Coco Crisp 2 24 26.5 -4.6 9.9 84.85% 72.00% 61.09% 51.83% 43.98% 37.32% 31.67% 26.87% 22.80% 19.34%
2004 Corey Patterson 1 24 25.8 -5.1 8.8 84.68% 71.71% 60.73% 51.43% 43.55% 36.88% 31.23% 26.45% 22.40% 18.97%
2004 David Ortiz 5 28 28.0 14.6 -14.8 79.28% 62.85% 49.82% 39.50% 31.31% 24.82% 19.68% 15.60% 12.37% 9.80%
2004 Jack Wilson 2 26 27.1 -18.0 11.7 78.73% 61.99% 48.80% 38.42% 30.25% 23.82% 18.75% 14.76% 11.62% 9.15%
2004 Jason Varitek 2 32 29.5 1.4 8.6 69.34% 48.08% 33.34% 23.12% 16.03% 11.11% 7.71% 5.34% 3.70% 2.57%
2004 Jimmy Rollins N/A 25 27.4 -3.1 6.4 83.21% 69.24% 57.61% 47.94% 39.89% 33.19% 27.62% 22.98% 19.12% 15.91%
2004 Mark Teixeira 9 24 26.9 11.9 -1.9 86.61% 75.01% 64.96% 56.26% 48.72% 42.20% 36.55% 31.65% 27.41% 23.74%
2004 Travis Hafner 4 27 30.0 26.7 -17.1 83.33% 69.44% 57.86% 48.22% 40.18% 33.48% 27.90% 23.25% 19.37% 16.14%
2004 Vernon Wells 5 25 30.3 9.2 -2.8 84.56% 71.50% 60.46% 51.12% 43.23% 36.56% 30.91% 26.14% 22.10% 18.69%
2005 Brian Roberts 6 27 25.8 4.8 6.0 81.34% 66.16% 53.82% 43.78% 35.61% 28.96% 23.56% 19.16% 15.59% 12.68%
2005 Chase Utley N/A 26 26.4 15.7 13.2 85.66% 73.37% 62.85% 53.83% 46.11% 39.50% 33.83% 28.98% 24.82% 21.26%
2005 David DeJesus 9 25 26.5 6.8 2.8 84.73% 71.79% 60.82% 51.53% 43.66% 36.99% 31.34% 26.56% 22.50% 19.06%
2005 David Wright N/A 22 27.8 31.4 1.5 91.48% 83.69% 76.57% 70.04% 64.08% 58.62% 53.63% 49.06% 44.88% 41.06%
2005 Derrek Lee 1 29 28.5 18.4 -11.5 78.52% 61.66% 48.42% 38.02% 29.85% 23.44% 18.41% 14.45% 11.35% 8.91%
2005 Felipe Lopez 2 25 27.8 -3.9 1.5 82.57% 68.17% 56.29% 46.47% 38.37% 31.68% 26.16% 21.60% 17.83% 14.72%
2005 Grady Sizemore 5 22 25.7 16.2 11.2 90.39% 81.71% 73.86% 66.76% 60.35% 54.55% 49.31% 44.57% 40.29% 36.42%
2005 Jason Bay 2 26 27.0 37.1 -15.6 86.82% 75.37% 65.44% 56.81% 49.32% 42.82% 37.17% 32.27% 28.02% 24.32%
2005 Jhonny Peralta 1 23 27.6 6.0 2.9 87.36% 76.33% 66.68% 58.26% 50.90% 44.46% 38.85% 33.94% 29.65% 25.90%
2005 Julio Lugo 2 29 23.1 -3.3 6.7 75.53% 57.05% 43.09% 32.55% 24.58% 18.57% 14.03% 10.59% 8.00% 6.04%
2005 Mark Ellis 9 28 27.3 6.3 8.1 79.97% 63.95% 51.14% 40.89% 32.70% 26.15% 20.91% 16.72% 13.37% 10.69%
2005 Michael Young 7 28 26.4 3.9 -4.8 77.96% 60.77% 47.37% 36.93% 28.79% 22.44% 17.50% 13.64% 10.63% 8.29%
2005 Miguel Cabrera N/A 22 29.2 23.8 -13.8 89.77% 80.58% 72.33% 64.93% 58.28% 52.32% 46.96% 42.16% 37.84% 33.97%
2005 Nick Johnson 3 26 29.4 12.9 -7.3 83.28% 69.35% 57.75% 48.09% 40.05% 33.35% 27.77% 23.13% 19.26% 16.04%
2005 Richie Sexson 2 30 23.7 18.2 -12.9 76.37% 58.32% 44.54% 34.01% 25.98% 19.84% 15.15% 11.57% 8.84% 6.75%
2005 Victor Martinez 3 26 27.0 7.3 7.4 83.66% 70.00% 58.56% 49.00% 40.99% 34.30% 28.69% 24.01% 20.08% 16.80%
2006 Bill Hall 2 26 28.5 2.4 5.5 82.47% 68.01% 56.08% 46.25% 38.14% 31.45% 25.94% 21.39% 17.64% 14.55%
2006 Brandon Inge 2 29 26.5 -11.3 12.0 73.90% 54.62% 40.37% 29.83% 22.05% 16.29% 12.04% 8.90% 6.58% 4.86%
2006 Brian McCann N/A 22 28.7 12.3 8.4 89.71% 80.47% 72.19% 64.76% 58.09% 52.11% 46.75% 41.94% 37.62% 33.75%
2006 Curtis Granderson N/A 25 26.4 3.3 12.5 84.96% 72.18% 61.33% 52.11% 44.27% 37.61% 31.96% 27.15% 23.07% 19.60%
2006 Dan Uggla 7 26 29.3 13.1 7.2 84.62% 71.60% 60.58% 51.26% 43.38% 36.70% 31.06% 26.28% 22.24% 18.81%
2006 Freddy Sanchez 2 28 27.1 3.1 11.9 79.68% 63.49% 50.58% 40.31% 32.11% 25.59% 20.39% 16.25% 12.94% 10.31%
2006 Garrett Atkins 2 26 24.4 7.3 1.9 83.22% 69.26% 57.64% 47.97% 39.93% 33.23% 27.65% 23.02% 19.15% 15.94%
2006 Hanley Ramirez 5 22 28.9 22.4 -2.3 90.28% 81.50% 73.58% 66.43% 59.97% 54.14% 48.88% 44.12% 39.84% 35.96%
2006 Joe Mauer N/A 23 27.3 23.2 7.6 89.97% 80.94% 72.82% 65.52% 58.94% 53.03% 47.71% 42.92% 38.62% 34.74%
2006 Jose Reyes 3 23 26.4 3.8 9.7 87.55% 76.66% 67.12% 58.76% 51.45% 45.05% 39.44% 34.53% 30.24% 26.47%
2006 Ramon Hernandez 2 30 29.8 -2.7 14.1 74.04% 54.81% 40.58% 30.05% 22.24% 16.47% 12.19% 9.03% 6.68% 4.95%
2006 Reed Johnson 1 29 27.3 1.8 -0.3 75.78% 57.43% 43.52% 32.98% 25.00% 18.94% 14.36% 10.88% 8.24% 6.25%
2006 Ryan Howard 6 26 30.4 39.3 -11.0 87.40% 76.38% 66.76% 58.34% 50.99% 44.56% 38.95% 34.04% 29.75% 26.00%
2007 Alex Rios 2 26 24.9 6.4 5.2 83.34% 69.46% 57.89% 48.25% 40.21% 33.51% 27.93% 23.28% 19.40% 16.17%
2007 B.J. Upton 6 22 23.1 14.7 -5.7 89.26% 79.67% 71.11% 63.47% 56.65% 50.57% 45.14% 40.29% 35.96% 32.10%
2007 Brandon Phillips N/A 26 27.1 -11.3 7.9 79.86% 63.78% 50.93% 40.67% 32.48% 25.94% 20.72% 16.54% 13.21% 10.55%
2007 Carlos Pena 5 29 28.9 18.1 -16.3 77.86% 60.61% 47.19% 36.74% 28.61% 22.27% 17.34% 13.50% 10.51% 8.18%
2007 Chone Figgins 4 29 27.4 9.7 -3.0 77.46% 59.99% 46.47% 35.99% 27.88% 21.59% 16.73% 12.95% 10.03% 7.77%
2007 Corey Hart 1 25 26.6 10.8 -2.5 84.98% 72.21% 61.36% 52.14% 44.31% 37.65% 32.00% 27.19% 23.10% 19.63%
2007 Kevin Youkilis 6 28 29.0 12.3 0.3 80.40% 64.65% 51.98% 41.79% 33.60% 27.02% 21.72% 17.47% 14.04% 11.29%
2007 Matt Holliday N/A 27 30.4 26.0 -7.6 84.05% 70.65% 59.38% 49.91% 41.95% 35.26% 29.64% 24.91% 20.94% 17.60%
2007 Nick Markakis 6 23 25.1 11.1 -2.0 87.81% 77.11% 67.71% 59.46% 52.21% 45.85% 40.26% 35.35% 31.04% 27.26%
2007 Nick Swisher 7 26 27.1 16.7 -4.8 84.28% 71.02% 59.86% 50.44% 42.51% 35.83% 30.19% 25.45% 21.44% 18.07%
2007 Prince Fielder 7 23 38.4 22.1 -17.8 87.95% 77.35% 68.03% 59.83% 52.62% 46.28% 40.71% 35.80% 31.49% 27.69%
2007 Robinson Cano 1 24 28.5 11.7 -6.1 86.21% 74.31% 64.06% 55.22% 47.61% 41.04% 35.38% 30.50% 26.29% 22.66%
2007 Russell Martin N/A 24 30.8 10.5 14.4 87.50% 76.57% 67.00% 58.62% 51.30% 44.89% 39.28% 34.37% 30.07% 26.31%
2007 Ryan Zimmerman N/A 22 27.5 9.1 10.4 89.46% 80.03% 71.60% 64.05% 57.30% 51.27% 45.86% 41.03% 36.71% 32.84%
2007 Troy Tulowitzki 1 22 26.9 2.2 15.8 88.92% 79.07% 70.32% 62.53% 55.60% 49.44% 43.97% 39.10% 34.77% 30.92%
2008 Carlos Quentin 1 25 31.0 14.5 -2.6 85.47% 73.05% 62.43% 53.36% 45.60% 38.98% 33.31% 28.47% 24.33% 20.80%
2008 Dustin Pedroia N/A 24 25.1 13.5 6.3 87.51% 76.58% 67.01% 58.64% 51.32% 44.91% 39.30% 34.39% 30.09% 26.33%
2008 Evan Longoria N/A 22 27.0 25.9 21.9 91.95% 84.55% 77.75% 71.49% 65.74% 60.45% 55.59% 51.11% 47.00% 43.22%
2008 Ian Kinsler N/A 26 27.1 18.2 -6.5 84.40% 71.24% 60.13% 50.75% 42.84% 36.16% 30.52% 25.76% 21.74% 18.35%
2008 J.J. Hardy N/A 25 25.1 -2.1 15.9 84.34% 71.13% 59.98% 50.59% 42.66% 35.98% 30.35% 25.59% 21.58% 18.20%
2008 Jacoby Ellsbury 2 24 25.7 7.4 16.9 87.36% 76.32% 66.67% 58.24% 50.88% 44.45% 38.83% 33.92% 29.63% 25.89%
2008 Jayson Werth 4 29 28.5 12.8 10.6 79.75% 63.60% 50.72% 40.45% 32.26% 25.73% 20.52% 16.36% 13.05% 10.41%
2008 Josh Hamilton N/A 27 29.2 28.3 -9.6 84.33% 71.12% 59.97% 50.58% 42.65% 35.97% 30.33% 25.58% 21.57% 18.19%
2008 Mark DeRosa 2 33 28.4 -1.6 0.9 64.22% 41.24% 26.48% 17.01% 10.92% 7.01% 4.50% 2.89% 1.86% 1.19%
2008 Mike Aviles 1 27 29.4 20.3 21.5 85.59% 73.26% 62.70% 53.66% 45.93% 39.31% 33.65% 28.80% 24.65% 21.10%
2008 Ryan Braun 6 24 25.7 36.6 -17.5 89.07% 79.33% 70.66% 62.94% 56.06% 49.93% 44.47% 39.61% 35.28% 31.43%
2008 Ryan Ludwick 3 29 27.6 16.6 0.2 79.47% 63.15% 50.19% 39.88% 31.69% 25.19% 20.02% 15.91% 12.64% 10.04%
2008 Shane Victorino 6 27 28.1 4.0 9.1 81.43% 66.31% 53.99% 43.96% 35.80% 29.15% 23.74% 19.33% 15.74% 12.82%
2009 Aaron Hill 2 27 28.6 3.3 4.0 80.72% 65.16% 52.60% 42.46% 34.27% 27.67% 22.33% 18.03% 14.55% 11.75%
2009 Adrian Gonzalez N/A 27 28.9 19.8 -10.1 82.68% 68.37% 56.53% 46.74% 38.65% 31.96% 26.42% 21.85% 18.07% 14.94%
2009 Ben Zobrist N/A 28 26.2 11.9 9.9 81.42% 66.29% 53.98% 43.95% 35.78% 29.14% 23.72% 19.32% 15.73% 12.81%
2009 Casey Blake 3 35 26.3 5.8 0.1 60.57% 36.69% 22.23% 13.46% 8.15% 4.94% 2.99% 1.81% 1.10% 0.66%
2009 Denard Span N/A 25 28.5 23.8 -1.6 87.10% 75.87% 66.08% 57.56% 50.13% 43.67% 38.03% 33.13% 28.86% 25.13%
2009 Franklin Gutierrez 3 26 25.0 -1.8 18.8 83.05% 68.97% 57.28% 47.57% 39.50% 32.81% 27.25% 22.63% 18.79% 15.61%
2009 Jason Bartlett 3 29 25.8 5.9 13.7 78.61% 61.79% 48.58% 38.19% 30.02% 23.60% 18.55% 14.58% 11.46% 9.01%
2009 Joey Votto N/A 25 28.2 28.7 -8.1 87.36% 76.32% 66.67% 58.24% 50.88% 44.45% 38.83% 33.92% 29.64% 25.89%
2009 Justin Upton N/A 21 26.3 13.3 -6.9 90.00% 81.01% 72.91% 65.62% 59.06% 53.16% 47.84% 43.06% 38.76% 34.88%
2009 Marco Scutaro 5 33 26.5 -5.2 3.3 63.45% 40.26% 25.55% 16.21% 10.29% 6.53% 4.14% 2.63% 1.67% 1.06%
2009 Matt Kemp 1 24 26.2 16.9 -4.8 87.18% 76.00% 66.26% 57.76% 50.36% 43.90% 38.27% 33.37% 29.09% 25.36%
2009 Michael Bourn 5 26 25.8 -2.5 7.8 81.80% 66.92% 54.74% 44.78% 36.63% 29.96% 24.51% 20.05% 16.40% 13.42%
2009 Nyjer Morgan 1 28 25.8 3.4 27.3 81.46% 66.35% 54.05% 44.03% 35.86% 29.21% 23.80% 19.38% 15.79% 12.86%
2009 Pablo Sandoval N/A 22 34.2 29.1 -1.6 90.97% 82.76% 75.29% 68.49% 62.31% 56.68% 51.56% 46.91% 42.67% 38.82%
2009 Shin-Soo Choo 5 26 28.6 28.4 -5.3 86.20% 74.30% 64.05% 55.21% 47.59% 41.02% 35.36% 30.48% 26.28% 22.65%
2010 Alexei Ramirez N/A 28 23.1 -3.3 6.6 77.71% 60.39% 46.93% 36.47% 28.34% 22.03% 17.12% 13.30% 10.34% 8.03%
2010 Andres Torres 3 32 28.0 6.1 14.2 71.73% 51.45% 36.90% 26.47% 18.99% 13.62% 9.77% 7.01% 5.03% 3.61%
2010 Angel Pagan 1 28 25.7 6.4 8.6 80.12% 64.20% 51.43% 41.21% 33.02% 26.46% 21.20% 16.98% 13.61% 10.90%
2010 Austin Jackson 4 23 24.4 8.2 7.5 88.08% 77.59% 68.34% 60.20% 53.02% 46.71% 41.14% 36.24% 31.92% 28.12%
2010 Brett Gardner 2 26 26.5 8.2 21.3 85.05% 72.34% 61.52% 52.33% 44.51% 37.85% 32.19% 27.38% 23.29% 19.81%
2010 Buster Posey N/A 23 28.4 18.0 10.6 89.49% 80.08% 71.67% 64.13% 57.39% 51.36% 45.96% 41.13% 36.81% 32.94%
2010 Carlos Gonzalez 4 24 29.0 17.4 3.5 87.78% 77.06% 67.64% 59.38% 52.12% 45.75% 40.16% 35.26% 30.95% 27.17%
2010 Carlos Ruiz N/A 31 29.4 -5.0 14.6 70.92% 50.30% 35.68% 25.30% 17.95% 12.73% 9.03% 6.40% 4.54% 3.22%
2010 Chase Headley N/A 26 28.2 1.9 -2.1 81.63% 66.64% 54.40% 44.40% 36.25% 29.59% 24.15% 19.72% 16.09% 13.14%
2010 Chris Young 3 26 25.7 -1.1 0.5 81.34% 66.17% 53.82% 43.78% 35.61% 28.97% 23.56% 19.17% 15.59% 12.68%
2010 Colby Rasmus 1 23 25.0 12.8 3.8 88.46% 78.25% 69.21% 61.23% 54.16% 47.91% 42.38% 37.49% 33.16% 29.33%
2010 Daric Barton 1 24 27.8 11.8 -2.8 86.51% 74.84% 64.74% 56.00% 48.45% 41.91% 36.25% 31.36% 27.13% 23.47%
2010 Jason Heyward N/A 20 29.0 28.5 -1.1 92.70% 85.94% 79.67% 73.86% 68.47% 63.47% 58.84% 54.55% 50.57% 46.88%
2010 Jay Bruce 4 23 26.9 7.5 5.6 87.79% 77.07% 67.66% 59.40% 52.15% 45.78% 40.19% 35.28% 30.98% 27.19%
2010 Jose Bautista N/A 29 27.8 3.5 -9.0 75.07% 56.35% 42.30% 31.76% 23.84% 17.90% 13.43% 10.08% 7.57% 5.68%
2010 Justin Morneau 1 29 26.8 17.0 -7.5 78.72% 61.96% 48.78% 38.39% 30.22% 23.79% 18.73% 14.74% 11.60% 9.13%
2010 Kelly Johnson 2 28 26.4 9.5 2.2 80.07% 64.12% 51.34% 41.11% 32.92% 26.36% 21.11% 16.90% 13.53% 10.84%
2010 Marlon Byrd 2 32 33.2 0.9 1.7 67.87% 46.07% 31.27% 21.22% 14.41% 9.78% 6.64% 4.50% 3.06% 2.08%
2010 Nelson Cruz N/A 29 29.5 10.2 4.0 78.35% 61.38% 48.09% 37.68% 29.52% 23.13% 18.12% 14.20% 11.12% 8.71%
2010 Rickie Weeks 3 27 31.6 12.0 -3.6 81.66% 66.68% 54.45% 44.47% 36.31% 29.65% 24.21% 19.77% 16.15% 13.18%
2010 Stephen Drew 2 27 25.8 -0.7 1.5 79.66% 63.46% 50.55% 40.27% 32.08% 25.56% 20.36% 16.22% 12.92% 10.29%
2011 Alex Avila 2 24 29.3 9.9 1.4 86.49% 74.80% 64.69% 55.95% 48.39% 41.85% 36.20% 31.31% 27.08% 23.42%
2011 Alex Gordon N/A 27 29.0 7.0 1.0 81.18% 65.90% 53.49% 43.43% 35.25% 28.62% 23.23% 18.86% 15.31% 12.43%
2011 Andrew McCutchen N/A 24 27.3 24.1 -1.9 88.39% 78.12% 69.05% 61.03% 53.95% 47.68% 42.14% 37.25% 32.92% 29.10%
2011 Cameron Maybin 2 24 25.6 4.7 6.9 86.19% 74.29% 64.03% 55.19% 47.57% 41.00% 35.34% 30.46% 26.26% 22.63%
2011 Elvis Andrus N/A 22 27.1 -4.6 13.7 87.84% 77.16% 67.78% 59.53% 52.30% 45.94% 40.35% 35.44% 31.13% 27.35%
2011 Giancarlo Stanton N/A 21 27.7 20.6 0.6 91.21% 83.19% 75.87% 69.20% 63.12% 57.57% 52.51% 47.89% 43.68% 39.84%
2011 Howie Kendrick N/A 27 30.1 4.5 6.1 81.14% 65.84% 53.42% 43.34% 35.17% 28.54% 23.15% 18.79% 15.24% 12.37%
2011 Hunter Pence N/A 28 26.8 15.2 -1.6 80.92% 65.47% 52.98% 42.87% 34.69% 28.07% 22.71% 18.38% 14.87% 12.03%
2011 Matt Wieters 3 25 28.5 -7.6 18.4 83.43% 69.60% 58.07% 48.45% 40.42% 33.72% 28.13% 23.47% 19.58% 16.34%
2011 Mike Napoli N/A 29 29.8 20.5 2.3 80.50% 64.81% 52.17% 42.00% 33.81% 27.22% 21.91% 17.64% 14.20% 11.43%
2011 Peter Bourjos 2 24 24.4 4.6 20.5 87.24% 76.11% 66.40% 57.92% 50.53% 44.09% 38.46% 33.55% 29.27% 25.54%
2011 Yadier Molina N/A 28 30.7 -14.6 20.1 76.20% 58.06% 44.24% 33.71% 25.69% 19.58% 14.92% 11.37% 8.66% 6.60%
2012 Adam Jones N/A 26 28.1 4.2 -1.8 82.13% 67.46% 55.41% 45.51% 37.38% 30.70% 25.22% 20.71% 17.01% 13.97%
2012 Bryce Harper N/A 19 28.1 18.0 9.0 92.98% 86.45% 80.38% 74.73% 69.48% 64.60% 60.07% 55.85% 51.93% 48.28%
2012 Edwin Encarnacion N/A 29 30.3 10.1 -11.4 76.39% 58.36% 44.58% 34.06% 26.02% 19.88% 15.19% 11.60% 8.86% 6.77%
2012 Ian Desmond N/A 26 26.9 0.3 2.6 81.81% 66.93% 54.75% 44.79% 36.65% 29.98% 24.53% 20.06% 16.41% 13.43%
2012 Josh Reddick N/A 25 23.1 2.2 10.1 84.65% 71.66% 60.66% 51.35% 43.47% 36.80% 31.15% 26.37% 22.32% 18.90%
2012 Martin Prado N/A 28 25.1 7.8 1.7 79.70% 63.52% 50.63% 40.35% 32.16% 25.63% 20.43% 16.28% 12.98% 10.34%
2012 Melky Cabrera 1 27 30.1 0.9 -5.4 79.08% 62.54% 49.46% 39.11% 30.93% 24.46% 19.35% 15.30% 12.10% 9.57%
2012 Miguel Montero 1 28 29.3 1.7 8.2 78.85% 62.17% 49.02% 38.65% 30.48% 24.03% 18.95% 14.94% 11.78% 9.29%
2012 Mike Trout N/A 20 29.5 53.6 13.0 95.05% 90.35% 85.89% 81.64% 77.60% 73.76% 70.12% 66.65% 63.35% 60.22%
2013 Andrelton Simmons N/A 23 25.0 -5.9 32.5 87.81% 77.10% 67.71% 59.45% 52.20% 45.84% 40.25% 35.35% 31.04% 27.25%
2013 Brandon Belt 1 25 26.1 16.7 -6.5 85.66% 73.37% 62.85% 53.83% 46.11% 39.50% 33.83% 28.98% 24.82% 21.26%
2013 Carlos Gomez N/A 27 27.5 -1.4 15.1 80.92% 65.48% 52.98% 42.87% 34.69% 28.07% 22.72% 18.38% 14.87% 12.04%
2013 Chris Davis 1 27 28.7 13.6 -13.9 81.04% 65.67% 53.22% 43.13% 34.95% 28.33% 22.96% 18.60% 15.08% 12.22%
2013 Freddie Freeman N/A 23 26.7 17.3 -14.6 87.77% 77.04% 67.62% 59.36% 52.10% 45.73% 40.14% 35.23% 30.92% 27.14%
2013 Gerardo Parra 1 26 27.9 -6.2 9.2 81.11% 65.78% 53.35% 43.27% 35.09% 28.46% 23.09% 18.72% 15.19% 12.32%
2013 Jason Castro N/A 26 26.9 2.9 4.5 82.54% 68.12% 56.23% 46.41% 38.30% 31.61% 26.09% 21.54% 17.78% 14.67%
2013 Jason Kipnis 1 26 26.5 17.6 -2.3 84.69% 71.72% 60.74% 51.44% 43.56% 36.89% 31.24% 26.46% 22.41% 18.97%
2013 Josh Donaldson N/A 27 29.8 19.0 10.9 84.45% 71.32% 60.23% 50.87% 42.96% 36.28% 30.64% 25.87% 21.85% 18.45%
2013 Juan Uribe N/A 34 31.9 -12.1 12.1 58.89% 34.68% 20.42% 12.03% 7.08% 4.17% 2.46% 1.45% 0.85% 0.50%
2013 Kyle Seager N/A 25 28.5 8.3 2.2 84.87% 72.03% 61.14% 51.89% 44.04% 37.38% 31.72% 26.92% 22.85% 19.39%
2013 Manny Machado N/A 20 23.1 0.2 28.8 91.50% 83.73% 76.61% 70.10% 64.15% 58.69% 53.71% 49.14% 44.97% 41.15%
2013 Matt Carpenter N/A 27 26.9 27.7 -3.7 84.82% 71.95% 61.03% 51.77% 43.91% 37.25% 31.60% 26.80% 22.73% 19.28%
2013 Paul Goldschmidt N/A 25 30.6 30.0 -9.6 87.39% 76.38% 66.75% 58.34% 50.98% 44.56% 38.94% 34.03% 29.74% 25.99%
2013 Starling Marte N/A 24 24.4 17.9 7.8 88.26% 77.90% 68.75% 60.68% 53.55% 47.26% 41.71% 36.82% 32.49% 28.68%
2013 Yasiel Puig N/A 22 29.4 37.6 -0.9 91.96% 84.58% 77.78% 71.53% 65.78% 60.50% 55.64% 51.17% 47.05% 43.27%
2014 Anthony Rendon N/A 24 26.4 18.4 6.2 88.17% 77.74% 68.55% 60.44% 53.29% 46.99% 41.43% 36.53% 32.21% 28.40%
2014 Anthony Rizzo N/A 24 30.0 11.5 -3.0 86.37% 74.60% 64.44% 55.65% 48.07% 41.52% 35.86% 30.97% 26.75% 23.11%
2014 Brian Dozier N/A 27 26.5 3.4 -0.5 80.33% 64.53% 51.84% 41.64% 33.45% 26.87% 21.59% 17.34% 13.93% 11.19%
2014 Christian Yelich N/A 22 25.0 17.7 -0.7 89.89% 80.81% 72.64% 65.30% 58.70% 52.77% 47.44% 42.65% 38.34% 34.46%
2014 Devin Mesoraco N/A 26 29.0 -2.0 7.8 81.78% 66.89% 54.70% 44.74% 36.59% 29.93% 24.47% 20.02% 16.37% 13.39%
2014 Erick Aybar N/A 30 25.8 -1.6 7.6 73.64% 54.22% 39.93% 29.40% 21.65% 15.94% 11.74% 8.64% 6.37% 4.69%
2014 J.D. Martinez N/A 26 27.5 1.8 -9.8 80.83% 65.33% 52.81% 42.68% 34.50% 27.89% 22.54% 18.22% 14.73% 11.90%
2014 Jonathan Lucroy N/A 28 26.4 6.4 11.2 80.37% 64.60% 51.92% 41.73% 33.54% 26.96% 21.66% 17.41% 13.99% 11.25%
2014 Jose Abreu N/A 27 31.9 42.9 -14.9 86.30% 74.48% 64.28% 55.48% 47.88% 41.32% 35.66% 30.77% 26.56% 22.92%
2014 Jose Altuve N/A 24 28.2 5.0 -6.4 85.08% 72.39% 61.59% 52.40% 44.58% 37.93% 32.27% 27.46% 23.36% 19.87%
2014 Josh Harrison N/A 26 30.4 5.4 3.4 82.79% 68.54% 56.75% 46.98% 38.90% 32.20% 26.66% 22.07% 18.27% 15.13%
2014 Juan Lagares N/A 25 28.4 -5.1 28.9 84.82% 71.95% 61.03% 51.77% 43.91% 37.25% 31.60% 26.80% 22.74% 19.28%
2014 Kevin Kiermaier N/A 24 25.7 13.1 21.3 88.48% 78.28% 69.26% 61.28% 54.22% 47.97% 42.44% 37.55% 33.22% 29.39%
2014 Lorenzo Cain N/A 28 26.3 2.8 19.4 80.49% 64.78% 52.14% 41.97% 33.78% 27.19% 21.88% 17.61% 14.18% 11.41%
2014 Michael Brantley N/A 27 25.7 10.0 -8.4 80.96% 65.55% 53.07% 42.97% 34.79% 28.17% 22.80% 18.46% 14.95% 12.10%
2014 Steve Pearce N/A 31 29.3 6.6 -3.1 71.82% 51.58% 37.04% 26.60% 19.11% 13.72% 9.85% 7.08% 5.08% 3.65%
2014 Todd Frazier N/A 28 27.5 11.0 4.4 80.61% 64.98% 52.38% 42.22% 34.03% 27.43% 22.11% 17.82% 14.37% 11.58%
2014 Yan Gomes N/A 26 27.6 9.4 13.6 84.58% 71.54% 60.51% 51.18% 43.29% 36.62% 30.97% 26.20% 22.16% 18.74%

Conclusions

After looking at this table, we can draw several conclusions. First, this Mike Trout guy is really good at baseball. Secondly, age is the main variable in determining the time until failure. The players with the highest survival rates are all under twenty-five and all the lowest survival rates are over thirty. This makes sense, because it is much easier for a twenty-year-old star to remain effective until he is thirty compared to a thirty-year-old star attempting to remain effective until he is forty. This is because older players face more challenges such as eroding skills, an increased chance of sustaining injuries and having their playing time reduced to prevent injuries.

It also appears that offensive stars survive longer than defensive stars. This is probably due to the fact that defensive skills usually deteriorate faster than offensive skills. I also believe that since defensive statistics are more volatile than offensive statistics, that players that derive much of their value from their defense are more likely to have their WAR fluctuate from year to year. This makes it more likely that a defensive star could register a scrub season one year and then become a star again the next year. And this brings me to my next point.

Things to Keep in Mind

If a player records a scrub season that does not necessarily mean that he is finished.  If this were the case, players like Aramis Ramirez, Robinson Cano and Troy Tulowitzki would have had much less productive careers. It is also important to remember that a player enters the population as soon as they record their first star season, so it is quite possible that a player could improve after their first star season and make it more likely that they can outlast their projected survival rate. The main thing to remember is that no model is perfect and no model is meant to replace the human decision-making process. Models are only meant to improve the decision-making process and it is my hope that this model has accomplished that goal.


Different Aging Curves For Different Strikeout Profiles

What follows will look at aging curves as they relate to players with specific strikeout profiles. Specifically, we will look at how wOBA ages for players that strikeout more than the league-average strikeout rate and less than the league-average strikeout rate.

Through the research that is presented in this post, two points will be proven:

  1. Players of different strikeout profiles age—their wOBAs change—at different rates.
  2. The aging curve for players of different strikeout profiles has changed over time.

Before I present the methodology, the research that was conducted, and their conclusions, I want to give a big thank you to Jeff Zimmerman, who has not only done a lot of research around aging curves, but has also helped me throughout this process and pushed me in the right direction several times when I was stuck. Thank you.

Population

In order to give a non insignificant amount of time for a player’s wOBA to stabilize, but not place the playing time threshold for plate appearances so high that we artificially limit the population even more than it naturally is at the ends of the age spectrum, I looked at all player season from 1950 to 2014 where a player had a minimum of 600 plate appearances for the first aging curve in this post. The second aging curve in this post looks at all player seasons from 1990 to 2014 with a minimum of 600 plate appearances.

Now that we have our population, we need to split our population into two groups: players that strikeout more than league average and players that strikeout less than league average.

Because the league average strikeout rate of today is very different than it was 65 years ago, we can’t look at a player’s strikeout rate from 1950 and compare it to the league average strikeout rate of today.

In order to divide the population into two groups, I created a stat that weighs a player’s strikeout rate against the league average strikeout rate for the years that they played. For example, if a player played from 1970 to 1975, their adjusted strikeout rate would reflect how their strikeout rate compares to the league average strikeout rate from 1970 to 1975.

Players were then placed into two buckets based on their adjusted strikeout rate: players that struck out more than league average and players that struck out less than league average.

Methodology

There has been a lot of discussion over the years about the correct methodology to use for aging curves. This conversation has had altruistic intentions in the sense that it’s aim has been to minimize the survivorship bias that is inherent in the process, and, through the progress that has been made over the years, this study uses what the author has found to his knowledge to be the best technique to date. This article by Mitchell Lichtman summarizes a lot of the opinions.

While there is a survivorship bias inherent in any aging curve, the purpose of the different techniques used to create aging curves is to minimize the survivorship bias wherever possible.

What We Don’t Want In an Aging Curve 

An aging curve is not the average of all performances by players of specific ages. For example, say you have a group of 30-year-old players that have an average of a .320 wOBA and group of 29-year-old players that have an average of a .300 wOBA.

The point of an aging curve is to see how a player aged, not how they played. The group of 30-year-old players has a high wOBA because they are a talented group of players; they lasted long enough to play until they are 30. As they aged from the previous year, when they were 29 to their current age 30 season, they lost the bottom portion of players from their player pool. These are the players that couldn’t hang on any longer, whether it be because of a decline in defense, offense, or a combination of both. This bottom portion of players lower the wOBA of the current 29-year-old population through their presence and raise the wOBA of the 30-year-old population through their absence.

At the same time, the current 30-year-olds aged from their age-29 season to their age-30 season. Sure, there may be players who had a better age-30 season than age-29 season, but the current group of 30-year-olds, as a whole, still played worse at 30 than they did at 29.

When you look at the average of a particular age group, in this case 30-year-olds, you only see the players that survived, and, because they no longer play, you leave behind the players that are hidden from you sample. The method that follows resolves this issue to an extent.

What We Do Want In an Aging Curve

This study uses the delta method which looks at the differences of player seasons (i.e. a players age 29 wOBA minus their age 28 wOBA) and weighs those differences by the harmonic mean of the plate appearances for each pair seasons in question.

I would explain this further, but Jeff Zimmerman does an excellent job of this in a post on hitter aging curves that he did several years ago. While Jeff Zimmerman looked at RAA, which is a counting state, the methodology is basically the same for our purposes and wOBA, which is a rate stat:

In a nutshell, to do accurate work on this, I needed to go through all the hitters who ever played two consecutive seasons. If a player played back-to-back seasons, the RAA values were compared. The RAA values were adjusted to the harmonic mean of that player’s plate appearances.

Consider this fictional player:

Year1: RAA = 40 in 600 PA age 25
Year2: RAA = 30 in 300 PA age 26

Adjusting to harmonic mean: 2/((1/PA_y1)+(1/PA_y2)) = PA_hm
/((1/600)+(1/300)) = 400

Adjust RAA to PA_hm: (PA_hm/PA_y1)*RAA_y1 = RAA_y1_hm
(400/600)*40 = 26.7 RAA for Year1
(400/300)*30 = 40 RAA for Year2

This player would have gained 13.3 RAR (40 RAA – 26.7 RAA) in 400 PA from ages 25 to 26. From then, I then would add all the changes in RAA and PA together and adjust the values to 600 PA to see how much a player improved as he aged.

Findings

Below is an aging curve by strikeout profile for all player seasons with over 600 plate appearances in a season from 1950 until 2015.

Screen Shot 2015-04-18 at 1.23.52 PM

We can see several findings immediately:

  1. Players do age differently based on their strikeout profile.
  2. Players that strikeout more than league average peak at 23.
  3. Players that strikeout less than league average take longer to hit their peak—their age 26 season.
  4. Players that strikeout more than league average age better than players that strikeout less than league average.

From a historical perspective, this graph is fun to look at, but the way the game was played over half a century ago is eclipsed by societal evolutions that today’s players benefit from.

To give us a more realistic idea of how today’s players age relative to their strikeout rate, I made another graph the at looks at player seasons from 1990 to 2014.

Screen Shot 2015-04-18 at 1.40.36 PM

What we find in this graph, which is more current with today’s style of play, is that players still age differently dependent on their strikeout profile, but not in the same way that they did in the previous sample.

Players that strikeout more than league average still peak earlier than players that strike out less than league average, but in this more current population of players, players that strikeout more than league average peak very early—their age 21 season. This information would reciprocate the sentiment that has been conveyed through recent work that suggests that the aging curve has changed to the point that players peak almost as soon as when they enter the league.

The peak age for players that strikeout at below league average rates is still 26, but whereas this group aged more poorly than the strikeout heavy group in our previous population, players that strikeout at below league average rates now age better than their counterparts.

Conclusions

This information can make material differences for our overall expectations and outlooks on players.

Previous knowledge would suggest that players like George Springer and Kris Bryant—players who have exorbitant strikeout rates—are still on the climb as far as their talent goes, but this information shows that these players may already be at/close to their peaks or on the decline as far a their wOBA is concerned.

This information also shows that we should be patient with prospects that have a penchant to put balls is play; while they peak more quickly than they did in the previous population, they take longer to develop than players with more swing and miss in their game, and when they do start to decline, there isn’t much need to worry, because their climb from their peaks will be gradual.

Like many other studies that have looked at new aging curves, this study confirms that players/prospects peak earlier now than at any other point throughout history, but it also shows that a player’s trajectory upward and downward is dependent on characteristics specific to their approaches at the plate.

Devon Jordan is obsessed with statistical analysis, non-fiction literature, and electronic music. If you enjoyed reading him, follow him on Twitter @devonjjordan.