Being Drafted and Making the Show the Same Year
At this point we’re less than a month away from the June 8th, 2015 Major League Draft. Which essentially means we’re in draft season. A lot of mock drafts are coming out, and most fans are excited to see which young talent their team will add to their minor-league system. While the draft can be an exciting event to some, it’s very different than the NBA or NFL draft. Unlike in the NBA and NFL draft where a player will have an immediate impact on the team upon being drafted, the players drafted in the Major League draft will have to spend some time in the minors before making an impact. Most fans therefore won’t be able to see the fruition of the draft for several years. This can be frustrating.
But every now and then a rare event in baseball occurs. A player sometimes reaches the Majors the same year he’s drafted. This event actually happened last year. Brandon Finnegan, you see, was drafted 17th overall, in the first round of last year’s draft by the Kansas City Royals. He eventually went on to make his Major League debut that same season on September 6th and helped the Royals reach the playoffs for the first time since 1985. Finnegan, however, is not the first player to accomplish this feat. Since the draft was first implemented in 1965, a total of 55 players who have been drafted made the majors the same season. This of course does not include international free agents.
But is this feat becoming more or less prevalent? Are certain organizations more likely to promote a player quickly? Is there a certain position that get’s promoted more frequently? And is this even a smart strategy? Will this affect a player’s long-term success? Are the players capable of actually helping the Major League squad? These are all questions I will attempt to answer.
First will look at the prevalence of this feat.

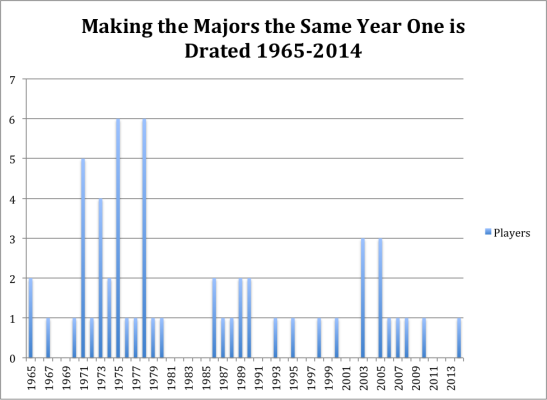
As you can see this was actually not an uncommon occurrence in the 70s. It was actually pretty popular, in 1975 and 1978 as a total of 6 players made the majors upon being drafted. In fact this event actually happened at least once a year for ten straight seasons (1970-1980). Now, however, the trend is far less frequent. Brandon Finnegan was the first player to accomplish the feat since 2010, when Chris Sale was promoted by the White Sox to the Major Leagues.
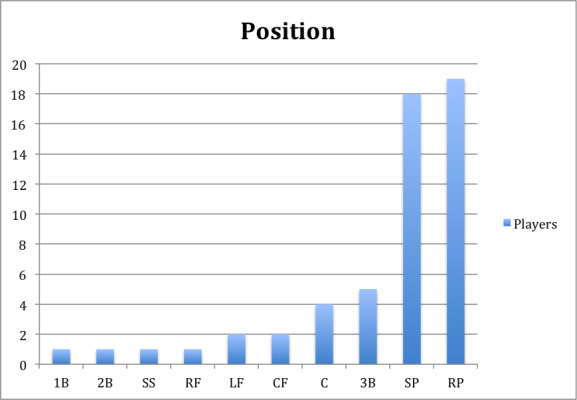
What you may have noticed at this point, is that both players are pitchers. In fact both players were promoted to the majors as relief pitchers. I think at this point most of us would assume that the vast majority of players promoted to the majors upon being drafted would be pitchers. It simply makes sense. Some pitchers coming out of college who have devastating stuff can theoretically come up and get batters out. A position player, however, probably needs more time in the minors to develop an acceptable hitting approach before he can help a team. Developing a hitting approach takes time. So below is the list of all 55 players separated by their different positions.

If you happened to read my latest Tommy John article you probably noticed that a relief pitcher was defined as GS/G < 0.5. I again used this barometer to define a relief pitcher. The position of the player was also defined as, the position that was most often played, the year of the promotion. So for example normally Chris Sale would be defined as a starter, but since he was primarily used as a reliever when promoted, I put him in the reliever group.
At this point you’ve probably noticed that the majority of players promoted are in fact pitchers. As for the reasons stated above this shouldn’t be very surprising.
So now let’s look at whether this is an effective strategy. Most teams are probably hoping that these players make an impact, or else why would they be promoting them, which would speed up their free agent clock, and theoretically affect their development.
Basically what I did was rather simple. I looked at the average stats of all the players when they were promoted. I also, obviously, split the pitchers and position players into two different groups. There were a total of 38 different pitchers and 17 position players.
| Pitchers | |||
| Age | Innings | ERA+ | PWARP |
| 20.8 | 27.52 | 107.5 | 0.05 |
| Position Players | |||
| Age | PA | wRC+ | WAR |
| 20.76 | 77 | 101.11 | 0.14 |
The results seem to look good, while ERA+ isn’t a perfect statistic by any measure it gives us a sense of the situation and here it looks like the pitchers who are promoted to the majors upon being drafted give above-average production. The hitters fare less well but again give an above-average production. For rookies who have just been called up, I’d say that’s pretty good. This is of course an average look at the players and one needs to consider that not all of them were productive. Also, this strategy for teams is only productive if they’re filling in a need. If a player for example, is performing below league average then this would be an effective strategy, if he were performing above league average then you’re probably better off keeping your everyday player in the lineup.
If we also take a look at the PA and innings, it seems that these players are being used as role players. So basically part-time fielders, or mostly relief pitchers. The position chart above, however, doesn’t support this claim, as the second-most frequent position was starting pitcher.
Another explanation therefore could be that these players are called up later in the season; for example, I would guess that most of them are called up in September. Fortunately though I don’t have to guess I have the results, so here they are.
| Months | Players |
| April | 1 |
| May | 0 |
| June | 11 |
| July | 7 |
| August | 10 |
| September | 24 |
As one might have expected most players are called up by September. This is not surprising. What might be surprising was that a player was called up in April. This might be surprising to some especially considering that the draft begins in June. Some of you might think this is an error. It, however, is not. You see, initially baseball’s draft was divided into three separate drafts. The first and largest was in June. The second was in January, to adhere to the players who graduated in the winter semesters. The third and final round then took place in August. The August draft only lasted two years, while the January draft lasted until 1986. For those interested the one player who was called up in April was drafted in the January draft, his name was Dick Ruthven, and the Philadelphia Phillies called him up April 17th 1973.
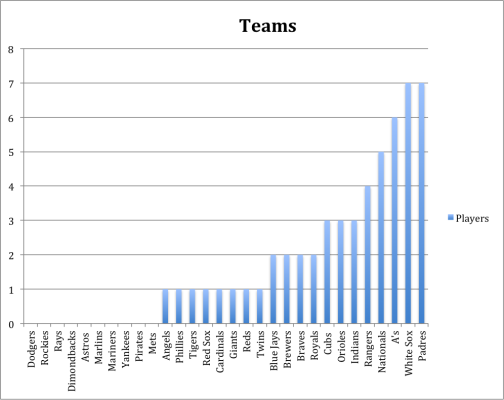
What might be even more interesting is that not only was Dick Ruthven the only player who was called up in April; he was the only players who was ever called up by the Phillies (The same year he was drafted). The Phillies though are not the only team who are squeamish about this strategy. In fact, there are 10 teams who have never called up a player the same year he was drafted. Below are the results.

As you can see the Padres and White Sox seem to be the ones who feel most comfortable promoting a player so early in his development process. That being said, while I have described this as a “strategy” earlier on, this is probably just statistical noise. It’s not like there’s a team or a few teams that are doing this a lot more than other teams. If I had to venture a hypothesis, I would guess that teams probably make the decision to promote someone so quickly, based on need and how advanced the player already is in his development. Personally, however, I would be hesitant to do so in fear that it might affect the player in the long run. For example, he might come up to the majors earlier than he should and therefore will not be able to develop into the player he could have been in the minors.
So now I’ll look to answer my final question and that’s how being promoted the first year a player is drafted affect his career production?
For this I looked at the average of all the player’s career stats. Again splitting the position players and pitchers. I wanted to see if these players ended up having successful careers.
| Pitchers (Career) | |||
| MLB Games | Innings | ERA+ | WARP |
| 223.52 | 872.53 | 94.73 | 5.93 |
| Position Players (Career) | |||
| MLB Games | PA | wRC+ | WAR |
| 961.58 | 3575.17 | 89.58 | 15.43 |
This time it looks like the position players were more successful than the starters, which was surprising to me. Maybe, it has something do to with the sample size, but I would have either way expected the pitchers to be better.
These career statistics also don’t leap off the screen. These are not superstars, for the most part, but seem to be serviceable Major League players. To me that’s a definite success. It’s a successful draft pick and it shows that the promotion doesn’t overly affect the players. (Of course I’m speaking generally here, I have no way of knowing if it affected a particular player.) This might be a controversial or surprising statement to some but the fact remains that most players who get drafted simply don’t make it to the Major Leagues, let alone have any semblance of a career. The fact that the position players, on average participate in 961.58 games shows that on average they’ve had a respectable career. The same thing goes for the pitchers. While being in 223.52 games might not seem like a lot, that’s more than an entire season’s worth of baseball, which most minor leaguers would kill to have.
Statistics were found at Baseball Prospectus, FanGraphs, and Baseball Reference.
The database for players making it to the majors the same year they were drafted was found at The Baseball Cube, which is a great website where a lot of good research can be done.
Julien Assouline is a journalism student at Ryerson University, and writes for Baseball Prospectus Milwaukee. Follow him on Twitter @JulienAssouline.
Monsieur, you are doing a fine job with these articles. Tres bon!
!
Thnx Jim!
So, who was the best player? I am thinking Dave Winfield, selected and promoted by the Padres in 1973.
Ya for position players its Dave Winfield (59.9) WAR, if we go by WAR to measure. For pitchers its Greg Swindell (26.1 WARP)