The Complex Problem of Tampa Bay Baseball Distances and Demographics

A few days ago on Baseball Prospectus, Rian Watt wrote a piece entitled “What Comes After Sabermetrics?“. In his article, Watt discusses the next era of baseball writing and speculates that exploring the social side of baseball will rise in prominence. The next generation of great baseball writers will be those who link baseball to social sciences — from politics to people. It will be the human side of America’s Pastime.
Social understanding is not only important for storytelling; it can also lead to interesting analysis. Social understanding helps us realize who people root for and why, as well as explains many of the not-so-obvious factors affecting fandom. Whereas statistical analysis can assist in complicated problems within the structured game, social analysis can help in off-the-field complex problems such as marketing and fan base development.
Which leads us to perhaps the most complex problem in sports marketing today: the fan base of the Tampa Bay Rays.
Last year, I wrote a piece on FanGraphs that discussed a major reason why the Rays struggle with attendance. My conclusion was that the amount of fans living near the ballpark had a huge impact on a team’s weekday attendance. The Rays were dead last in MLB in local population and had the widest difference between weekday and weekend attendance. In 2014, the Rays averaged 14,297 fans Monday through Thursday. On Friday through Sunday, with fans given more time to get to ballpark, their attendance increased 51.7% to 21,692.
In 2015, the Rays again struggled to draw fans during the week. Last season, however, their difficulties at the gate extended to the weekend, specifically Fridays (only 14,887 fans per game). Still, their difference remained well over the 2014 MLB average weekend/weekday difference of 20% and far above the Giants’ weekend/weekday difference of 0%.
- Mon-Thurs average attendance: 12,688
- Fri-Sun average attendance: 18,328
- Increase: 30.7%
Since my last article, I have continued to research the complexities of the Tampa Bay baseball market. With the team finally able to explore the region for a possible new stadium location, I want to know if a new stadium is going to matter. Is the amount of money taxpayers are inevitably going to spend worth the trouble? Will the Rays see an increase in attendance if they build a stadium in Tampa or on east side of Pinellas County? If we are sure the Tropicana Field site is wrong, which of the front-running locations is better?
And what about some of the other social variables? It is a well-established fact that Florida has a high amount of non-natives. In 2012, only 36% of people living in Florida were born in Florida. We can probably assume that number is higher in the metro areas and lower in the rural regions. The Tampa Bay area, for example, has a high population of people from New York and other Northeast states.
According to the New York Times, 50,000 New Yorkers a year move to Florida. According to the Tampa Tribune, roughly 10% of those move to Hillsborough, Pinellas, and Pasco Counties — the Tampa Bay area.
That’s 5,000 New Yorkers a year moving to Tampa Bay. If 50% are baseball fans, that’s 2,500 fans per year not rooting for the local team. In the case of the Yankees, these fans are rooting directly against the local team. With a metro population of 2.8 million, that’s a nearly 1% increase per year in opposing fans moving to the area. So any research we do has to keep that population in mind.
In order to attempt to untangle the complex mess that is the Tampa Bay baseball market, I’ve started to deep-dive into census data, distances, and fan preferences. For population I use census.gov; for distance I use Google Maps; and for fan preference, I use the New York Times/Facebook 2014 interactive map of baseball fandom.
Currently, the Tampa Bay area has 239 zip codes assigned. Here are the 11 most populated:
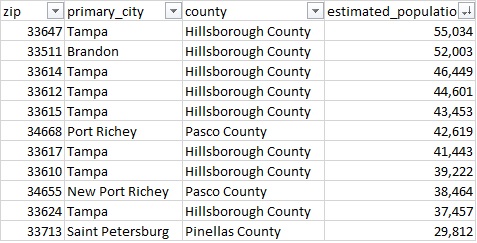
The reason the list goes to 11 is not just a Spinal Tap reference — it is because the 11th-most populated zip code is the current location of Tropicana Field and the only Pinellas County mention on the list. If I were to extend the list to 12 we would see one additional Pinellas County entry. However, number 12, zip code 34698, is Dunedin, Florida, spring-training home of the Toronto Blue Jays. So we will keep the list to 11.
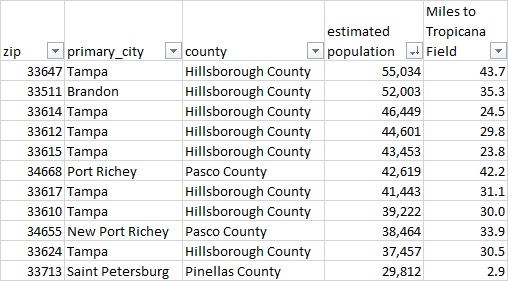
Unfortunately, as you can probably guess, none of the top 10 are near Tropicana Field. As a matter of fact, the average distance from the center of the 11 most populated zip codes to Tropicana Field is 29 miles.
On my site, I’ve written how the four minor-league teams in the Tampa Bay are a closer Mon-Thurs alternative for baseball fans in the Tampa Bay area. They are not only cheaper, but also more convenient. Here are the average distances of the 11 most populated zip codes to Steinbrenner Field (Tampa Yankees), Bright House Field (Clearwater Threshers), Florida Auto Exchange Stadium (Dunedin Blue Jays), and McKechnie Field (Bradenton Marauders).
- Avg distance to Steinbrenner Field: 16.5 miles
- Avg distance to Bright House Field: 24.2 miles
- Avg distance to Florida Auto Exchange Stadium: 27.3 miles
- Avg distance to McKechnie Field: 49.6 miles
Turning to the social aspect, we next add the Facebook “like” data to our chart. Here we see the Rays don’t have an overwhelming amount of fans anywhere in Tampa Bay area. Even in the Tropicana Field zip code less than 60% of baseball fans root for the home team, although 33713 does have the lowest percentage of Yankees fans on the list.
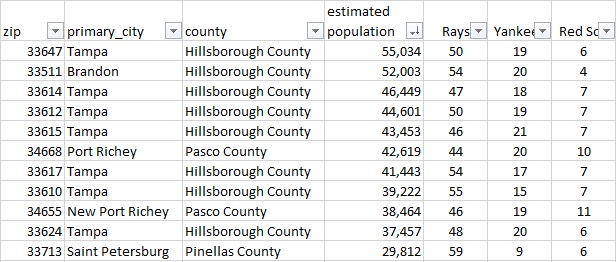
By comparison, in the similarly-sized Pittsburgh area, 70-75% of fans are Pirates fans and Yankees fans are roughly 5-7%. There are nearly 3x more people rooting for the Yankees in Tampa Bay than in Pittsburgh. Granted there is a longer tradition of rooting for one team in Pittsburgh, but that culture is easier to develop when there is only one team in the area.
So will building a new stadium help the Rays? Here is the population chart with the Rays fandom and distances to two front-running new stadium locations: Toytown and the Tampa Park Apartments.
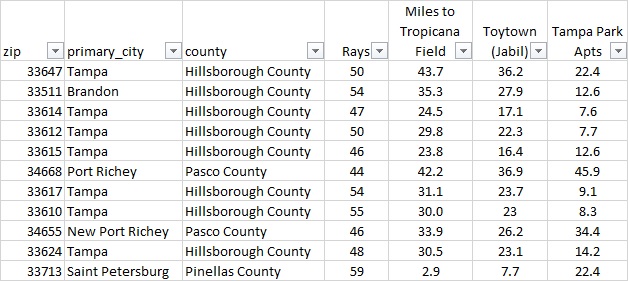
By average, the Tampa Park Apartments location is 12 miles closer to the top 11 populated zip codes. The Toytown location splits the difference.
- Avg distance to Tropicana Field: 30 miles
- Avg distance to Toytown: 24 miles
- Avg distance to Tampa Park Apartments: 18 miles
Both the Tampa Park Apartments and the Toytown location have another advantage the Tropicana Field location doesn’t have: both are within 15 miles of Steinbrenner Field and Bright House Field, meaning territorial rights can be exercised. While the MLB team has priority and can force the MiLB team to move, doing so might require compensation. For the Rays, removing the competition might be worth the extra cost, even if means paying the high ransom of a division rival.
(Note: territorial rights does not apply to Spring Training currently. If I was the Rays, I would fight that based on the precedence set by the Yankees and Orioles, who moved out of the Miami area before the Marlins began play in South Florida. I would also claim lost local revenue to Spring Training competition. Local fans who go to Steinbrenner Field could just as easily wait a month to see the Yankees at Tropicana Field.)
After a new stadium is built, after the competition is cleared out, and after the Rays have a monopoly of their small market, then they can finally attempt to win the hearts and minds of the region as other small-market teams do.
Rian Watt is absolutely correct. Social understanding is the next great baseball unknown. Knowing the story of fans, where they live, and what motivates them to support teams will be essential as we move from solving baseball’s complicated problems to finding solutions to its most complex problems.