Archive for Research

Combining Arsenal Scores and Stuff to Evaluate Pitcher Performance

Introduction

The Arsenal score is a metric which can examine how effective a pitch currently is, or how effective it could be. This metric is compiled from z-scores (a statistical measure of how far above, or below the mean a specific value is) of ground ball and swinging-strike rates (Sarris, 2016). Eno Sarris put this metric together to see which players might be on the verge of a breakout, should they figure out control issues, improve their fitness and last longer in games. Eno has used the Arsenal score to rank pitchers from the 2015 season, proposing that pitchers like Chad Bettis, Rich Hill, and Raisel Iglesias are on the verge of a breakout.

My colleague Dan and I built the Stuff metric for a couple of different reasons. The first, and yet to be completed, was to look at how a pitcher’s stuff could influence their risk of injury. The second was for a similar reason as to the development of the Arsenal score – how can we possibly find players who have electric “stuff”, yet are a mere tweak away from major-league success. The Stuff metric is developed in a similar fashion to the Arsenal score – we look at the z-scores of a pitcher’s velocity, change of velocity, velocity of breaking pitches, and amount of break (Sonne & Mulla, 2015). However, unlike the Arsenal score, we have no indication as to how these pitchers are influencing the hitter – if they are causing swings and misses, or if they are inducing ground balls. In a sense, this is a weakness of the Stuff metric compared to the Arsenal scores, but it could possibly be used sooner than the Arsenal score – as minor-league parks install PITCHf/x systems and other tools for measuring pitch movement and velocity. Using the Stuff metric, we’ve proposed possible 2016 breakout pitchers like Chris Bassitt and Mike Foltynewicz.

These two metrics try to get at similar answers, but go about it in a different manner. For this analysis, I wanted to see how these two metrics could be combined to predict pitcher success.

Methods

I used the Stuff metric calculated for 2015 pitchers (found here) and the Arsenal scores for pitchers in 2015 (found here). In both evaluations, a pitch had to be thrown 100 times to be eligible for further analysis. In total, 138 different pitchers were included in this analysis. To see how both new pitching metrics performed (Arsenal scores and Stuff), I calculated the R2 between the metric and ERA, xFIP, K/9, and WAR. These result values were obtained from FanGraphs. To see how the combined metrics worked to predict pitcher performance, I used a multiple regression analysis, and developed separate equations for each of the FanGraphs result values, using the sum of Arsenal scores and Stuff value as inputs.

For further analysis of the combined metric model, the difference between predicted values and actual values was calculated for ERA, xFIP, and K/9. This analysis did not include WAR, as to allow for equal comparison between players who played different numbers of games.

Results

Model Performance

In general, the Arsenal score was a better predictor of pitcher performance than Stuff. Arsenal scores had higher R2 values when predicting xFIP, WAR and K/9, with Stuff having a slightly higher R2 value for ERA (Table 1). The new combined model was a better predictor than either metric alone, with the greatest improvement seen for WAR (an 11% increase in explained variance compared to a single input variable).

The combined Arsenal-Stuff model performed the best when predicting xFIP (accounting for 46% of the variance in xFIP). Predicted vs. actual values can be found in figure 1 for all result variables.

Table 1. R2 values between the input variables of Stuff / Arsenal Score, and result values of ERA, K/9, WAR, and xFIP. R2 values are also presented for the combined model, which uses both Arsenal Score and Stuff as an input.

  ERA K9 WAR xFIP
Stuff 0.14 0.17 0.27 0.13
Sum Arsenal 0.12 0.37 0.33 0.44
Combined Model 0.19 0.41 0.44 0.46

stuff and arsenal

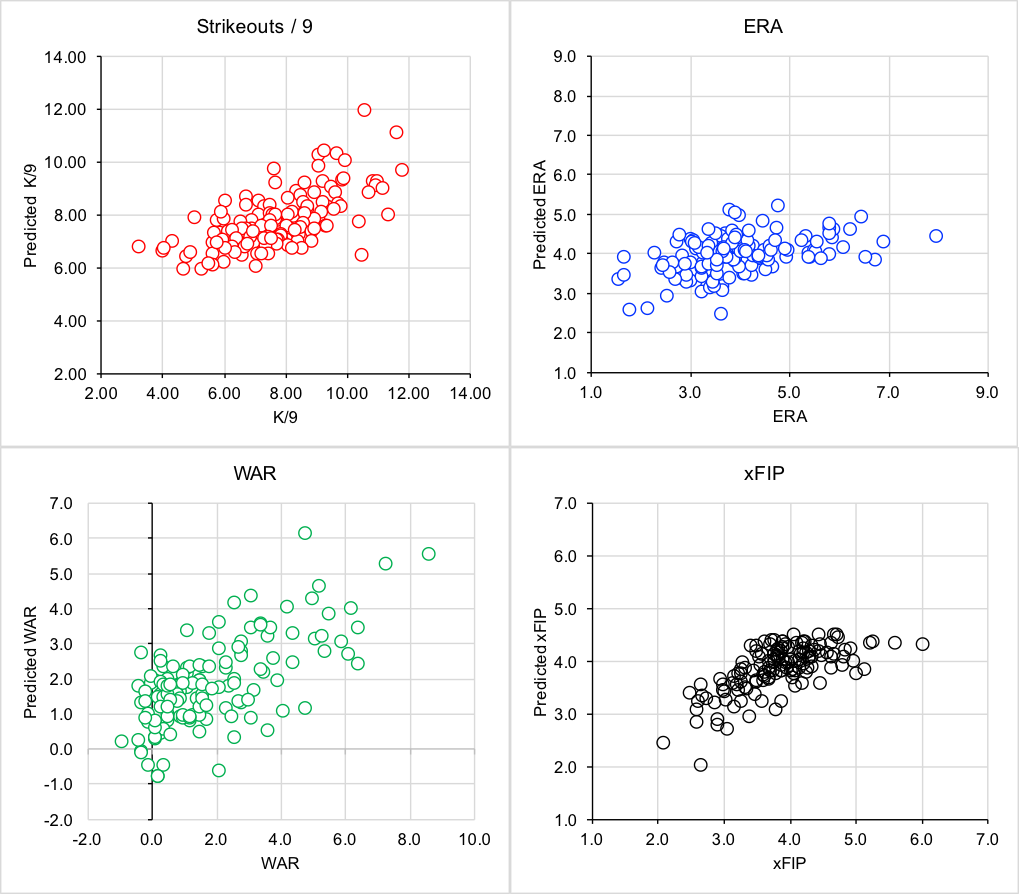
Figure 1. Relationships between predicted K/9, ERA, WAR, and xFIP and actual values. All predicted values are determined from a model that uses both Arsenal scores and the Stuff metric.

Player Identification

As a post-hoc analysis, I calculated the difference between predicted values and actual values. For ERA and xFIP, a lower value indicated the player’s predicted ERA or xFIP was lower than their actual results, which, could indicate that the player may perform better in 2016. A higher value may indicate that the pitcher may not have as favourable of results in 2016. The analysis is the opposite for K/9 – with higher values indicating that the pitcher should be expected to strike out more batters in 2016.

Table 2. The top 10 and bottom 10 predicted ERA errors. The top 10 represents pitchers who can be expected to have better results in 2016, with the bottom 10 predicted to perform with less success in 2016.

  Rank Pitcher ERA Difference Predicted ERA ERA Arsenal Score Stuff
Room for Improvement 1 Chris Capuano -0.80 4.44 7.97 0.19 -0.62
2 Bud Norris -0.74 3.85 6.72 1.15 0.81
3 Keyvius Sampson -0.67 3.92 6.54 0.11 0.89
4 Hector Noesi -0.61 4.28 6.89 -2.06 0.41
5 Carlos Carrasco -0.48 2.45 3.63 14.33 1.43
6 David Hale -0.47 4.15 6.09 2.36 -0.35
7 Archie Bradley -0.46 3.97 5.80 1.51 0.38
8 Matt Garza -0.45 3.88 5.63 -0.92 1.25
9 Matt Moore -0.38 3.92 5.43 0.90 0.66
10 Michael Lorenzen -0.38 3.90 5.40 -0.59 1.10
Due for Regression 121 Jerad Eickhoff 0.29 3.76 2.65 2.05 0.85
122 Josh Tomlin 0.31 4.36 3.02 0.90 -0.58
123 Jake Arrieta 0.31 2.56 1.77 7.22 2.95
124 Jaime Garcia 0.33 3.63 2.43 4.14 0.67
125 David Price 0.34 3.70 2.45 1.61 1.11
126 Dallas Keuchel 0.34 3.76 2.48 6.04 -0.19
127 Brandon Morrow 0.36 4.28 2.73 -1.89 0.37
128 John Lackey 0.38 4.46 2.77 -2.30 -0.04
129 Steven Matz 0.44 4.02 2.27 1.02 0.36
130 Zack Greinke 0.52 3.45 1.66 3.04 1.48

Table 3. The top 10 and bottom 10 predicted xFIP errors. The top 10 represents pitchers who can be expected to have better results in 2016, with the bottom 10 predicted to perform with less success in 2016.

  Rank Pitcher xFIP Difference Predicted xFIP xFIP Arsenal Score Stuff
Room for Improvement 1 Allen Webster -0.40 4.30 6.02 -0.95 -0.95
2 Archie Bradley -0.34 3.85 5.15 1.51 0.38
3 Henry Owens -0.33 3.77 5.01 1.93 0.62
4 Carlos Carrasco -0.32 2.02 2.66 14.33 1.43
5 Hector Noesi -0.30 4.33 5.61 -2.06 0.41
6 Jarred Cosart -0.25 3.57 4.46 3.15 0.99
7 Keyvius Sampson -0.24 3.99 4.97 0.11 0.89
8 Garrett Richards -0.24 3.06 3.80 6.44 1.69
9 Matt Moore -0.23 3.91 4.81 0.90 0.66
10 Chi Chi Gonzalez -0.21 4.36 5.26 -1.98 0.00
Due for Regression 121 Chris Sale 0.15 3.08 2.60 6.49 1.49
122 Joe Blanton 0.16 3.56 3.01 3.99 -0.15
123 Jose Quintana 0.16 4.18 3.51 -0.91 0.33
124 Dallas Keuchel 0.16 3.29 2.75 6.04 -0.19
125 Tyler Duffey 0.16 4.35 3.64 -2.35 0.56
126 Clay Buchholz 0.17 3.98 3.30 0.40 0.57
127 Brett Anderson 0.18 4.29 3.51 -2.10 0.92
128 Jose Fernandez 0.19 3.24 2.62 5.38 1.33
129 Michael Pineda 0.19 3.65 2.95 3.07 0.26
130 Stephen Strasburg 0.20 3.35 2.69 4.40 1.61


Table 4. The top 10 and bottom 10 predicted K/9 errors. The top 10 represents pitchers who can be expected to have better results in 2016, with the bottom 10 predicted to perform with less success in 2016.

  Rank Pitcher K9 Difference Predicted K9 K9 Arsenal Score Stuff
Room for Improvement 1 Tyler Wilson 0.52 6.76 3.25 -0.76 -0.55
2 Chi Chi Gonzalez 0.39 6.61 4.03 -1.98 0.00
3 Jose Urena 0.39 6.70 4.09 -1.99 0.24
4 Cody Anderson 0.38 7.01 4.34 -0.47 -0.12
5 Scott Feldman 0.36 7.91 5.07 1.52 0.71
6 Jarred Cosart 0.29 8.49 6.07 3.15 0.99
7 Aaron Sanchez 0.26 8.09 5.95 1.25 1.37
8 Archie Bradley 0.25 7.78 5.80 1.51 0.38
9 Kyle Ryan 0.25 6.39 4.79 -0.85 -1.42
10 Allen Webster 0.25 6.54 4.94 -0.95 -0.95
Due for Regression 121 Stephen Strasburg -0.20 9.10 10.96 4.40 1.61
122 Chris Archer -0.21 8.83 10.70 3.77 1.39
123 Tyler Duffey -0.22 6.72 8.22 -2.35 0.56
124 Chris Sale -0.22 9.66 11.82 6.49 1.49
125 Ian Kennedy -0.23 7.55 9.30 0.18 0.79
126 Vincent Velasquez -0.24 7.55 9.38 -0.11 1.00
127 Nate Karns -0.27 7.01 8.88 -1.35 0.54
128 Lance Lynn -0.28 6.70 8.57 -2.27 0.45
129 Drew Smyly -0.34 7.75 10.40 2.16 -0.17
130 John Lamb -0.62 6.49 10.51 -2.09 -0.24

Discussion

This new model which incorporates both the Stuff metric and the Arsenal score improves predictions of ERA, xFIP, K/9 and WAR. By combining both of these metrics, the new model incorporates both the action of a pitch, plus the ability of a pitcher to induce swings and misses and ground balls.

Examining the player rankings to determine which pitchers are both under-performing and over-performing based on the new model’s predictions, there are some interesting names that show up. Carlos Carrasco appears to be due for improvement based on ERA and xFIP. Matt Moore is slowly returning from injury, but could see improvements in 2016 based off of his Stuff and Arsenal scores.

While pitchers like Zack Greinke, David Price, and Dallas Keuchel appear on the list of pitchers who could see regression in 2016, this is more due to the fact that they had otherworldly, perhaps outlier seasons, than it is a commentary on them pitching above their ability. Zack Greinke has gone on the record saying that his 2015 season was an outlier, and “that he may not actually be that good (Rodgers, 2016)”.  For Blue Jays fans, it is exciting to see how Aaron Sanchez’s stuff predicts he will have a better K/9 next season – though it’s to be seen whether he will pitch as a starter or reliever.

This model, much like the previous evaluations of Stuff and Arsenal scores, does not factor in control, deception or pitch sequencing. While model performance is strong, there is room for improvement of greater than 50% of explained variance. Pitching is complicated, and to achieve better predictions, models will need to grow increasingly complicated.

Conclusion

The combined Stuff/Arsenal score model improves predictions of ERA, xFIP, K/9 and WAR over the individual metrics on their own. This model was used to identify possible candidates for improvement and regression in the 2016 season. Future work should include a variety of more complicated measures to account for control, deception and additional game factors.

References

Rogers, J., 2016.  Zack Greinke on furthering his 2015 domination: ‘I’m probably not that good’. Retrieved from:

http://www.sportingnews.com/mlb-news/4695603-zack-greinke-stats-diamondbacks-projection-cy-young-chances, on February 21, 2016.

Sarris, E., 2016. The Change: Arsenal Scores. Retrieved from: http://www.fangraphs.com/fantasy/the-change-arsenal-scores/, on February 2, 2016.

Sonne, M.W., and Mulla, D., 2015. Revisiting the “Stuff” Metric. Retrieved from http://www.mikesonne.ca/baseball/22/, on December 21, 2016.

Additional Information

Difference between predicted and actual values – all pitchers included in the analysis.


Will Upton, Zimmermann and an Improved Bullpen Be Enough for Detroit?

Justin Upton is a star outfielder, and recently he has joined fellow sluggers Miguel Cabrera, J.D. Martinez, and Victor Martinez on the Detroit Tigers. However, will pure offense be enough to fuel the Tigers’ run at the AL Central? Looking at the Central, there are many strengths and plenty of weaknesses for all five teams. For starters, the Tigers appear to be greater offensively than any other team. Upton, Cabrera, J.D. and Victor Martinez have all combined for 202 HR since 2014, meaning they each averaged approximately 50 HR each over the last two seasons.  The four sluggers also have a combined WAR of 28.4 over the last two seasons as well. Upton, despite being a major factor in that group (7.6 WAR, 55 HR since 2014) has struggled greatly against the American League over the last three seasons. Over the last three seasons Upton has played a total of 58 games against the AL, and in that time he has managed a miserable .205/.262/.338 slash line. His BABIP is a meager .252 over that stretch, and his OPS is just .600. It goes without saying that one of the bigger question marks for the Tigers will be whether or not Justin Upton will be able to adjust to American League pitching.

Ultimately, the Tigers offense should be solid, and the potential is there for it to be among the best in all of baseball. Upton should be a decent addition, however he needs to find a way to jump out of his three-season slump against the AL. That could prove very difficult. For starters, he will have to face the likes of Corey Kluber, Carlos Carrasco, Danny Salazar, Chris Sale, and Carlos Rodon at least a handful of times in the AL Central. Those five are just the tip of the iceberg, since the Central features several other solid pitchers as well. Not to mention the strong bullpens possessed by both the Royals and Indians (2.72 ERA and 3.12 ERA respectively; 1st and 2nd in the AL).

Sticking with pitching, the Tigers still have big question marks in their own pitching staff. The Tigers were the 28th-ranked pitching staff overall in terms of ERA. The biggest question for the Tigers pitching staff is whether or not Justin Verlander can return to his previous self. Verlander improved a bit last season. In 15 starts after the All-Star Break, Verlander posted a 2.80 ERA, with a 4.5 K/BB ratio, and a 1.00 WHIP. Verlander will be extremely helpful to — potentially — another Detroit postseason run if he can continue with his recent trend. This does not solve the rest of the rotation’s problems, and the Tigers will need great performances from young pitching talent Daniel Norris, a bounce-back season from Anibal Sanchez, and at least some solid outings from veteran Mike Pelfrey. Pelfrey has been less than stellar his last three seasons; in 64 starts he has posted a record of 11-27 with an ERA of 4.94. Sanchez was nowhere near himself in 2015, as he posted a miserable 4.99 ERA, averaged 1.7 HR/9, and had an FIP of 4.73. Compared to his outstanding seasons in 2013 and 2014 (where he had a combined ERA of 2.92, and averaged just 0.4 HR/9) Sanchez was a completely different pitcher. The one bright spot, perhaps, is newcomer Jordan Zimmermann. Zimmermann was not quite as sharp in 2015 as he has been previously in his career, but he’s still an extremely solid addition nonetheless. Hopefully for Detroit he can return to his previous form, as he was dominant in 2013 and 2014 going 33-14, with a 2.96 ERA and a 5.0 K/BB ratio.

Quite possibly the most important upgrade the Tigers made was to their bullpen. Last season the Detroit bullpen was less than stellar, posting a 4.38 ERA, 1.44 WHIP, and a meager 1.95 K/BB ratio. There was no argument needed to show that their bullpen was clearly the worst in the AL Central. However, the 2016 outlook looks a lot brighter. The Tigers brought in Mark Lowe, Francisco Rodriguez, and Justin Wilson to bolster their ranks. Combined, the trio posted a 2.44 ERA and 1.02 WHIP in 2015 (K-Rod also had 38 saves in 40 opportunities). It goes without saying that these three will be a big boost to an otherwise abysmal bullpen.

2016 will be a defining year for the Tigers. Will their offense really be all that it seems? Will the bullpen be good enough to keep them in games? Can Verlander and Zimmermann carry the starting rotation? Will Anibal Sanchez be able to bounce back? Will Justin Upton be able to adjust to the American League? All these questions will be answered soon enough. Detroit has quite a bit of talent and for their sake everything needs to work like a clock if they want to have any chance at contending for the Central title and make another pennant run.


Hardball Retrospective – The “Original” 1980 Houston Astros

In “Hardball Retrospective: Evaluating Scouting and Development Outcomes for the Modern-Era Franchises”, I placed every ballplayer in the modern era (from 1901-present) on their original team. Consequently, Joe Cronin is listed on the Pirates roster for the duration of his career while the Senators II / Rangers declare Bill Madlock and the Rays claim Aubrey Huff. I calculated revised standings for every season based entirely on the performance of each team’s “original” players. I discuss every team’s “original” players and seasons at length along with organizational performance with respect to the Amateur Draft (or First-Year Player Draft), amateur free agent signings and other methods of player acquisition.  Season standings, WAR and Win Shares totals for the “original” teams are compared against the “actual” team results to assess each franchise’s scouting, development and general management skills.

Expanding on my research for the book, the following series of articles will reveal the finest single-season rosters for every Major League organization based on overall rankings in OWAR and OWS along with the general managers and scouting directors that constructed the teams. “Hardball Retrospective” is available in digital format on Amazon, Barnes and Noble, GooglePlay, iTunes and KoboBooks. The paperback edition is available on Amazon, Barnes and Noble and CreateSpace. Supplemental Statistics, Charts and Graphs along with a discussion forum are offered at TuataraSoftware.com.

Don Daglow (Intellivision World Series Major League Baseball, Earl Weaver Baseball, Tony LaRussa Baseball) contributed the foreword for Hardball Retrospective. The foreword and preview of my book are accessible here.

Terminology

OWAR – Wins Above Replacement for players on “original” teams

OWS – Win Shares for players on “original” teams

OPW% – Pythagorean Won-Loss record for the “original” teams

Assessment

The 1980 Houston Astros          OWAR: 63.9     OWS: 352     OPW%: .598

GM Spec Richardson acquired 53% (16/30) of the ballplayers on the 1980 Astros roster. Based on the revised standings the “Original” 1980 Astros rocketed to the pennant by an eighteen-game margin. Houston topped the National League in OWS and OWAR.

Cesar Cedeno supplied a .308 BA, rapped 32 doubles and stole 48 bases to spark the ‘Stros offense. Terry Puhl belted a career-high 13 circuit clouts and contributed 27 steals. Mike Easler finally broke into the lineup after five seasons as a bench player. The “Hit Man” responded with a .338 BA, 21 jacks and a .583 SLG. Joe L. Morgan pilfered 24 bags and topped the League with 93 bases on balls. John Mayberry slammed 30 round-trippers and plated 82 baserunners. Bob Watson contributed a .307 BA with 25 two-base knocks. Rusty Staub delivered a .300 BA with 23 doubles in a platoon role.

Joe L. Morgan leads the All-Time Second Basemen rankings according to Bill James in “The New Bill James Historical Baseball Abstract.” Teammates listed in the “NBJHBA” top 100 rankings include Cedeno (21st-CF), Staub (24th-RF), Watson (33rd-1B), Mayberry (49th-1B) and Puhl (86th-RF).

LINEUP POS WAR WS
Joe L. Morgan 2B 1.91 21.43
Terry Puhl RF 3.35 23.02
Cesar Cedeno CF 3.91 26.47
Mike Easler LF 3.49 21.51
Bob Watson 1B 2.62 16.86
Derrel Thomas SS 0.32 8.8
Stan Papi 3B 0.07 2.41
Bruce Bochy C 0.04 0.4
BENCH POS WAR WS
Rusty Staub DH 1.13 10.1
John Mayberry 1B 0.79 16.26
Danny Heep 1B 0.04 2.64
Danny Walton DH 0.01 0.14
Scott Loucks RF 0.01 0.07
Alan Knicely -0.01 0
Cliff Johnson DH -0.07 7.19
Greg Gross LF -0.07 3.27
Fred Stanley SS -0.25 1.01
Glenn Adams DH -0.58 4.11
Joe Cannon LF -0.7 0.35
Luis Pujols C -1.83 1.97

J.R. Richard was selected to the National League All-Star team in 1980 with a 10-4 record and a 1.90 ERA following successive seasons with 300+ strikeouts and an ERA title in 1979. Less than a month later, the Astros ace suffered a stroke prior to a ball game. Despite a valiant comeback attempt, Richard never appeared in another Major League game.

Floyd Bannister (9-13, 3.47) and Ken Forsch (12-13, 3.20) provided quality innings in the starting rotation. The relief staff featured southpaws Tom Burgmeier and Joe Sambito along with right-handers Dave S. Smith and Tom Griffin. Burgmeier fashioned a 2.00 ERA with a 1.081 WHIP and saved 24 contests while making his lone All-Star appearance. Sambito delivered a record of 8-4 with 17 saves, a 2.19 ERA and a WHIP of 0.963. Smith (1.93, 10 SV) contributed 7 victories and placed fifth in the 1980 NL ROY balloting. Griffin furnished a 2.76 ERA and a 1.198 ERA, primarily in long relief.

ROTATION POS WAR WS
Floyd Bannister SP 3.87 14.75
J. R. Richard SP 3.3 11.59
Ken Forsch SP 3.14 12.58
Gordie Pladson SP -0.27 0.18
BULLPEN POS WAR WS
Tom Burgmeier RP 2.94 17.55
Dave S. Smith RP 2.45 12.89
Tom Griffin RP 1.69 8.58
Joe Sambito RP 1.49 14.49
Bert Roberge RP -0.68 0
Mike T. Stanton RP -1.21 1.71

The “Original” 1980 Houston Astros roster

NAME POS WAR WS General Manager Scouting Director
Cesar Cedeno CF 3.91 26.47 Spec Richardson
Floyd Bannister SP 3.87 14.75 Tal Smith
Mike Easler LF 3.49 21.51 Spec Richardson
Terry Puhl RF 3.35 23.02 Spec Richardson Lynwood Stallings
J. R. Richard SP 3.3 11.59 Spec Richardson
Ken Forsch SP 3.14 12.58 Spec Richardson
Tom Burgmeier RP 2.94 17.55 Paul Richards
Bob Watson 1B 2.62 16.86 Paul Richards
Dave Smith RP 2.45 12.89 Tal Smith
Joe Morgan 2B 1.91 21.43 Paul Richards
Tom Griffin RP 1.69 8.58 Tal Smith
Joe Sambito RP 1.49 14.49 Spec Richardson Lynwood Stallings
Rusty Staub DH 1.13 10.1 Paul Richards
John Mayberry 1B 0.79 16.26 Tal Smith
Derrel Thomas SS 0.32 8.8 Spec Richardson
Stan Papi 3B 0.07 2.41 Spec Richardson
Bruce Bochy C 0.04 0.4 Spec Richardson John Mullen
Danny Heep 1B 0.04 2.64 Tal Smith
Danny Walton DH 0.01 0.14 Paul Richards
Scott Loucks RF 0.01 0.07 Tal Smith
Alan Knicely -0.01 0 Spec Richardson Pat Gillick
Cliff Johnson DH -0.07 7.19 Tal Smith
Greg Gross LF -0.07 3.27 Spec Richardson
Fred Stanley SS -0.25 1.01 Tal Smith
Gordie Pladson SP -0.27 0.18 Spec Richardson Lynwood Stallings
Glenn Adams DH -0.58 4.11 Spec Richardson
Bert Roberge RP -0.68 0 Tal Smith
Joe Cannon LF -0.7 0.35 Spec Richardson Pat Gillick
Mike T. Stanton RP -1.21 1.71 Spec Richardson Lynwood Stallings
Luis Pujols C -1.83 1.97 Spec Richardson Lynwood Stallings

Honorable Mention

The “Original” 1973 Astros    OWAR: 54.8     OWS: 328     OPW%: .567

Houston topped the circuit in OWAR and squeezed past Cincinnati and Los Angeles to capture the National League title in 1973. Joe L. Morgan (.290/26/82) coaxed 111 bases on balls, registered 116 tallies and pilfered 67 bases. “Little Joe” placed fourth in the NL MVP race and earned his first Gold Glove Award. John Mayberry (.278/26/100) paced the circuit with 122 walks and a .417 OBP while Bob “Bull” Watson produced a .312 BA with 94 ribbies. Mayberry and Watson joined the All-Star ranks for the first time. Cesar Cedeno (.320/25/70) laced 35 doubles and swiped 56 bags in the midst of collecting five consecutive Gold Glove Awards (1972-76). Fellow five-time Gold Glove winner Doug “The Red Rooster” Rader launched 21 moon shots and knocked in 89 runs. Rusty Staub aka “Le Grand Orange” clubbed 36 two-baggers. Wayne Twitchell (13-9, 2.50) received an invitation to the Mid-Summer Classic and fellow hurler Don Wilson notched 11 victories with a 3.20 ERA and a 1.166 WHIP.

On Deck

The “Original” 1905 Giants

References and Resources

Baseball America – Executive Database

Baseball-Reference

James, Bill. The New Bill James Historical Baseball Abstract. New York, NY.: The Free Press, 2001. Print.

James, Bill, with Jim Henzler. Win Shares. Morton Grove, Ill.: STATS, 2002. Print.

Retrosheet – Transactions Database

Seamheads – Baseball Gauge

Sean Lahman Baseball Archive


Rookie Pitchers and the Strike Zone

So my question is, do rookie pitchers get a similar treatment from umpires with regard to called strikes as do veteran pitchers?

In order to evaluate this question, I first had to develop a strike zone to evaluate.  So using the PITCHf/x data from 2013, 2014, and 2015, I created a model of the strike zone which was broken down into tenth-of-a-foot increments and plotted the probability of a strike or ball being called when a pitch was thrown inside that range for all the balls and strikes looking over those three years.  I did separate strike zones for lefty hitters and righty hitters since umpires should have a slightly different perspective depending on the batter’s location.

The strike zones I arrived at are shown here:

Once the strike zones were determined, I was able to go through the PITCHf/x data and tag every pitch thrown which resulted in either a ball or called strike with the associated probability of a pitch in that location being called either a ball or strike.

This then allowed me to take any individual pitcher and calculate an average “strike” probability for his called strikes.  As an example, here were my 2015 top 10 pitchers in terms of average strike likelihood (minimum pitches of 750 that were either balls or called strikes).

pitcher # Called Strikes Strike Likelihood % (SL%)
Dallas Keuchel 650 73.0%
A.J. Burnett 483 74.1%
Francisco Liriano 495 75.1%
Jon Lester 568 75.7%
Jesse Chavez 475 76.0%
Lance Lynn 445 76.0%
Jeff Locke 495 76.0%
Gio Gonzalez 541 76.3%
John Danks 498 76.4%
Charlie Morton 361 76.4%

The lower the percent, the better. This means that on average when Dallas Keuchel got a called strike over the course of the entire season, that pitch was only likely to be called a strike 73% of the time. To show the impact this could have, Stephen Strasburg in 2015 had 402 called strikes; however, his Strike Likelihood% was 86.5%.

So if Strasburg threw a pitch into a zone where there was an 80% chance of that pitch being called a strike, he was unlikely to get that call, while if Keuchel or Jon Lester or Gio Gonzalez threw that same pitch they were very likely to get that call.

Strasburg is particularly interesting due to the fact that both him and Gio are on opposite sides of the spectrum, since the first thing that would jump out to you is catcher framing as part of the delta. Looking at the top 10 list from 2015 for example you notice a lot of Pirates and of course Francisco Cervelli was loved by the catcher-framing metrics this year.

But catcher framing shouldn’t really be a major issue in the evaluation of rookie versus veteran pitchers. It’s unlikely rookies wouldn’t be caught by the primary catcher.

My next step was to calculate the Rookie Strike Likelihood% for 2013, 2014 & 2015 and compare it to the Non-Rookie Strike Likelihood% for those same seasons to see if there was any “bias”. I set my minimum total balls + called strike total to the 1st quartile value for that season. Remember the lower the SL% the better — this means a pitch can be “worse” and still called a strike.

2015 (135 minimum)

Non-Rookie SL% – 81.1%

Rookie SL% – 82.1%


2014 (114 minimum)

Non-Rookie SL% – 82.1%

Rookie SL% – 82.4%


2013 (166 minimum)

Non-Rookie SL% – 82.0%

Rookie SL% – 83.1%


So while the gap is not always huge, there is in each year a delta in the SL% which favors the veteran pitchers.

What does this mean? This could mean nothing. It could be entirely due to rookies just not working the zone in the same way veterans do, or it could be related to the specific pitch selection (fastball vs. curve vs. slider) and how those different pitches are typically located in the zone. It could be related to how often rookies are ahead vs. behind in the count against batters and what that means for their next pitch location.

Then again, it could just mean that there is some bias against rookies where they don’t get a sort of “Jordan” impact where your reputation gets you a call that maybe you wouldn’t have gotten without it. In all likelihood it is a combination of both. But given that this seems to be a real thing, it could also be used in the evaluation, again, of catcher-framing metrics. Catchers who catch an abnormally high amount of rookies in a season could see their framing “skills” negatively impacted due to their counterparts alone and not a diminishing skill on their part.


Hard Contact Rate and Identifying Breakout Candidates

Sophomore year of high school, I was the statistician for the Junior Varsity baseball team. By that, I mean that I was not good enough to play and spent my bench time coming up with new ways to evaluate our players. But, JV baseball is a brave new world in terms of statistical analysis. Sample sizes are too small to properly determine much of anything, and fielding is so shoddy that offensive value is shockingly overestimated. So, I had to create an entire new suite of measurements.

I had a fair amount of data on contact quality, although it was subjectively assessed. But, I was able to cobble together some rate statistics to roughly determine hitting ability.

In doing research on MLB players, I thought that perhaps I could rely on my JV toolbox to identify top prospects. By simply multiplying “hard-hit rate” and “contact rate,” I am able to estimate the probability of a given swing resulting in hard contact. It neglects many factors, of course; for instance, contact in the zone may be more likely to result in a hard hit than contact elsewhere. But, this “hard contact rate” gives a reasonable approximation of the desired probability.

So, how does this statistic perform in evaluating players? Quite well, in fact. Looking at all qualified players in the 2015 season, there is a strong correlation between hard contact rate and wRC+.

So, hard contact rate is a fairly good predictor of overall offensive success. But, is it a repeatable skill? How consistent is it? To answer that question, let us look at the same qualified hitters in the two halves of the season.

View post on imgur.com

Once again, we see a relatively strong correlation. Although the sample size is not massive, it seems that hard contact rate stays more or less consistent. It is not subject to the constant fluctuations of something like batting average or BABIP. Thus, prospects with strong hard contact rates are likely to maintain that ability. As an indicator of offensive success, this statistic has proven quite strong.

In order to use hard contact rate to identify top prospects, we have to examine how it changes over time. Then, we can use the aging curve to spot those players who are performing better than their age mates. Here is that aging curve, drawn from all qualified hitters between 2011 and 2015.

Looking at players between the ages of 25 and 32, we see a clean curve predicting average hard contact rate over time. We must omit the players on either end of this 25-32 range, since that sample size is too small and characterized by exceptional players. There are not many league-average 21-year-olds, nor are there many under-performing 36-year-olds who still have a job.

But, we can still use the averages for those young players to identify truly exceptional talent. By filtering 2015 data to find players under the age of 23 whose hard contact rate is above average for a 23-year-old, we find the following list:

Harper, Machado, Sano, Correa, Schwarber, Bird, Conforto, Betts, and Odor.

Clearly, the system works to some degree.

I am particularly fond of the Odor pick. While he was a highly regarded prospect prior to his major-league debut, his freshman and sophomore seasons largely disappointed. However, I see a bit of Bryce Harper in him. Like his predecessor, true achievement is likely in his future; as the aging curve shows, hard contact rate peaks later in a player’s career than many other stats. Therefore, he is my pick for breakout candidate over the next few years.

By expanding this research, hard contact rates could be used to identify prospects and breakout candidates. I have yet to examine how the stat predicts success among minor leaguers, for instance.

In a future article, I will examine just that. Also in the pipe is an exploration of contact stats in predicting home runs. Whether or not hard contact rate holds up under further scrutiny remains to be seen.


Why Yoenis Cespedes Is a Better Center Fielder Than You Think

We all know the story: Yoenis Cespedes is a bad defensive center fielder.  In 912 career innings in center field, Cespedes has rated miserably in both Ultimate Zone Rating (UZR), with a -17.6 UZR/150, and Defensive Runs Saved (DRS), with a prorated -23.7 DRS/150.  Based on those metrics, he should continue to be an awful defensive center fielder in 2016, right?

Not necessarily.  Let’s use a few different methods to estimate Cespedes’ defensive value as a center fielder and determine how effective he will be in the future.

Method 1: Regress past defensive data in CF

This is the simplest (and crudest) method of all.  If we average Cespedes’ center field contributions per 150 games by UZR (-17.6) and DRS (-23.7), we find that Cespedes is a -20.85 run defender per 150 games.  Because of the small 900-inning sample, we’ll regress that by 50% and estimate that Cespedes is a -10.4 runs per 150 games defender in center.  This is what many people in the analytical community roughly believe Cespedes’ defensive value in center field to be. Methods 2 and 3, shown below, illustrate why I disagree with this valuation.

Method 2: Combine Cespedes’ Range in CF with his Arm Throughout the Outfield

One thing everyone can agree on with Cespedes: he has a cannon of an arm.  Whether he’s playing center field or left field, we should expect his arm to be significantly above average, right?

Well, in his 912 career innings in center field, UZR and DRS seems to disagree.  They rate his arm at -0.8 runs and +2 runs, respectively.  Decent, no doubt, but not the arm that most of us are accustomed to with Cespedes.

Yet, if we look at his entire career in the outfield, including time in both center field and left field, his arm has been worth +28 runs by DRS and +26.5 runs by UZR in roughly 4300 innings.  When averaged and scaled to 150 games, the value of his arm comes out to roughly +9.5 runs per 150 games over a very large sample, much more in line with what we would expect.

Next, we must factor Cespedes’ center-field range into the equation.  In 912 innings, DRS pegs his range (they term it rPM) at -17, while UZR estimates his range (they use RngR) at -12.2.  When averaged and scaled to 150 games, his range comes out to -20.4 runs per 150 games.  Because of the small 900-inning sample, we’ll once again regress his range by 50%, getting us to -10.2 runs per 150 games.

Factor in his arm, worth +9.5 runs per 150 games, and suddenly our estimate of Cespedes comes to -0.7 runs per 150 games in center field.  In other words: his excellent arm makes up for his poor range, making him a roughly league-average defensive center fielder.

Method 3: Isolate the Value of Cespedes’ Arm, Then Use Positional Adjustments to Estimate Cespedes’ Range in CF

This is the most complicated of the three methods.  First, we must become comfortable with the idea of positional adjustments.  Essentially, the purpose of positional adjustments is to provide a run value for each position, using past data of players switching positions to estimate the defensive difficulty of each position.  For example, while shortstop is a difficult position to play — and hence has a +7.5 run positional adjustment (per 162 games) — first base is not, with a -12.5 run positional adjustment.  Theoretically, if a shortstop was to switch to first base, the theory of positional adjustments would estimate a 20-run improvement in defense per 162 games.

Of course, positional adjustments don’t always work so conveniently, a reality the Red Sox discovered the hard way after moving Hanley Ramirez from shortstop to left field backfired tremendously.  Indeed, the difficulty of learning a new position oftentimes overshadows the theoretical improvement that should come from moving down the defensive spectrum.

In the outfield, however, things work much smoother, simply because each outfield position requires roughly the same skill-set: speed, first-step quickness, and efficient route running.  Using the positional adjustments from FanGraphs, we’d expect a left fielder (-7.5 run positional adjustment) to be approximately 10 runs worse in center field (+2.5).

For this exercise, we’ll isolate Cespedes’ arm from his range, using the +9.5 runs per 150 game figure we got from Method 2 to estimate the value of his arm (or +10.3 runs per 162 games).  Why?  For the most part, throwing arm strength is something we don’t expect to change too much shifting from left field to center.  The main difference between playing center field and left field is the range required for each position.

Estimating Cespedes’ range in center field using positional adjustments requires some tricky math.  First, let’s examine Cespedes’ range throughout his entire outfield career.  In 4295.33 innings combined between the two positions, Cespedes’ range is estimated at -13 runs by DRS (rPM) and -4.3 runs by UZR (RngR), or an average of -2.9 runs per 162 games (FanGraphs’ positional adjustments are scaled to 1458 innings, or 162 games).

Next, let’s calculate the percentage of his innings in left and center.  3383/4295.33 shows us that 78.76% of his innings came in left field, and, by extension, that 21.24% of his innings came in center.

Now, the tricky part: algebra. If “x” is his range in CF, “x+10” is his range in LF, and +10 is the positional adjustment per 162 games from LF to CF, we solve for x with the following formula:

0.2124 * x + 0.7876 * (x+10) = -2.9

Wolfram Alpha, what say you?

x = -10.8, or -10.8 range runs per 162 games in CF.

Now, factor in Cespedes’ +10.3 runs per 162 games from his arm, and you arrive at his defense being worth -0.5 runs per 162 games.  Just as in Method 2, it appears that the value of Cespedes’ throwing arm essentially counteracts his poor range, making him once again a roughly league-average defender in center

Method 4: Use Positional Adjustments to Estimate Cespedes’ Total Value in CF

While Methods 2 and 3 are certainly improvements over Method 1, there are some minor flaws in the methodology for each of the two methods. In Method 2, we arbitrarily regressed Cespedes’ range in CF by 50%, when in truth we don’t know exactly how much his range needs to be regressed.  In both Methods 2 and 3, we assumed that the value of Cespedes’ arm wouldn’t change significantly by moving from LF to CF, when in reality it may be more difficult to accumulate value via throwing as a center fielder.

To address these concerns, let’s do the same Method 3 Calculation except instead of attempting to find Cespedes’ range in CF, we’ll try and estimate Cespedes’ total value in CF, using nothing other than positional adjustments, UZR, and DRS. Rather than breaking down those metrics into their individual components, we’ll simply use the positional adjustments on the metrics themselves, a more traditional calculation.

First, let’s average Cespedes’ total DRS (15 runs) and UZR (20.7 runs) and scale it to 162 games, arriving at +6.1 runs per 162 games between left and center. Then, let’s do the same algebra we did in Method 3, with “x” representing his UZR/DRS in CF and “x+10” representing his UZR/DRS in LF.

0.2124 * x + .7876 * (x+10) = 6.06

We’ll head over to Wolfram Alpha one last time, with x = -1.8 runs per 162 games.

This might be the most accurate estimation of his value in CF of all, as it doesn’t rely on the raw value of his arm (like in methods 2 and 3) or a regressed version of his range in center (like methods 1 and 2).

Conclusion

Don’t believe the skeptics.  While Cespedes has rated terribly in roughly 900 innings of data in center field, it’s silly to limit yourself to such a small center field sample size when we have more than 4000 innings of data, separate range and arm ratings, and positional adjustments at our disposal.  Using some basic arithmetic, we’ve proven that Cespedes should probably be no worse than a hair below average defensively in center field, as his extremely valuable arm (+10.3 runs per 162 games) makes up for his below-average range.


The Complex Problem of Tampa Bay Baseball Distances and Demographics

A few days ago on Baseball Prospectus, Rian Watt wrote a piece entitled “What Comes After Sabermetrics?“. In his article, Watt discusses the next era of baseball writing and speculates that exploring the social side of baseball will rise in prominence. The next generation of great baseball writers will be those who link baseball to social sciences — from politics to people. It will be the human side of America’s Pastime.

Social understanding is not only important for storytelling; it can also lead to interesting analysis. Social understanding helps us realize who people root for and why, as well as explains many of the not-so-obvious factors affecting fandom. Whereas statistical analysis can assist in complicated problems within the structured game, social analysis can help in off-the-field complex problems such as marketing and fan base development.

Which leads us to perhaps the most complex problem in sports marketing today: the fan base of the Tampa Bay Rays.

Last year, I wrote a piece on FanGraphs that discussed a major reason why the Rays struggle with attendance. My conclusion was that the amount of fans living near the ballpark had a huge impact on a team’s weekday attendance. The Rays were dead last in MLB in local population and had the widest difference between weekday and weekend attendance. In 2014, the Rays averaged 14,297 fans Monday through Thursday. On Friday through Sunday, with fans given more time to get to ballpark, their attendance increased 51.7% to 21,692.

In 2015, the Rays again struggled to draw fans during the week. Last season, however, their difficulties at the gate extended to the weekend, specifically Fridays (only 14,887 fans per game). Still, their difference remained well over the 2014 MLB average weekend/weekday difference of 20% and far above the Giants’ weekend/weekday difference of 0%.

  • Mon-Thurs average attendance: 12,688
  • Fri-Sun average attendance: 18,328
  • Increase: 30.7%

Since my last article, I have continued to research the complexities of the Tampa Bay baseball market. With the team finally able to explore the region for a possible new stadium location, I want to know if a new stadium is going to matter. Is the amount of money taxpayers are inevitably going to spend worth the trouble? Will the Rays see an increase in attendance if they build a stadium in Tampa or on east side of Pinellas County? If we are sure the Tropicana Field site is wrong, which of the front-running locations is better?

And what about some of the other social variables? It is a well-established fact that Florida has a high amount of non-natives. In 2012, only 36% of people living in Florida were born in Florida. We can probably assume that number is higher in the metro areas and lower in the rural regions. The Tampa Bay area, for example, has a high population of people from New York and other Northeast states.

According to the New York Times, 50,000 New Yorkers a year move to Florida. According to the Tampa Tribune, roughly 10% of those move to Hillsborough, Pinellas, and Pasco Counties — the Tampa Bay area.

That’s 5,000 New Yorkers a year moving to Tampa Bay. If 50% are baseball fans, that’s 2,500 fans per year not rooting for the local team. In the case of the Yankees, these fans are rooting directly against the local team. With a metro population of 2.8 million, that’s a nearly 1% increase per year in opposing fans moving to the area. So any research we do has to keep that population in mind.

In order to attempt to untangle the complex mess that is the Tampa Bay baseball market, I’ve started to deep-dive into census data, distances, and fan preferences. For population I use census.gov; for distance I use Google Maps; and for fan preference, I use the New York Times/Facebook 2014 interactive map of baseball fandom.

Currently, the Tampa Bay area has 239 zip codes assigned. Here are the 11 most populated:

The reason the list goes to 11 is not just a Spinal Tap reference — it is because the 11th-most populated zip code is the current location of Tropicana Field and the only Pinellas County mention on the list. If I were to extend the list to 12 we would see one additional Pinellas County entry. However,  number 12, zip code 34698, is Dunedin, Florida, spring-training home of the Toronto Blue Jays. So we will keep the list to 11.

Unfortunately, as you can probably guess, none of the top 10 are near Tropicana Field. As a matter of fact, the average distance from the center of the 11 most populated zip codes to Tropicana Field is 29 miles.

On my site, I’ve written how the four minor-league teams in the Tampa Bay are a closer Mon-Thurs alternative for baseball fans in the Tampa Bay area. They are not only cheaper, but also more convenient. Here are the average distances of the 11 most populated zip codes to Steinbrenner Field (Tampa Yankees), Bright House Field (Clearwater Threshers), Florida Auto Exchange Stadium (Dunedin Blue Jays), and McKechnie Field (Bradenton Marauders).

  • Avg distance to Steinbrenner Field: 16.5 miles
  • Avg distance to Bright House Field: 24.2 miles
  • Avg distance to Florida Auto Exchange Stadium: 27.3 miles
  • Avg distance to McKechnie Field: 49.6 miles

Turning to the social aspect, we next add the Facebook “like” data to our chart. Here we see the Rays don’t have an overwhelming amount of fans anywhere in Tampa Bay area. Even in the Tropicana Field zip code less than 60% of baseball fans root for the home team, although 33713 does have the lowest percentage of Yankees fans on the list.

By comparison, in the similarly-sized Pittsburgh area, 70-75% of fans are Pirates fans and Yankees fans are roughly 5-7%. There are nearly 3x more people rooting for the Yankees in Tampa Bay than in Pittsburgh. Granted there is a longer tradition of rooting for one team in Pittsburgh, but that culture is easier to develop when there is only one team in the area.

So will building a new stadium help the Rays? Here is the population chart with the Rays fandom and distances to two front-running new stadium locations: Toytown and the Tampa Park Apartments.

By average, the Tampa Park Apartments location is 12 miles closer to the top 11 populated zip codes. The Toytown location splits the difference.

  • Avg distance to Tropicana Field: 30 miles
  • Avg distance to Toytown: 24 miles
  • Avg distance to Tampa Park Apartments: 18 miles

Both the Tampa Park Apartments and the Toytown location have another advantage the Tropicana Field location doesn’t have: both are within 15 miles of Steinbrenner Field and Bright House Field, meaning territorial rights can be exercised. While the MLB team has priority and can force the MiLB team to move, doing so might require compensation. For the Rays, removing the competition might be worth the extra cost, even if means paying the high ransom of a division rival.

(Note: territorial rights does not apply to Spring Training currently. If I was the Rays, I would fight that based on the precedence set by the Yankees and Orioles, who moved out of the Miami area before the Marlins began play in South Florida. I would also claim lost local revenue to Spring Training competition. Local fans who go to Steinbrenner Field could just as easily wait a month to see the Yankees at Tropicana Field.)

After a new stadium is built, after the competition is cleared out, and after the Rays have a monopoly of their small market, then they can finally attempt to win the hearts and minds of the region as other small-market teams do.

Rian Watt is absolutely correct. Social understanding is the next great baseball unknown. Knowing the story of fans, where they live, and what motivates them to support teams will be essential as we move from solving baseball’s complicated problems to finding solutions to its most complex problems.


Flying High

As a whole, Elvis Andrus’s 2015 season was quite unremarkable. In his seventh year in the bigs, he set career lows in batting average and OBP while finishing with his second-worst wRC+ season of his career. He also stole his second-fewest amount of bases while scoring fewer runs than ever before.

One thing that he can hang his hat on, though, was his power output. Andrus finished 2015 with the second-highest ISO of his career, setting a new career high for home runs in the process. Now, he still only hit seven, but we’re talking about the player who hit zero in 674 PA in 2010. Elvis Andrus hitting seven home runs in a season is like Barry Bonds hitting 85, or Ben Revere hitting three.

Reaching seven home runs was actually quite an extraordinary feat for Andrus, not because of the total itself but because of how it compared to his 2014 season. Andrus hit just two home runs that year, which tied him for second-fewest in the MLB among qualified batters. By hitting seven the next year, he more than tripled his previous total. Only three hitters who qualified both years achieved the same feat:

Player 2014 HR 2015 HR
Adam Eaton 1 14
Matt Carpenter 8 28
Elvis Andrus 2 7

What’s even more impressive is that two of those players, Carpenter and Andrus, had fewer plate appearances in 2015 than 2014. So how did they manage to do it?

I’ve been focusing on Andrus, so let’s continue with him. His HR/FB% went up a little in 2015, but it was only 1% higher than his career average and lower than his output in two of his previous seasons. Since that clearly wasn’t the change, it must’ve been something else. Looking at his batted-ball breakdown, something shows up.

Andrus finished 2015 with a 31.8 FB%, the highest of his career. This was an increase of 10.9% from 2014, which represented the largest increase in FB% of any player between the past two years:

Rank Player 2014 FB% 2015 FB% FB% Change
1 Elvis Andrus 20.9% 31.8% 10.9%
2 Todd Frazier 37.1% 47.7% 10.6%
3 Jay Bruce 34.0% 44.2% 10.2%
4 Adam Eaton 20.2% 27.3% 7.1%
4 Jose Bautista 41.7% 48.8% 7.1%
6 Albert Pujols 35.4% 42.2% 6.8%
7 Daniel Murphy 29.4% 36.0% 6.6%
8 Matt Carpenter 35.2% 41.7% 6.5%
9 Gerardo Parra 23.9% 29.4% 5.5%
9 Jose Altuve 29.7% 35.2% 5.5%

Eaton and Carpenter also both make this list, explaining their power outburst (at least partially). Some of these players aren’t very surprising, only making this list because their 2014 FB% was much lower than their career norm and they were simply regressing to where they should be (see: Pujols, Albert). Others, like Altuve, are only just beginning to explore their power potential.

Regardless of the reasoning, the most important question that comes from this list is whether or not those on it can duplicate their performance. Without looking at individual swings and searching for differences, I decided the easiest way to determine this was by looking at historical data. Since batted-ball data became available in 2002, there have been 19 different qualified players to increase their FB% by 10% or more between consecutive seasons, and then play another qualified season the following year:

Player / Years Year 1 FB% Year 2 FB% Year 3 FB% Y2-Y1 FB% Y3-Y2 FB% Percent Regression
Hideki Matsui 2003-05 23.8% 39.9% 36.3% 16.1% -3.6% 22.36%
Grady Sizemore 2005-07 31.0% 46.9% 46.6% 15.9% -0.3% 1.89%
Bill Hall 2005-07 34.5% 47.9% 41.3% 13.4% -6.6% 49.25%
Aaron Hill 2009-11 41.0% 54.2% 42.0% 13.2% -12.2% 92.42%
Carlos Beltran 2003-05 32.7% 45.9% 37.0% 13.2% -8.9% 67.42%
Jhonny Peralta 2009-11 30.6% 43.4% 44.2% 12.8% 0.8% -6.25%
Derrek Lee 2008-10 33.7% 45.7% 37.6% 12.0% -8.1% 67.50%
Mark Kotsay 2003-05 29.1% 40.8% 35.5% 11.7% -5.3% 45.30%
Jason Kendall 2006-08 25.9% 37.6% 36.6% 11.7% -1.0% 8.55%
Mike Trout 2013-15 35.6% 47.2% 38.4% 11.6% -8.8% 75.86%
Brad Wilkerson 2003-05 36.0% 47.5% 45.0% 11.5% -2.5% 21.74%
Daniel Murphy 2012-14 24.9% 36.3% 29.4% 11.4% -6.9% 60.53%
Derek Jeter 2003-05 21.5% 32.7% 20.7% 11.2% -12.0% 107.14%
Garrett Atkins 2005-07 30.2% 41.1% 44.1% 10.9% 3.0% -27.52%
Adrian Gonzalez 2006-08 33.3% 43.7% 36.6% 10.4% -7.1% 68.27%
Brian Roberts 2003-05 28.7% 39.0% 37.3% 10.3% -1.76% 16.50
Brandon Crawford 2013-15 31.8% 42.0% 33.5% 10.2% -8.5% 83.33%
Bobby Abreu 2003-05 26.7% 36.8% 28.9% 10.1% -7.9% 78.22%
Lance Berkman 2005-06 31.7% 41.8% 37.6% 10.1% -4.2% 41.58%

Only twice did the player make even further gains in their FB%, and the average regression among all 19 of the players was 46.01% toward their first-year numbers. With this in mind, it’s difficult to envision players like Andrus and Frazier repeating their performances from last season. And even if that means we won’t be seeing a double-digit home-run season for Elvis Andrus anytime soon, I think that we’ll be all right without one.


Hardball Retrospective – The “Original” 1906 Chicago Cubs

In “Hardball Retrospective: Evaluating Scouting and Development Outcomes for the Modern-Era Franchises”, I placed every ballplayer in the modern era (from 1901-present) on their original team. Consequently, Greg Luzinski is listed on the Phillies roster for the duration of his career while the Browns / Orioles declare Steve Finley and the Padres claim Derrek Lee. I calculated revised standings for every season based entirely on the performance of each team’s “original” players. I discuss every team’s “original” players and seasons at length along with organizational performance with respect to the Amateur Draft (or First-Year Player Draft), amateur free agent signings and other methods of player acquisition.  Season standings, WAR and Win Shares totals for the “original” teams are compared against the “actual” team results to assess each franchise’s scouting, development and general management skills.

Expanding on my research for the book, the following series of articles will reveal the finest single-season rosters for every Major League organization based on overall rankings in OWAR and OWS along with the general managers and scouting directors that constructed the teams. “Hardball Retrospective” is available in digital format on Amazon, Barnes and Noble, GooglePlay, iTunes and KoboBooks. The paperback edition is available on Amazon, Barnes and Noble and CreateSpace. Supplemental Statistics, Charts and Graphs along with a discussion forum are offered at TuataraSoftware.com.

Don Daglow (Intellivision World Series Major League Baseball, Earl Weaver Baseball, Tony LaRussa Baseball) contributed the foreword for Hardball Retrospective. The foreword and preview of my book are accessible here.

Terminology

OWAR – Wins Above Replacement for players on “original” teams

OWS – Win Shares for players on “original” teams

OPW% – Pythagorean Won-Loss record for the “original” teams

Assessment

The 1906 Chicago Cubs          OWAR: 58.8     OWS: 362     OPW%: .518

Based on the revised standings the “Original” 1906 Cubs finished fourth in a tight battle with the Giants, Cardinals and Pirates. Chicago topped the National League in OWS and OWAR.

Frank “The Peerless Leader” Chance supplied a .319 BA and led the circuit with 103 aces and 57 thefts. Frank “Wildfire” Schulte pilfered 25 bags and slashed a League-best 13 triples. Johnny Kling manufactured a .312 BA while the famous keystone combination of Johnny Evers and Joe Tinker collectively swiped 79 bases.

Hugh Duffy ranks twentieth in the All-Time Center Fielder rankings according to Bill James in “The New Bill James Historical Baseball Abstract.” Teammates listed in the “NBJHBA” top 100 rankings include Bill Dahlen (21st-SS), Chance (25th-1B), Evers (25th-2B), Tinker (33rd-SS), Bill Bradley (46th-3B), Kling (48th-C), Schulte (60th-RF) and Jim Delahanty (81st-2B).

LINEUP POS WAR WS
Joe Tinker SS 5.01 17.55
Johnny Evers 2B 4.95 19.46
Frank Chance 1B 7.36 33.26
Frank Schulte RF 3.33 23.94
Johnny Kling C 3.3 20.78
Jim Delahanty 3B 2.21 13.98
Bunk Congalton LF/RF 1.79 15.25
Davy Jones CF 0.69 12.35
BENCH POS WAR WS
Bill Dahlen SS 2.92 17.54
Larry Schlafly 2B 2.91 18.99
Frank Isbell 2B 2.19 25.91
Bill Bradley 3B 1.65 11.16
Tommy Raub C 0.66 2.84
George Moriarty 3B 0.14 5.97
Hugh Duffy -0.01 0
Tom Walsh C -0.01 0.01
Bill Phyle 3B -0.27 0.76
Germany Schaefer 2B -0.3 11.86
Malachi Kittridge C -0.55 0.58

Bob “Dusty” Rhoads (22-10, 1.80) delivered personal-bests in every major pitching category. Jack W. Taylor (20-12, 1.99) and “Tornado” Jake Weimer (20-12, 2.22) also surpassed the 20-win mark for the Cubbies. “Big” Ed Reulbach (19-4, 1.65) paced the Senior Circuit with a .826 winning percentage. Carl Lundgren added 17 victories and fashioned a 2.21 ERA.

ROTATION POS WAR WS
Jake Weimer SP 5.46 24.75
Bob Rhoads SP 4.77 23.12
Jack W. Taylor SP 4.67 25.42
Ed Reulbach SP 3.38 23.77
BULLPEN POS WAR WS
Carl Lundgren SP 2.07 18
Fred Glade SP 1.75 16.78
Fred Beebe SP 0.81 13.02
Big Jeff Pfeffer SP 0.67 16.13
Jack Doscher SP 0.35 1.11
Hub Knolls RP -0.16 0.38
Tom J. Hughes SP -1.84 3.32
Mal Eason SP -1.85 7.47

The “Original” 1906 Chicago Cubs roster

NAME POS WAR WS General Manager Scouting Director
Frank Chance 1B 7.36 33.26
Jake Weimer SP 5.46 24.75
Joe Tinker SS 5.01 17.55
Johnny Evers 2B 4.95 19.46
Bob Rhoads SP 4.77 23.12
Jack Taylor SP 4.67 25.42
Ed Reulbach SP 3.38 23.77
Frank Schulte RF 3.33 23.94
Johnny Kling C 3.3 20.78
Bill Dahlen SS 2.92 17.54
Larry Schlafly 2B 2.91 18.99
Jim Delahanty 3B 2.21 13.98
Frank Isbell 2B 2.19 25.91
Carl Lundgren SP 2.07 18
Bunk Congalton RF 1.79 15.25
Fred Glade SP 1.75 16.78
Bill Bradley 3B 1.65 11.16
Fred Beebe SP 0.81 13.02
Davy Jones CF 0.69 12.35
Big Jeff Pfeffer SP 0.67 16.13
Tommy Raub C 0.66 2.84
Jack Doscher SP 0.35 1.11
George Moriarty 3B 0.14 5.97
Hugh Duffy -0.01 0
Tom Walsh C -0.01 0.01
Hub Knolls RP -0.16 0.38
Bill Phyle 3B -0.27 0.76
Germany Schaefer 2B -0.3 11.86
Malachi Kittridge C -0.55 0.58
Tom Hughes SP -1.84 3.32
Mal Eason SP -1.85 7.47

Honorable Mention

The “Original” 1945 Cubs      OWAR: 50.4     OWS: 307     OPW%: .654

The Cubs (101-53) eclipsed the century mark in victories to secure the pennant and amassed a comfortable lead in OWAR and OWS. Phil Cavarretta (.355/6/97) merited 1945 National League MVP honors while topping the circuit in batting average and OBP (.449). “Smiling” Stan Hack scored 110 runs and supplied career-bests with a .323 BA and 99 bases on balls. Augie Galan (.307/9/92) coaxed 114 walks and registered 114 tallies. “Handy” Andy Pafko (.298/12/110) established personal-bests in RBI and triples (12). Hank Wyse (22-10, 2.68) completed 23 of 34 starts and Harry “The Cat” Brecheen (15-4, 2.52) contributed a league-best .789 winning percentage.

On Deck

The “Original” 1980 Astros

References and Resources

Baseball America – Executive Database

Baseball-Reference

James, Bill. The New Bill James Historical Baseball Abstract. New York, NY.: The Free Press, 2001. Print.

James, Bill, with Jim Henzler. Win Shares. Morton Grove, Ill.: STATS, 2002. Print.

Retrosheet – Transactions Database

Seamheads – Baseball Gauge

Sean Lahman Baseball Archive


Adjusted Mayberry Method Ratings for NL

The last couple years, I have calculated the Mayberry Method for the NL from the Baseball Forecaster Book from Ron Shandler. The Mayberry Method is based on speed, power, batting average, and role (PAs). A score from 0 to 5 is assigned for each of the three skill categories and added and multiplied to the role score. After the “raw” score is determined, it is multiplied by three reliability factors.

When I determine the total score for each player, I split them up into positions. Next, I take the 30th percentile score (widely considered as the replacement level) and subtract each score from the replacement-level score for that position.

For example, Christian Yelich had a 2 score for power, a 4 score for speed and batting average, and a 5 score for role. One would add (2+4+4+5)=15. Then I multiplied 15 by 5 (the role score) and got 75. Next I multiplied 75 by the three reliability scores which were 1.05, 1.05, and 1.1 to get 90.95 as the total score. Because, Yelich was an outfielder, his score was subtracted by the replacement level score for outfielder of 63. So, Yelich’s final score was 27.95, good for 25th overall. Without much further ado, here are the rankings.

The first column is the total score, the second column is the name and position, the third column the number equivalent of the position (Catcher 2, 1B 3, 2B 4 and so forth), the final column is the position adjusted Mayberry score. Notice four out of the five players are second basemen (the other is Starling Marte an elite power-speed-BA player). Note for fantasy players in NL-only leagues, second basemen make up seven out of the top-20 but are far-and-few-between lower than that.

88.935 Daniel Murphy 2B 4 52.635
88.935 Ben Zobrist 2B 4 52.635
113.135 Starling Marte OF 7 50.135
80.85 DJ LeMahieu 2B 4 44.55
78.65 Howie Kendrick 2B 4 42.35
97.02 Paul Goldschmidt 1B 3 42.02
73.5 Anthony Rendon 2B 4 37.2
86.82188 Nolan Arenado 3B 5 36.82188
96.8 Andrew McCutchen OF 7 33.8
82.5825 Todd Frazier 3B 5 32.5825
80.85 Jacob Realmuto C 2 31.85
68.07938 Joe Panik 2B 4 31.77938
81.675 Corey Seager 3B 5 31.675
86.515 Adrian Gonzalez 1B 3 31.515
94.5 A.J Pollock OF 7 31.5
79.86 Buster Posey C 2 30.86
93.7125 Ryan Bruan OF 7 30.7125
80.465 Matt Carpenter 3B 5 30.465
80.465 Matt Duffy 3B 5 30.465
66.70125 Brandon Phillips 2B 4 30.40125
93.17 Justin Upton OF 7 30.17
84.7 Anthony Rizzo 1B 3 29.7
92.4 Charlie Blackmon OF 7 29.4
90.95625 Ben Revere OF 7 27.95625
90.95625 Christian Yelich OF 7 27.95625
82.5825 Ian Desmond SS 6 26.5825
82.5825 Jimmy Rollins SS 6 26.5825
82.5825 Jean Segura SS 6 26.5825
88.935 Dexter Fowler OF 7 25.935
75.24563 Neil Walker 2B 5 25.24563
61.425 Josh Harrison 2B 4 25.125
80.85 Dee Gordan SS 6 24.85
60.5 Wilmer Flores 2B SS 4 24.2
78.82875 Freddie Freeman 1B 3 23.82875
86.82188 Edgar Inciarte OF 7 23.82188
72.765 Wellington Castillo C 2 23.765
86.625 Norichika Aoki OF 7 23.625
73.31625 Corey Spagenberg 2B 5 23.31625
78.82875 Brandon Crawford SS 6 22.82875
72.765 Yangervis Solerte 3B 5 22.765
77.175 Adam Lind 1B 3 22.175
84.8925 Jason Heyward OF 7 21.8925
84.8925 Seth Smith OF 7 21.8925
71.5 Kris Bryant 3B 5 21.5
69.3 Derek Norris C 2 20.3
69.8775 Martin Prado 3B 5 19.8775
82.6875 Khris Davis OF 7 19.6875
82.5825 Gregory Polanco OF 7 19.5825
82.5 Stephen Piscotty OF 7 19.5
68.25 Jonathan Lucroy C 2 19.25
80.85 Odubel Herrera OF 7 17.85
72.765 Pedro Alverez 1B 3 17.765
80.325 Bryce Harper OF 7 17.325
66.15 Justin Turner 3B 5 16.15
65.835 Yasmany Tomas 3B 5 15.835
78.75 Chris Coghlan OF 7 15.75
78.75 Yasiel Puig OF 7 15.75
71.6625 Chris Owings SS 6 15.6625
71.6625 Jose Reyes SS 6 15.6625
78.65 Jay Bruce OF 7 15.65
51.7275 Jace Peterson 2B 4 15.4275
51.7275 Javier Baez 2B 4 15.4275
70 Brandon Belt 1B 3 15
69.4575 Lucas Duda 1B 3 14.4575
77.175 Curtis Granderson OF 7 14.175
77.175 Marcell Ozuna OF 7 14.175
69.3 Eugenio Suarez SS 6 13.3
75.24 David Peralta OF 7 12.24
66.825 Joey Votto 1B 3 11.825
61.425 Maikel Franco 3B 5 11.425
66 Ryan Zimmerman 1B 3 11
66.70125 Adeiny Hechavarria SS 6 10.70125
60.5 Yunel Escobar 3B 5 10.5
73.205 Nick Markakis OF 7 10.205
72.765 Marlon Byrd OF 7 9.765
71.32125 Andre Ethier OF 7 8.32125
70.875 Matt Kemp OF 7 7.875
57.60563 Jacob Lamb 3B 5 7.605625
70.56 Hunter Pence OF 7 7.56
69.825 Randal Grichuk OF 7 6.825
62.37 Jung-Ho Kang SS 6 6.37
55.2825 Travis D’Arnaud C 2 6.2825
55.125 Yadier Molina C 2 6.125
68.4 Corey Dickerson OF 7 5.4
66.70125 Billy Hamilton OF 7 3.70125
40 Jedd Gyorko 2B 4 3.7
52.25 Nick Hundley C 2 3.25
53.24 Kolten Wong 2B 5 3.24
66.15 Denard Span OF 7 3.15
65.835 Michael Taylor OF 7 2.835
57.1725 Addison Russell SS 6 1.1725
49.37625 Miguel Montero C 2 0.37625
49.005 Kyle Schwarber C 2 0.005
36.3 Cesar Hernandez 2B 4 0
63 Carlos Gonzalez RF 7 0
63 Giancarlo Stanton OF 7 0
54.57375 Brandon Moss 1B OF 3 -0.42625
62.37 Michael Conforto OF 7 -0.63
55.125 Freddy Galvis SS 6 -0.875
55.125 Jordy Mercer SS 6 -0.875
60.6375 Joc Pederson OF 7 -2.3625
33.075 Kiki Hernandez 2B 4 -3.225
33 Danny Espinosa 2B 4 -3.3
33 Scooter Gennett 2B 4 -3.3
59.535 Matt Holiday OF 7 -3.465
44.55 Hector Olivera 3B 5 -5.45
49.5 Justin Bour 1B 3 -5.5
49.6125 Ruden Tejada SS 6 -6.3875
43.2 David Wright 3B 5 -6.8
55.2825 Jorge Soler OF 7 -7.7175
39.9 Yasmani Grandal C 2 -9.1
53.865 Cameron Maybin OF 7 -9.135
26.73 Jose Paraza 2B 4 -9.57
45.6 Zack Cozart SS 6 -10.4
37.8 Wilson Ramos C 2 -11.2
43.32 Wil Myers OF 1B 3 -11.68
45.36 Jayson Werth LF 7 -17.64
36.3 Ben Paulsen 1B 3 -18.7
29.7 Brandon Drury 3B 5 -20.3
29.62575 Derek Dietrich OF 3B 5 -20.3743
29.04 Cody Asche OF 3B 5 -20.96
38.115 Gregor Blanco OF 7 -24.885
36.6795 Aaron Altherr OF 7 -26.3205
32.67 Travis Janikowski OF 7 -30.33
28.728 Carl Crawford OF 7 -34.272
28.08 Michael Cuddyer OF 7 -34.92
26.46 Dominic Brown OF 7 -36.54