Archive for Research

Hardball Retrospective – What Might Have Been – The “Original” 1969 Reds

In “Hardball Retrospective: Evaluating Scouting and Development Outcomes for the Modern-Era Franchises”, I placed every ballplayer in the modern era (from 1901-present) on their original team. I calculated revised standings for every season based entirely on the performance of each team’s “original” players. I discuss every team’s “original” players and seasons at length along with organizational performance with respect to the Amateur Draft (or First-Year Player Draft), amateur free agent signings and other methods of player acquisition.  Season standings, WAR and Win Shares totals for the “original” teams are compared against the “actual” team results to assess each franchise’s scouting, development and general management skills.

Expanding on my research for the book, the following series of articles will reveal the teams with the biggest single-season difference in the WAR and Win Shares for the “Original” vs. “Actual” rosters for every Major League organization. “Hardball Retrospective” is available in digital format on Amazon, Barnes and Noble, GooglePlay, iTunes and KoboBooks. The paperback edition is available on Amazon, Barnes and Noble and CreateSpace. Supplemental Statistics, Charts and Graphs along with a discussion forum are offered at TuataraSoftware.com.

Don Daglow (Intellivision World Series Major League Baseball, Earl Weaver Baseball, Tony LaRussa Baseball) contributed the foreword for Hardball Retrospective. The foreword and preview of my book are accessible here.

Terminology

OWAR – Wins Above Replacement for players on “original” teams

OWS – Win Shares for players on “original” teams

OPW% – Pythagorean Won-Loss record for the “original” teams

AWAR – Wins Above Replacement for players on “actual” teams

AWS – Win Shares for players on “actual” teams

APW% – Pythagorean Won-Loss record for the “actual” teams

Assessment

The 1969 Cincinnati Reds 

OWAR: 59.0     OWS: 355     OPW%: .619     (100-62)

AWAR: 37.4      AWS: 267     APW%: .549     (89-73)

WARdiff: 21.6                        WSdiff: 88  

The “Original” 1969 Reds outdistanced the Giants by a fourteen-game margin to secure the National League pennant. Pete Rose (.348/16/82) aka “Charlie Hustle” led the NL with 120 runs scored and registered personal-bests in home runs, RBI, batting average, OBP (.428) and SLG (.512). “The Toy Cannon”, center fielder Jim Wynn swatted 33 big-flies, nabbed 23 bags and tallied 113 runs. Completing the outfield trio with 30+ Win Shares, Frank “The Judge” Robinson crushed 32 long balls and knocked in 100 baserunners while posting a .308 BA.

The Cincinnati infield, with the exception of second-sacker Tommy Helms, produced 23+ Win Shares each. Tony “Big Dog” Perez (.294/37/122) manned the hot corner while the “Big Bopper”, Lee May (.278/38/110) earned his first All-Star assignment over at first base. Leo “Mr. Automatic” Cardenas (.280/10/70) provided a steady bat at shortstop. “Little General” Johnny Bench (.293/26/90) delivered an encore to his 1968 NL Rookie of the Year campaign. The Reds’ reserves featured the fleet-footed Cesar Tovar (.288, 45 SB) and Tommy Harper (73 SB) along with seven-time Gold Glove Award-winning center fielder Curt Flood.

Bench ranked second behind Yogi Berra at catcher in the “The New Bill James Historical Baseball Abstract” top 100 player rankings. “Original” Reds teammates enumerated in the “NBJHBA” top 100 rankings include Frank Robinson (3rd-RF), Pete Rose (5th-RF), Jim Wynn (10th-CF), Tony Perez (13th-1B), Vada Pinson (18th-CF), Curt Flood (36th-CF), Lee May (47th-1B), Leo Cardenas (50th-SS), Johnny Edwards (53rd-C), Tommy Harper (56th-LF), Cookie Rojas (69th-2B), Cesar Tovar (79th-CF), Tony Gonzalez (82nd-CF) and Tommy Helms (99th-2B).

  Original 1969 Reds                                                                     Actual 1969 Reds

LINEUP POS OWAR OWS LINEUP POS AWAR AWS
Frank Robinson LF/RF 5.31 31.84 Alex Johnson LF 2.86 18.84
Jim Wynn CF 7.36 36.09 Bobby Tolan CF 4.43 26.52
Pete Rose RF 4.83 36.77 Pete Rose RF 4.83 36.77
Lee May 1B 3.31 25.11 Lee May 1B 3.31 25.11
Tommy Helms 2B -0.93 5.57 Tommy Helms 2B -0.93 5.57
Leo Cardenas SS 2.81 23.74 Woody Woodward SS 0.45 5.83
Tony Perez 3B 5.77 30.41 Tony Perez 3B 5.77 30.41
Johnny Bench C 5.69 29.93 Johnny Bench C 5.69 29.93
BENCH POS OWAR OWS BENCH POS AWAR AWS
Cesar Tovar CF 3.37 20.31 Jimmy Stewart LF -0.1 4.89
Curt Flood CF 2.14 19.71 Ted Savage LF 0.29 3.27
Tony Gonzalez CF 1.89 17.19 Pat Corrales C 0.28 2.82
Tommy Harper 3B 1.78 16.64 Chico Ruiz 2B 0.03 2.68
Art Shamsky RF 2.61 16.22 Darrel Chaney SS -1.23 1.8
Johnny Edwards C 1.94 14.95 Jim Beauchamp LF -0.06 0.99
Vada Pinson RF 0.11 10.97 Fred Whitfield 1B -0.24 0.36
Brant Alyea LF 0.62 6.52 Danny Breeden C -0.1 0.08
Joe Azcue C 0.61 6.49 Bernie Carbo -0.04 0
Don Pavletich C 0.5 4.96 Mike de la Hoz -0.01 0
Chico Ruiz 2B 0.03 2.68 Clyde Mashore -0.01 0
Cookie Rojas 2B -0.66 2.56
Vic Davalillo RF -0.21 2.26
Gus Gil 3B -0.64 1.8
Darrel Chaney SS -1.23 1.8
Len Boehmer 1B -0.91 0.58
Fred Kendall C -0.26 0.31
Bernie Carbo -0.04 0
Clyde Mashore -0.01 0

Claude Osteen (20-15, 2.66) established career-highs with 321 innings pitched, 41 starts, 16 complete games, 7 shutouts and 183 strikeouts. Mike Cuellar (23-8, 2.38) claimed the Cy Young Award and fashioned a personal-best 1.005 WHIP. Jim Maloney contributed a 12-5 mark with a 2.77 ERA as a member of the “Original” and “Actual” Cincinnati rotations. Diego Segui tallied 12 wins and 12 saves to anchor the bullpen. Wayne Granger saved 27 contests in his sophomore season for the “Actuals” and topped the Senior Circuit with 90 appearances.

  Original 1969 Reds                                                                   Actual 1969 Reds

ROTATION POS OWAR OWS ROTATION POS OWAR OWS
Claude Osteen SP 5.09 24.65 Jim Maloney SP 3.93 14.63
Mike Cuellar SP 4.91 24.57 Jim Merritt SP 0.72 10.63
Jim Maloney SP 3.93 14.63 Gary Nolan SP 1.71 7.02
Casey Cox SP 2.14 12.03 George Culver SP -0.37 3.64
Gary Nolan SP 1.71 7.02 Gerry Arrigo SP -0.29 2.99
BULLPEN POS OWAR OWS BULLPEN POS OWAR OWS
Diego Segui RP 1.38 11.3 Wayne Granger RP 1.32 14.75
Dan McGinn RP -0.04 6.86 Clay Carroll RP 1.04 10.09
Jack Baldschun RP -0.3 3.57 Pedro Ramos RP -0.6 1.6
Billy McCool RP -0.04 2.88 John Noriega RP -0.19 0
John Noriega RP -0.19 0 Camilo Pascual SW -0.31 0
Mel Queen SP 0.37 1.17 Tony Cloninger SP -2.26 2.86
Sammy Ellis SP -0.33 0 Mel Queen SP 0.37 1.17
Jose Pena RP -0.68 0 Jack Fisher SP -1.91 0.72
Al Jackson RP -0.23 0.54
Dennis Ribant RP -0.05 0.49
Jose Pena RP -0.68 0
Bill Short RP -0.26 0


Notable Transactions

Frank Robinson

December 9, 1965: Traded by the Cincinnati Reds to the Baltimore Orioles for Jack Baldschun, Milt Pappas and Dick Simpson.

Jim Wynn

November 26, 1962: Drafted by the Houston Colt .45’s from the Cincinnati Reds in the 1962 first-year draft.

Leo Cardenas

November 21, 1968: Traded by the Cincinnati Reds to the Minnesota Twins for Jim Merritt.

Cesar Tovar

December 4, 1964: Traded by the Cincinnati Reds to the Minnesota Twins for Gerry Arrigo.

Claude Osteen

September 16, 1961: Traded by the Cincinnati Reds to the Washington Senators for a player to be named later and cash. The Washington Senators sent Dave Sisler (November 28, 1961) to the Cincinnati Reds to complete the trade.

December 4, 1964: Traded by the Washington Senators with John Kennedy and $100,000 to the Los Angeles Dodgers for a player to be named later, Frank Howard, Ken McMullen, Phil Ortega and Pete Richert. The Los Angeles Dodgers sent Dick Nen (December 15, 1964) to the Washington Senators to complete the trade.

Mike Cuellar 

Before 1963 Season: Sent from the Cincinnati Reds to the Cleveland Indians in an unknown transaction.

Before 1964 Season: Obtained by Jacksonville (International) from the Cleveland Indians as part of a minor league working agreement.

Before 1964 Season: Returned to the St. Louis Cardinals by Jacksonville (International) after expiration of minor league working agreement.

June 15, 1965: Traded by the St. Louis Cardinals with Ron Taylor to the Houston Astros for Chuck Taylor and Hal Woodeshick.

December 4, 1968: Traded by the Houston Astros with Tom Johnson (minors) and Enzo Hernandez to the Baltimore Orioles for John Mason (minors) and Curt Blefary.

Honorable Mention

The 1907 Cincinnati Reds 

OWAR: 39.9     OWS: 275     OPW%: .527     (81-73)

AWAR: 30.3       AWS: 198      APW%: .431    (66-87)

WARdiff: 9.6                        WSdiff: 77

Cincinnati ended the 1907 season in a fourth-place tie with Philadelphia but finished only six games behind the front-running Cubbies. “Wahoo” Sam Crawford (.323/4/81) laced 34 doubles, 17 triples and led the circuit with 102 runs scored. Orval Overall (23-7, 1.68) flummoxed opposing batsmen, posting a 1.006 WHIP with a League-high 8 shutouts. “Long” Bob Ewing compiled 17 victories with a 1.73 ERA and a WHIP of 1.094 while completing 32 of 37 starts. Patsy Dougherty swiped 33 bags while Mike Mitchell rapped 12 three-base hits in his rookie campaign. Harry Steinfeldt drilled 25 two-baggers and Socks Seybold drove in 92 baserunners.

On Deck

What Might Have Been – The “Original” 1997 Red Sox

References and Resources

Baseball America – Executive Database

Baseball-Reference

James, Bill. The New Bill James Historical Baseball Abstract. New York, NY.: The Free Press, 2001. Print.

James, Bill, with Jim Henzler. Win Shares. Morton Grove, Ill.: STATS, 2002. Print.

Retrosheet – Transactions Database

The information used here was obtained free of charge from and is copyrighted by Retrosheet. Interested parties may contact Retrosheet at “www.retrosheet.org”.

Seamheads – Baseball Gauge

Sean Lahman Baseball Archive


Is Pitcher BABIP All Luck?

This article was originally published on Check Down Sports.

For those of you who have been reading baseball content at Check Down Sports semi-regularly, you’ve probably seen one of us talking about players and teams we think are performing at a level far from expected.

A lot of times when attempting to explain the reasoning behind abnormal pitching performance, we cite a few reasons, and then attribute the rest to good or bad luck. Luck we usually associate with a batter’s batting average on balls in play (BABIP), which is agreed upon by most as beyond the control of the pitcher.

The influx of ball-tracking systems in MLB has allowed for a boatload of new measurements that, until a few years ago, were only dreams in the minds of analysts and evaluators. One of those — the velocity of ball exiting the bat (exit velocity) — is a popular, yet informative piece of data.

Intuitively, it makes sense that the softer the ball leaves the bat, the less likely the ball should result in a hit. A pitcher who suppresses exit velocity should allow fewer batted balls to become base hits than a pitcher who gives up a high exit velocity. Yes, bloops and seeing-eye ground balls will find open space, but on average, I think this assumption makes sense.

But thanks to Statcast and baseballsavant.com, this assumption doesn’t have to be an assumption at all. We can test it out.

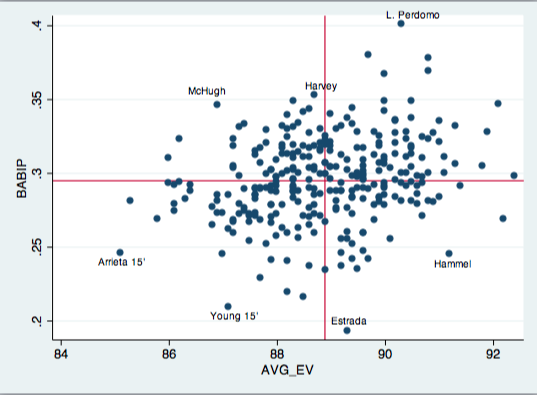
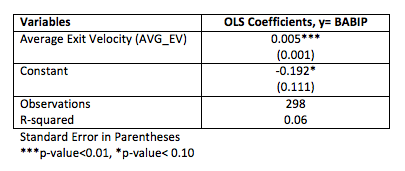
Baseball Savant has exit-velocity data since the beginning of 2015, so that’s where I started. I gathered average exit velocity against for pitchers with at least 190 batted-ball events in 2015 and 2016 (298 total). I then got the BABIP for those pitchers in those seasons from FanGraphs. Next, using STATA, I ran a simple linear regression with the two variables. Results are shown below.

Screen Shot 2016-07-14 at 12.33.28 PM

Screen Shot 2016-07-13 at 11.05.37 PM

The scary math-stuff explained:

  • A pitcher’s BABIP isn’t entirely caused by luck
  • Exit velocity has a minor, yet significant, effect on BABIP
  • 6% of a pitcher’s BABIP can be explained by exit velocity
  • If a pitcher decreases his average exit velocity by 1 mph his BABIP will decrease by 0.005 points, on average (i.e. a pitcher decreases his average exit velocity from 90 to 89 mph — his .300 BABIP would fall to .295. In turn, this would lower his ERA)
  • The bottom-left quadrant is ideal. Though, because of exit velocity’s small effect on BABIP, probably not sustainable. We’ve seen Arrieta and and Chris Young come back to earth a bit in 2016
  • The top-left quadrant includes candidates for improvement in the second half of 2016 or 2017. Pitchers here have been unlucky in terms of BABIP. Their exit velocities suggest they should have a lower BABIP, and, therefore, ERA


Park Factors to (Maybe) Monitor

Every baseball stadium is different.  This is an obvious fact, but its obviousness can obscure its importance.  Every baseball stadium is different, so baseball is different in every stadium.  Some of these differences are easy to discern such as HRs in Denver and Cincinnati.  Others though are more easily masked — did you know that the White Sox’ U.S. Cellular Field raises walks by 7%?  Each game is a combination of outcomes affected by each team’s talent and, to a lesser extent, these park factors.  FanGraphs is nice enough to publish its park factors here.

With the league-wide increase in exit velocity and home runs, I was interested to know if any park factors may be changing as well.  With roughly half of the 2016 season in the books, I thought now was as good a time as any to take a look.  Rather than go through the laborious calculations necessary to find park factors like those at FanGraphs, I came up with a quick and not at all exact way to look at just this season.  Essentially, I found each team’s home and away rates of 1B, 2B, 3B, HR, SO and BB per plate appearance.  I then compared each to league average on the same scale as wRC+ (100 is average).  I then calculated a quick park factor on the same scale for each of the above stats as follows (1B factor shown below):

((Team Home 1B Rate – (Team Away 1B Rate – 100)) + 100) / 2 = 1B Park Factor

For example, the Marlins have hit 4% more singles than average at home (104 1B+), and 27% more singles than average on the road (127 1B+), so the Marlins Park 1B park factor would be 88 (depresses singles by 12%).

I am fully aware of the many problems with the methodology (ignores half of the data, small sample, not enough regression included, team road schedules aren’t guaranteed to have average park factors, etc.), but like I said, I wanted something quick, and I am only focused on the extremes anyway.  This should at least show us which parks to consider monitoring or examining further.

2015 FanGraphs vs. 2016 Observed Park Factors
2015 FanGraphs 2016 Observed
Team 1B 2B 3B HR SO BB Team 1B 2B 3B HR SO BB
Angels 100 96 91 93 102 97 Angels 98 87 80 105 101 103
Astros 99 100 108 105 103 101 Astros 93 103 138 101 104 102
Athletics 99 100 105 93 97 101 Athletics 97 97 145 90 98 94
Blue Jays 97 108 105 106 102 99 Blue Jays 107 116 74 90 103 102
Braves 100 99 93 96 103 101 Braves 106 85 125 94 99 102
Brewers 99 100 102 112 101 102 Brewers 95 106 131 113 98 104
Cardinals 100 99 95 94 98 99 Cardinals 101 104 42 88 96 98
Cubs 99 99 102 102 101 102 Cubs 96 84 105 100 98 111
Diamondbacks 99 99 102 100 98 111 Diamondbacks 99 105 120 102 100 99
Dodgers 98 98 78 102 100 96 Dodgers 98 91 69 116 98 101
Giants 99 97 115 84 100 100 Giants 103 97 163 83 100 109
Indians 100 103 81 101 101 99 Indians 109 121 21 105 93 120
Mariners 98 87 85 98 102 97 Mariners 96 96 92 108 97 108
Marlins 101 100 117 88 98 101 Marlins 88 109 42 102 99 102
Mets 96 95 87 101 101 100 Mets 98 86 80 108 98 111
Nationals 104 102 84 97 97 98 Nationals 104 90 70 98 93 109
Orioles 101 99 86 108 99 100 Orioles 103 93 118 105 89 109
Padres 98 95 97 98 102 101 Padres 99 98 100 94 96 102
Phillies 98 99 92 107 103 102 Phillies 93 87 128 94 104 104
Pirates 101 99 89 90 96 96 Pirates 106 88 157 101 92 110
Rangers 103 101 110 105 98 102 Rangers 106 105 153 86 95 113
Rays 99 95 98 96 102 100 Rays 99 99 98 84 105 95
Red Sox 103 114 105 96 100 100 Red Sox 102 123 90 87 94 109
Reds 99 98 92 113 103 101 Reds 97 94 100 121 102 99
Rockies 110 108 128 113 95 102 Rockies 103 134 170 109 86 114
Royals 101 103 114 93 96 99 Royals 104 113 141 100 90 106
Tigers 101 98 126 98 95 99 Tigers 105 97 135 105 96 105
Twins 102 101 106 98 98 99 Twins 105 101 171 86 87 98
White Sox 99 97 91 108 103 107 White Sox 100 99 86 108 97 107
Yankees 100 97 84 110 101 101 Yankees 94 102 86 120 97 116
Data pulled at All-Star Break

I know that is a lot to digest, and I apologize it is not sortable due to my lack of coding skill — but there are some interesting differences buried in that table.

1B Park Factor

Two parks stick out at the extreme ends for singles.  The aforementioned Marlins Park went from slightly single-friendly to the worst park for singles.  I don’t have a good explanation for this, though the fences were moved in prior to this season which we would expect to set off a ripple affect with the park factors.  The Blue Jays’ Rogers Centre went the opposite direction of the Marlins, showing a move from slightly below-average for singles to the second-best park for singles.  The Jays did change to a dirt infield from turf for 2016, but I would expect that to decrease 1Bs rather than increase them.  Maybe dirt slows infielders down giving them less range?  The Jays have recorded more infield and bunt hits at home than on the road as well, which would increase singles.

2B Park Factor

Coors Field has seen a marked increase in doubles (and triples) in 2016 with a small decrease in HRs, which is very interesting considering they raised several areas of the outfield walls.  The Cubs, Braves, Nationals, Phillies and Pirates have all seen at least a 10-point decrease in 2Bs.  Of that group, the Braves, Phillies and Pirates seem to have traded those doubles for triples which I wouldn’t necessarily expect to hold up as a change in the park factor given the limited samples.  The Phillies also made a change to a longer-cut grass, so a decrease in 1Bs and 2Bs makes some sense.  I am not sure what is going on in Chicago (wind patterns?) and Washington as the decrease in doubles does not seem to be offset by an increase in other similar batted balls.

3B Park Factor

As expected with the extremely limited number of triples, there is a ton of variation across the half-season sample.  The two most likely to represent a true change to the park factors in my mind are the decrease in triples in Marlins Park (moved fences in) and the increase in triples at Coors Field (raised fences), though both likely won’t hold up to this magnitude.

HR Park Factor

There have been large and unexpected decreases in home runs in Toronto and Texas, while the Marlins and Dodgers have seen upticks in homers at home.  Probably nothing but small-sample noise here.  It will be worth checking more rigorously to see if these hold up, particularly at Marlins Park given the change to the fences.

Strikeout and Walk Park Factors

Given the way I have calculated each component park factor, I expected all of them to need an adjustment for home-field advantage.  Interestingly, that was not the case for 1Bs, 2Bs and HRs as the average observed park factor for each was 100 across the league.  I wrote off the 108 average observed 3B factor as small-sample noise, but I believe I picked up some measure of home-field advantage in strikeouts and walks.  On average across the league, home parks decreased strikeouts by 3% and increased walks by 5%.  These have been regressed and the samples for each are among the largest of the component park factors (more PAs end in a K than any specific batted-ball outcome, and there are more BBs than anything except 1Bs), so it feels like this reflects something.

The extreme parks for changes in strikeouts are the Twins’ Target Field and Diamondbacks’ Chase Field.  Adjusting for the home-field difference (the unadjusted numbers are shown in the table above), the Twins’ park seems to be decreasing strikeouts by about 8% more than usual, while the Diamondbacks’ stadium is increasing Ks by 8% more than FG expects.  The Twins did make a change to their CF seating that could be affecting the hitters’ ability to pick up pitches (and thus strike out less), but if that is the case an increase in walks would also be expected — and that is not the case, as the Twins have actually walked less than expected when including the home-field adjustment.

For changes in BBs (after adjusting for home field), the parks in Oakland and Cleveland stick out.  The Coliseum has allowed 12% less walks than expected, while the Indians’ Progressive Field has inflated walks by 16%.  These may be worth exploring as both parks have also affected strikeouts, with the A’s park increasing strikeouts and the Indians’ park decreasing Ks.  It is possible hitters are not picking up the ball in Oakland while they are seeing it well in Cleveland.

***

So there you have it.  Noisy, likely inaccurate 2016 park factors.  It will be very interesting to see if any of the observed changes detailed above turn out to reflect a true change in the park factors.  My best guess is Colorado, Miami and Toronto will need some type of adjustment from the 2015 park factors given the fairly significant changes to each park debuting in 2016.  It would be fascinating to hear thoughts from the players on the extreme differences found above as well.  The fact that each park is so different is part of baseball’s appeal to me.  Every game really is totally unique, all the way down to the field itself.


David Price Is About to Go Off

View post on imgur.com

On June 25, this was David Price’s tweet to family, friends and fans.  It was a clear signal that he knew the patience of the Boston fans and media was wearing thin.

Fast forward to the All-Star break and his “Made for TV” stats (those that casual fans know best) are underwhelming: a 9-6 record with a 4.34 ERA, which is worse than the MLB average of 4.23.  It’s not so much his ERA that’s the problem to fans, but more his inability to be consistent from start to start.  Price has three starts of six-plus innings allowing two or fewer runs, but also has four starts of allowing six or more runs.  With the rest of the rotation producing an atrocious 4.86 ERA, the Sox desperately needed Price to be the one to stop the bleeding, something he hasn’t been able to do.  But that doesn’t mean his underlying skills have deteriorated and all of a sudden he’s become a league-average pitcher.  In fact, the advanced metrics say he’s been extremely unlucky and that he’s due for a big second half. 

View post on imgur.com

* Rank is solely being used to establish a baseline for Price as a top 10 pitcher.

In 2014 and 2015 combined, Price was ranked in the top 10 of all pitchers in four of the skill-based statistics: K%, BB%, xFIP and SIERA (the latter two being ERA estimators with a weighting towards more pitcher-controlled outcomes).  Through the 2016 All-Star break, Price has maintained or improved his top-10 rank in K%, xFIP and SIERA but dropped a few spots in walk rate.  Despite the move from 9th to 10th in K% rank, his K rate is actually up from 26.2% to 27.1%.  The reason for the drop in rank is that 2016 newcomers to the list Jose Fernandez, Noah Syndergaard and Drew Pomeranz did not meet the minimum innings qualifier for the 2014/2015 combined list.  On the flip side, Price’s xFIP and SIERA are higher than they were the past two years, but he has improved his ranking versus his peers.  This is because xFIPs and SIERAs are both up 10% league-wide versus last year (due to all the home runs being hit) while Price’s increases are smaller.

So what is happening?  If his base skills are fine, why is his ERA so high and his performance so inconsistent?

View post on imgur.com

So everyone is familiar with ERA and can easily infer that 4.34 is no bueno for a $217-million pitcher.  But there is a reason these stats are labeled “Non Skill-Based” — that’s because these stats are influenced by factors outside of the pitcher’s direct control (defense, luck, sequencing, variance, etc…) and therefore have wide variability over small samples.  Three of these stats (HR/FB%, BABIP and LOB%) explain why David Price is a great rebound candidate for the second half.

HR/FB%

Price’s current HR/FB (home runs per fly ball) rate is 15.2% — which is good for being ranked 76th out of 97 qualified starting pitchers.  The past two years combined he ranked 19th.  To put this in context, Price’s career average is 9.4% while the 2016 league average is 12.9%.  Price has never recorded a full season (>150 IP) HR/FB rate higher than 10.5%.  Also, on balls hit into play against Price this year, 31.3% of them are fly balls, the second-lowest rate of his career.  The only season in which he allowed a lower fly ball rate was in 2012 when he won the AL Cy Young award.  Price is giving up fewer fly balls this year, but of the fly balls he is allowing, they are going over the fence at the highest rate of his career.  Those that remember Price giving up a HR in 10 consecutive starts this year are nodding violently right now.  His HR/FB% will regress towards his career norm (9.4%) and this should be the main reason for a big second half.

BABIP

Price is also suffering from an unsustainable BABIP (batting average on balls in play).  His current mark of .321 is well above his career rate (.289) and even above his highest full-season rate (.306).  Once a ball is put into play it is out of the pitcher’s control what happens from there.  This is why defense and luck influence this stat more than skill.  And with that said, statistical outliers here tend to regress towards career norms.  Even though Price is allowing ground balls at a higher rate than the past two years, his 2016 GB% is still lower than his career average.  BABIP can be influenced by the number of ground balls a pitcher allows, but he’s not allowing vastly more than his career average.  His BABIP should have some positive regression in it, which is another predictor of improved second-half performance.

LOB%

Price’s Left-On-Base% (percentage of runners a pitcher strands over the course of a season) is currently 70.9%, which is also below his career rate (74.7%) and would be his second worst full-season rate (70.0%) if the season ended today.  Similar to HR/FB%, he is ranked 73rd out of 97 qualified starting pitchers.  The past two years he ranked 22nd.  A pitcher with a higher than average strikeout rate should be able to sustain a slightly higher than average LOB%, but it’s playing out the exact opposite way for Price.  This is partly due to his inflated BABIP and HR/FB%; as these statistics continue to regress towards his career norms, the LOB% will creep up to expected levels.


Much has been made of Price’s velocity being down this year compared to any point in his career.  At the start of the season, his velocity was over 2.0 MPH lower than his career average (94.1).  He has since closed this gap almost entirely.  Here is his average fastball velocity by month (with number of starts):

April: 92.0 (5)

May: 92.5 (6)

June: 92.9 (6)

July: 94.0 (2)

If this upward trend in velocity stabilizes somewhere at or above 93.5, then nearly all the performance metrics within his control — velocity, K%, BB%, xFIP and SIERA — will be at or near his career norms.

Let’s dive a little deeper into that early-season velocity issue.  Below are two charts.  The first shows combined performance of 2014 and 2015 for ERA-qualifying starters while the second chart is the same data for the 2016 season through the All-Star break.  The orange circle is David Price.  The red circle (if shown) represents Price’s career average.  The blue circles are a hand selected peer group of the top 10 pitchers in the game (Kershaw, Sale, Arrieta, Scherzer, Bumgarner, Greinke, Strasburg, Syndergaard, Salazar and Fernandez).  Remember those rankings where Price was right around the top 10 — these are the guys usually outperforming him.  The gray circles represent everyone else.  Note: For these first two charts the top-right quadrant is Good, and the bottom-left quadrant is Bad (unless you’re a knuckleballer).

2014-2015 K/9 vs FBv

View post on imgur.com


2016 K/9 vs FBv

View post on imgur.com

The first graph shows David Price clustered where you would expect him — right at the middle-to-bottom of his top-10 peer group, with a healthy average fastball velocity and K/9.  The second graph (2016) shows Price in a similar relationship to his peers, but with slightly lower velocity and a higher K/9.  Note the gap between the orange (Price’s 2016) and red (Price’s career average) dots depicting his improved strikeout numbers this year despite the slightly lower velocity.  This graph also shows what freaks Noah Syndergaard, Jose Fernandez and (to a lesser degree) Jered Weaver are.

The final two graphs show the relationship between ERA and xFIP where xFIP is the more predictive estimator of a pitcher’s skill.  The bottom-left quadrant is Good (think Kershaw) and the upper-right quadrant is Bad (think Buchholz).  Anyone in the upper-left quadrant (Price in 2016) is a candidate for positive regression.

2014-2015 ERA vs xFIP

View post on imgur.com


2016 ERA vs xFIP

View post on imgur.com

The first graph again shows Price in his usual place — at the tail end of the top 10.  In 2014 and 2015 combined he had a very similar ERA (2.88) and xFIP (2.98).  The second graph (2016) shows the disparity between his ERA (4.34) and xFIP (3.16).  Pitchers with this large of a gap between ERA and xFIP are great candidates for regression.  The important takeaway is that his xFIP, relative to his peers, has stayed in that top-10 range.  This supports the point that some bad luck is the main element depressing his ERA.

David Price can easily be the best pitcher in the American League over the next two and a half months.  He already owns the lowest xFIP in the AL at 3.16 — the next-closest is Corey Kluber, at 3.34.  The skills above show he can sustain the xFIP level, but with some change in luck and maintaining his improved velocity, he doesn’t need to “pitch better”; he just needs to keep pitching — and the results will follow.


Can First-Half (x)FIP Predict Second-Half ERA?

This article was originally published on Check Down Sports

Predictions are hard. Getting them right is harder. But everyone loves them, so I’m going to attempt to predict which starting pitchers will improve in the second half of the season, and which are poised to put up worse numbers. This information may be especially helpful for a GM thinking about acquiring a pitcher before the trade deadline, or, maybe more applicably, a fantasy owner trying to surge his team into playoff position.

How do you exactly predict starting-pitcher performance in MLB? Well, it’s pretty commonly known among baseball-thinkers that FIP is more accurate at predicting a subsequent year’s ERA than ERA itself. FIP is a statistic on an ERA-scale that only accounts for what the pitcher can control (strikeouts, walks, and home runs). There’s been a lot of research that looks at differences between ERA and FIP, but to my knowledge, there’s nothing out there to see if it can predict second-half performance. So that’s what I’m going to do here.

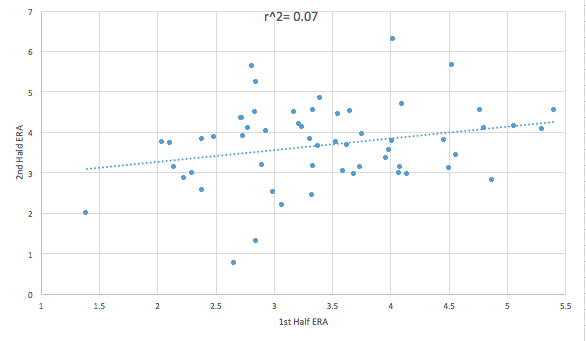
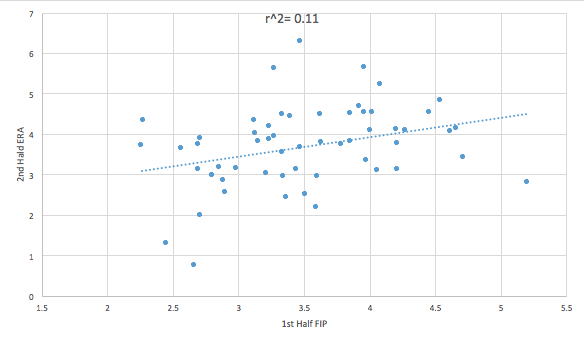
I compiled all the starting pitchers who were qualified in both the first and second halves of 2015 (57 total), and ran a basic scatter plot of their first-half ERA, FIP, and xFIP against second-half ERA, to see which of the former was best at predicting the latter.

First-Half ERA and Second-Half ERA

ERA_ERA

First up is first-half ERA and second-half ERA. A fairly weak correlation — 7% of a pitcher’s second-half ERA is explained by his first-half ERA — albeit significant (p-value < 0.10).

First-Half FIP and Second-Half ERA

FIP_ERA

Next is first-half FIP and second-half ERA. It’s hard to tell but the dots are, on average, a bit closer to the fit line — 11% of second-half ERA is explained by first-half FIP (p-value < 0.05).

First-Half xFIP and Second-Half ERA

xFIP_ERA

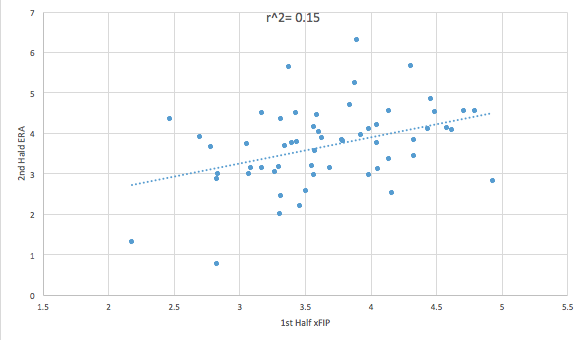
Lastly, we have first-half xFIP and second-half ERA. While FIP uses a pitcher’s actual home-run totals, xFIP uses league-average totals because home run rates fluctuate year-to-year. You can clearly see the dots are much closer to the fit line than in the previous two graphs — 15% of second-half ERA is predicted by first-half xFIP (p-value < 0.01).

Is 15% good? Using the same method as above, I looked at the correlation between 2014 xFIP and 2015 ERA — and found an r² of 27%. So while half-season predictions don’t seem to be as accurate as season-to-season predictions, if MLB teams are making real moves based on a 27% correlation, I’m going to take a leap and say my fantasy team can makes moves based on a 15% correlation.

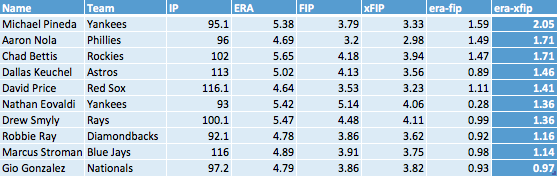
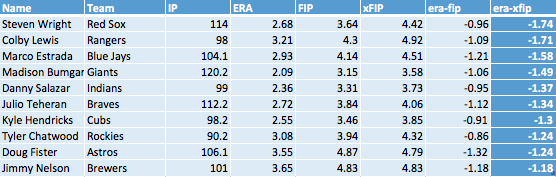
Now the part you (and I) have been waiting for: Here are the top 10 pitchers poised for second-half improvement followed by the top 10 pitchers who may get worse (sorted by the difference between ERA and xFIP, as of 7/9).

Screen Shot 2016-07-11 at 5.04.32 PM

Screen Shot 2016-07-11 at 5.06.34 PM

Some interesting things to note on the first list:

  • Smyly is owned in 48% of Yahoo Fantasy leagues, Nola in 47%, Ray in 11%, and Bettis in 4%. Pick them up.
  • The rest could be solid buy-low trade options (minus Eovaldi, unless your league values middle relievers).
  • A common theme among the members are high BABIPs and home-run rates (>.300, >15%) — which suggests they have been victims of bad luck.

And the second list, where the opposites are mostly true:

  • While Teheran’s name has come up in trade talks, his numbers suggest he may regress in the second half.
  • Sell-high trade options in fantasy leagues.
  • Low BABIPs and home-run rates (<.275, <10%).

Updating Hitter xISO and Second-Half Predictions

In late May, I posted a version of expected ISO (xISO), inspired by Alex Chamberlain’s work, which incorporated the publicly available Statcast data, easily accessible from the Baseball Savant leaderboard. I’ve been tinkering with it since, and figured I would post an updated version, as well as some second-half predictions based on the current “leaders and laggards”.

MODEL UPDATE

The original version of xISO was a simple linear regression model using GB% and average LD/FV exit velocity (LDFBEV). The only feature of any real note was the inclusion of the square of LDFBEV as an additional term. I knew then that I could get better correlation to data if I used LD% and FB% and removed GB% from the model, but I thought the simpler model would be better. I also thought it would be weird to have LD% and FB% as separate terms, and then one combined term for average exit velocity. I guess I just changed my mind. Whatever, it’s all empirical, and the only rule is it has to…predict better. Let’s examine the model, again trained on 2015 qualified hitters, and using LD% and FB% instead of GB%.

New xISO Model, Trained on 2015 Data

As you can see, the coefficient of determination went up a little bit from the previous version. It’s not a big deal, but it’s basically free, so we’ll take it. The updated model equation is as follows:

Now, we also have a fair bit of data for this year. I don’t yet want to update the model parameters using 2015 and 2016 data to train, but I will at least check how the model correlates to this year’s outcomes so far. I arbitrarily selected a minimum of 175 batted ball events (BBE), which limits the pool to 141 players, as of July 8th.

2016 xISO

Look at that! Not too bad overall. Armed with some confidence in the method, let’s now take a look at some of the hitters who most over- and under-performed xISO in the first half (numbers current as of July 9). I will also attempt to avoid talking about any of the players I mentioned previously, or that Alex mentioned in his June xISO report.


OVERPERFORMERS

Jay Bruce: ISO = .274,  xISO = .187

Bruce is actually hitting his line drives and fly balls with less authority than last year (92.8 mph down from 93.2). His overall batted-ball profile looks similar as well. After a couple down years, it’s nice to see Bruce succeeding, but I’m not betting on it to continue.

Anthony Rizzo: ISO = .282,  xISO = .201

At the risk of enraging my pal, league-mate, and curator of Harper Wallbanger, we might need to calm down a little bit on Rizzo. Don’t get me wrong, I think he’s a very good player, but odds are he won’t continue to hit for quite this much power.

Jake Lamb: ISO = .330,  xISO = .256

Right now, Jake Lamb is second in the majors in ISO behind David Ortiz. He does hit the ball hard (97.9 mph LDFBEV), but he hits 46% of his balls on the ground. Even a .256 ISO would be quite good, given his decent walk rate. This will likely go down as a true breakout season for Lamb.

Wil Myers: ISO = .242,  xISO = .188

While some of the guys on this list play in hitters’ parks, Myers is an example of a first half overperformer in a pitcher’s park. Between expected power regression and his spotty injury history, I’m nervous about the second half.


UNDERPERFORMERS

Andrew McCutchen: ISO = .165,  xISO = .233

Now, ‘Cutch is hitting more popups this year than last year, which could be fooling xISO a bit. Still, I like his ISO to get back to around .200. Of more concern might be his spike in strikeouts.

Ryan Zimmerman: ISO = .181,  xISO = .236

Zimmerman’s exit velocity is up from last year (96.8 mph from 95.0). He probably won’t hit for average, but if he continue making hard contact, he should accumulate plenty of RBIs in the second half.

Yasiel Puig: ISO = .133,  xISO = .188

xISO basically expects Puig to get back to his career average of .183. My main worry with the burly Cuban is his struggle to maintain a healthy pair of hamstrings.

Colby Rasmus: ISO = .157,  xISO = .211

At this point, we basically know who Rasmus is. He is a player who consistently sports an ISO over .200. After a bump in fly balls last year, he’s sitting below his career average this season. That’s not ideal for power output, but he’s also hitting the ball a bit harder. I’ll still bet on him doubling his homer total over the remainder of the season, and surpassing 20 for the second season in Houston.


That’s it! Please feel free to to leave comments, questions, or suggestions for improvement. I’m working on a public document with the xISO calculation available for every player, updated daily-ish. Feel free to follow me on Twitter for updates, or badger me in the comments.


Hardball Retrospective – What Might Have Been – The “Original” 2004 Royals

In “Hardball Retrospective: Evaluating Scouting and Development Outcomes for the Modern-Era Franchises”, I placed every ballplayer in the modern era (from 1901-present) on their original team. I calculated revised standings for every season based entirely on the performance of each team’s “original” players. I discuss every team’s “original” players and seasons at length along with organizational performance with respect to the Amateur Draft (or First-Year Player Draft), amateur free agent signings and other methods of player acquisition.  Season standings, WAR and Win Shares totals for the “original” teams are compared against the “actual” team results to assess each franchise’s scouting, development and general management skills.

Expanding on my research for the book, the following series of articles will reveal the teams with the biggest single-season difference in the WAR and Win Shares for the “Original” vs. “Actual” rosters for every Major League organization. “Hardball Retrospective” is available in digital format on Amazon, Barnes and Noble, GooglePlay, iTunes and KoboBooks. The paperback edition is available on Amazon, Barnes and Noble and CreateSpace. Supplemental Statistics, Charts and Graphs along with a discussion forum are offered at TuataraSoftware.com.

Don Daglow (Intellivision World Series Major League Baseball, Earl Weaver Baseball, Tony LaRussa Baseball) contributed the foreword for Hardball Retrospective. The foreword and preview of my book are accessible here.

Terminology

OWAR – Wins Above Replacement for players on “original” teams

OWS – Win Shares for players on “original” teams

OPW% – Pythagorean Won-Loss record for the “original” teams

AWAR – Wins Above Replacement for players on “actual” teams

AWS – Win Shares for players on “actual” teams

APW% – Pythagorean Won-Loss record for the “actual” teams

Assessment

The 2004 Kansas City Royals 

OWAR: 40.4     OWS: 264     OPW%: .483     (78-84)

AWAR: 16.8      AWS: 173     APW%: .358     (58-104)

WARdiff: 23.6                        WSdiff: 91  

The “Original” 2004 Royals placed third in the American League Central division, 12 games behind the Indians. The “Actual” 2004 Royals lost 104 contests. Carlos Beltran (.267/38/104) enjoyed a monster campaign as he narrowly missed the 40/40 club. The Royals center fielder compiled 121 tallies and swiped 42 bags in 45 attempts. However he only earned 11.4 Win Shares for the “Actual” Royals (vs. 29 WS for the “Originals) due to a mid-season trade to the Houston Astros. Fellow outfielder Jeff Conine contributed 35 doubles while first-sacker Mike Sweeney went yard on 22 occasions.

Juan Gonzalez of the “Actuals” placed 52nd in the “The New Bill James Historical Baseball Abstract” top 100 player rankings. 

  Original 2004 Royals                                    Actual 2004 Royals

LINEUP POS OWAR OWS LINEUP POS AWAR AWS
Jeff Conine LF 2.29 14.93 David DeJesus LF/CF 0.65 8.92
Carlos Beltran CF 6.77 29.02 Carlos Beltran CF 2.78 11.47
Michael Tucker RF 1.25 14.12 Matt Stairs RF 0.12 10.96
Johnny Damon DH/CF 4.34 25.1 Ken Harvey DH/1B 0.42 9.33
Mike Sweeney 1B 1.9 12.49 Mike Sweeney 1B 1.9 12.49
Ruben Gotay 2B -0.41 2.79 Tony Graffanino 2B 0.27 6.56
Ramon Martinez SS 0.21 5.64 Angel Berroa SS 0.38 10.55
Joe Randa 3B 0.35 13.1 Joe Randa 3B 0.35 13.1
Brent Mayne C -0.39 3.69 John Buck C 0.32 4.67
BENCH POS OWAR OWS BENCH POS AWAR AWS
Ken Harvey 1B 0.42 9.33 Desi Relaford 3B -1.07 3.69
David DeJesus CF 0.65 8.92 Benito Santiago C 0.04 3.4
Andres Blanco SS 0.5 2.32 Alberto Castillo C 0.6 2.96
Juan Brito C -0.83 2.29 Calvin Pickering DH 0.3 2.94
Dee Brown LF -0.71 2.24 Ruben Gotay 2B -0.41 2.79
Kit Pellow RF -0.59 1.08 Juan Gonzalez RF 0.12 2.69
Shane Halter 3B -0.19 1.05 Abraham Nunez RF -0.47 2.58
Alex Prieto 2B -0.03 0.75 Andres Blanco SS 0.5 2.32
Matt Treanor C -0.11 0.51 Kelly Stinnett C 0.48 2.27
Byron Gettis LF -0.08 0.38 Dee Brown LF -0.71 2.24
Alexis Gomez LF -0.07 0.29 Aaron Guiel LF -0.55 0.49
Mendy Lopez 2B -0.5 0.22 Ruben Mateo RF -0.72 0.43
Brandon Berger LF -0.33 0.2 Byron Gettis LF -0.08 0.38
Donnie Murphy 2B -0.25 0.2 Alexis Gomez LF -0.07 0.29
Raul Gonzalez RF -0.16 0.12 Jose Bautista 3B -0.23 0.27
Paul Phillips C 0 0.1 Mendy Lopez 2B -0.5 0.22
Mike Tonis C -0.11 0.03 Brandon Berger LF -0.33 0.2
Larry Sutton 1B -0.01 0.03 Donnie Murphy 2B -0.25 0.2
Wilton Guerrero 2B -0.22 0.18
Paul Phillips C 0 0.1
Adrian Brown LF -0.07 0.08
Mike Tonis C -0.11 0.03
Rich Thompson RF -0.03 0.02
Damian Jackson RF -0.12 0.01

Jon Lieber recorded 14 victories and yielded only 18 bases on balls in 27 starts. Glendon Rusch fashioned a 3.47 ERA as he split time between starting and relief roles. Zack Greinke delivered 8 victories and a 3.97 ERA in his inaugural season. Tom “Flash” Gordon (9-4, 2.21) whiffed 96 batsmen in 89.2 innings and achieved All-Star status.

  Original 2004 Royals                                  Actual 2004 Royals

ROTATION POS OWAR OWS ROTATION POS AWAR AWS
Jon Lieber SP 2.87 10.43 Zack Greinke SP 3.62 9.73
Glendon Rusch SP 3.02 10 Jimmy Gobble SP 0.87 5.37
Zack Greinke SP 3.62 9.73 Dennys Reyes SP 0.79 4.58
Jimmy Gobble SP 0.87 5.37 Jeremy Affeldt SP 0.11 4.42
Jeremy Affeldt SP 0.11 4.42 Darrell May SP -0.05 4.07
BULLPEN POS OWAR OWS BULLPEN POS AWAR AWS
Tom Gordon RP 3.66 15.47 Shawn Camp RP 0.17 4.15
Dan Miceli RP 0.73 7.13 Jaime Cerda RP 0.69 4.05
Lance Carter RP 0.76 6.53 Nate Field RP 0.07 3.02
Kiko Calero RP 0.7 5.7 Scott Sullivan RP 0.12 2.85
Orber Moreno RP 0.08 2.84 Jason Grimsley RP 0.59 2.55
Wes Obermueller SP -0.01 2.98 Brian Anderson SP -0.71 2.84
Ryan Bukvich RP 0.12 0.82 Mike Wood SP 0.24 1.91
Chad Durbin RP -1.03 0.39 Jimmy Serrano SP 0.5 1.57
Rodney Myers RP 0.06 0.29 D. J. Carrasco RP -0.12 1.54
Jason Simontacchi RP -0.28 0.26 Rudy Seanez RP 0.32 1.45
Mike MacDougal RP -0.13 0.23 Ryan Bukvich RP 0.12 0.82
Kevin Appier SP -0.44 0 Mike MacDougal RP -0.13 0.23
Chris George SP -0.82 0 Kevin Appier SP -0.44 0
Jorge Vasquez RP -0.19 0 Denny Bautista SP -0.07 0
Chris George SP -0.82 0
Justin Huisman RP -0.51 0
Matt Kinney RP -0.43 0
Curt Leskanic RP -0.64 0
Jorge Vasquez RP -0.19 0
Eduardo Villacis SP -0.22 0

Notable Transactions

Carlos Beltran

June 24, 2004: Traded as part of a 3-team trade by the Kansas City Royals to the Houston Astros. The Oakland Athletics sent Mark Teahen and Mike Wood to the Kansas City Royals. The Houston Astros sent Octavio Dotel to the Oakland Athletics. The Houston Astros sent John Buck and cash to the Kansas City Royals.

Johnny Damon

January 8, 2001: Traded as part of a 3-team trade by the Kansas City Royals with Mark Ellis to the Oakland Athletics. The Oakland Athletics sent Ben Grieve to the Tampa Bay Devil Rays. The Oakland Athletics sent Angel Berroa and A.J. Hinch to the Kansas City Royals. The Tampa Bay Devil Rays sent Cory Lidle to the Oakland Athletics. The Tampa Bay Devil Rays sent Roberto Hernandez to the Kansas City Royals.

November 5, 2001: Granted Free Agency.

December 21, 2001: Signed as a Free Agent with the Boston Red Sox.

Tom Gordon

October 30, 1995: Granted Free Agency.

December 21, 1995: Signed as a Free Agent with the Boston Red Sox.

November 1, 2000: Granted Free Agency.

December 14, 2000: Signed as a Free Agent with the Chicago Cubs.

August 22, 2002: Traded by the Chicago Cubs to the Houston Astros for players to be named later and Russ Rohlicek (minors). The Houston Astros sent Travis Anderson (minors) (September 11, 2002) and Mike Nannini (minors) (September 11, 2002) to the Chicago Cubs to complete the trade.

October 29, 2002: Granted Free Agency.

January 23, 2003: Signed as a Free Agent with the Chicago White Sox.

October 27, 2003: Granted Free Agency.

December 16, 2003: Signed as a Free Agent with the New York Yankees.

Honorable Mention

The 2009 Kansas City Royals 

OWAR: 45.7     OWS: 268     OPW%: .544     (88-74)

AWAR: 25.3       AWS: 194      APW%: .401    (65-97)

WARdiff: 20.4                        WSdiff: 74

Kansas City clinched the American League Central division title by a lone game over Minnesota. Zack Greinke (16-8, 2.16) merited the 2009 AL Cy Young Award as he paced the Junior Circuit in ERA and WHIP (1.073) while posting career-highs in strikeouts (242) and innings pitched (229.1). Johnny Damon (.282/24/82) tied his personal-best in home runs, slashed 36 two-base hits and registered 107 tallies. Billy Butler aka “Country Breakfast” drilled 51 doubles and swatted 21 big-flies. David DeJesus contributed 13 jacks and knocked in 71 runs. Carlos Beltran supplied a .325 BA but missed more than two months of the season due to injury. J.P. Howell saved 17 contests and collected 7 victories as the Royals’ relief ace.

On Deck

What Might Have Been – The “Original” 1969 Reds

References and Resources

Baseball America – Executive Database

Baseball-Reference

James, Bill. The New Bill James Historical Baseball Abstract. New York, NY.: The Free Press, 2001. Print.

James, Bill, with Jim Henzler. Win Shares. Morton Grove, Ill.: STATS, 2002. Print.

Retrosheet – Transactions Database

The information used here was obtained free of charge from and is copyrighted by Retrosheet. Interested parties may contact Retrosheet at “www.retrosheet.org”.

Seamheads – Baseball Gauge

Sean Lahman Baseball Archive


The Good and the Bad: David Price Isn’t Sinking

You know his story: David Price is a $217-million man with a 4.74 earned run average, and the people of Boston aren’t happy. It’s another Crawford-Sandoval-Ramirez waste of money. Things are headed downhill for the 31-year old veteran. Or are they?

First, the bad news: the 2016 version of David Price has been worse than the 2015 David Price, and way worse than the top-caliber pitcher Boston signed him to be. And the ERA shows it.

The suspect is pitch selection, and the culprit is a sinker that doesn’t sink. Price has a two-seam fastball that over his seven-year career he has thrown some 30% of the time. In his prime, it clocked in at 94-95 mph, but since then he’s dropped almost two mph.

Usually, that level of velocity leak wouldn’t be a big deal, because if there’s enough movement and deception, batters will be fooled either way. But Price’s sinker is different.

Brooks Baseball reports that “His sinker has well above-average velocity, but has little sinking action compared to a true sinker and results in more fly balls compared to other pitchers.” Uh-oh. “Little sinking action?” There needs to be at least some element of vertical movement for a sinker to be fully effective, or, in Price’s case, a little extra velocity. But now he has neither.

The results show it. Last month, he surrendered 10 home runs, more than the previous two months combined. Also in June: 31% of his pitches were sinkers, nearly 10% more than the month before. Coincidence? I think not. He’s also allowing a .241 Isolated Power on sinkers, only three points less than Mike Trout this season. And maybe the most convincing statistic: hitters are pulling the ball 10% more than they did last year, which means they are making more solid contact and not having to stay back on his fastball. Price’s pitches are slower, and it’s making a difference.

Why is he losing velocity? There’s two possibilities and they point in completely opposite directions. The first is age. Price is 31 and he’s nearing the point where most starting pitchers start to fall on the aging curve and eke velocity. If this is the case, it’s going to be a long seven years for the Red Sox. But there is another possibility. Price has played in Tampa Bay for most of his career, where the temperatures are never 40 degrees like Boston in April. It’s entirely possible that the cold ‘froze’ him up this spring and as the season continues, he’ll regain his speed. Most likely, it’s a combination of both. But either way, it’s never a good sign when pitchers slow down.

Price has always gotten away with leaving sinkers up in the zone because they showed 94-95 mph on the radar gun. But now hitters are seeing 92mph fastballs fly straight down the middle of the plate and stay there.  Why doesn’t he just put the ball on a tee? Nine out of 10 major-league hitters will knock that pitch into the stands every time. Just look at the stats: He’s surrendered just two fewer home runs than he did last season even though he’s pitched 112 fewer innings (2015: 17, 2016: 15), and he’s allowed an average of 1.25 home runs per nine innings, which is 32 percent worse than his career average (0.84). Sinkers are sending the man to his grave.

They’re also killing his ERA. 38% of his earned runs are from home runs, and if you set his home runs to eight instead of 17, his ERA would be 4.01 instead of 4.74, a 0.73 difference. (8 is the number he had allowed last year at this point in the season.) In fact, his strikeout and walk totals are even better than last season, but the home runs negate all of it.

But we can’t blame everything on the sinker, either. Price has definitely been unlucky this season. His home run to fly ball ratio is 15.5%, an unsustainable mark, his .323 BABIP .035 more than his career average, and his LOB% 10 percent less than the 2016 league average. These will balance out in time. But his sinker is the real problem.

The only way to truly limit home runs is to limit fly balls, and for Price, the only way to limit fly balls is to stop throwing sinkers that don’t sink. The solution is (1) throw harder, or (2) find another pitch to replace his sinker. Option one is still TBD. Option two could be filled with either a change or slider — two pitches that he has used to complement his fastball but never to the level that he uses his sinker. The outlook is grim either way.

Price is still a very experienced pitcher, and once his HR/FB, LOB%, and BABIP rates come down to earth, things will even out. But if he wants to be successful for the Red Sox for the entirety of his stay, there’s a longer-term issue at stake, and if his velocity continues to leak, I’m not sure what type of David Price we’ll be looking at a year from now.


Over- and Under-achieving FIP

I have always been fascinated by pitchers that consistently post ERAs that differ significantly from their FIPs.  As a Braves fan, this interest is particularly relevant in the valuation of ace/not ace Julio Teheran.  Unfortunately for me — but very fortunately for readers — Eno Sarris tackled the specific case of Teheran and the more general case of FIP-beaters with high pop-up rates here before I could finish this post.  Regardless, the research is done, and I believe it is still relevant.

While Eno focused on a specific subset of FIP-beaters in his discussion of Teheran, I wanted to examine pitchers with extreme ERA/FIP gaps more broadly.  I included not only pitchers who overachieved based on FIP, but also those who underachieved.  I began with a sample of all pitchers since 1960 who reached 500 IP through age 25.  I then calculated the difference between ERA- and FIP- for each pitcher (FIP overachievers would have a negative number, underachievers positive).  I selected these metrics 1) because they were readily available here at FanGraphs, and 2) because I was interested in the gap relative to league average — hopefully stripping out any differences in era (should any even exist).  

I chose this age cutoff so that I had a sample of three “in-prime” seasons afterwards (age 26-28) to compare to the initial numbers below.  After I found Z-Scores for all of the u25 pitchers, I set the threshold for over/underachiever at +/- 1 standard deviation from the mean, which turned about to be an ERA- / FIP- difference of right around eight.  It is certainly arbitrary, but I felt like this adequately separated the sample so I could examine the ends of the population.

Extreme FIP Over/Underachievers
Group ERA- minus FIP- n
ALL u25 -.02 297
Overachievers (Z<1) -11.91 48
Underachievers (Z>1) 11.35 47
Since 1960, min. 500 IP through age 25.  Average ERA- minus FIP- weighted for IP.

As you can see, the spread in ERA- between over/underachievers is pretty large.  Overachievers posted ERAs 12% lower (relative to league average) than expected based on FIP, while underachievers posted ERAs over 11% higher (relative to league average) than expected based on FIP.  The group as a whole posted an ERA- nearly identical to its FIP-, which is more in line with DIPS theory expectations.

The big question remains: how “sticky” is the gap between ERA- and FIP-?  To determine this, I compared the ERA- / FIP- gap for these same samples from age 26-28.

Extreme FIP Over/Underachievers Age Comparison
Group u25 E-F- o25 E-F- Raw Diff Diff Adj. for Sample Avg. % Retained
ALL -.02 .42 -.44
Overachievers (Z<1) -11.91 -3.41 -8.50 -8.06 32.3%
Underachievers (Z>1) 11.35 4.64 6.71 7.15 37.0%
Since 1960, min. 500 IP through age 25.  Average ERA- minus FIP- weighted for IP.

From age 26-28, the sample as a whole posted an ERA- above its FIP-.  Even adjusting for that change, the over/underachievers both regressed heavily towards the mean, retaining 32.3% and 37.0% of their difference in ERA- and FIP- respectively.  While regression is powerful, both samples did continue to post differences in ERA- and FIP-.  The overachievers continued to post lower ERAs than FIPs, while the underachievers kept on allowing more runs than FIP suggested they deserved.  Interestingly, the percentage of the gap retained is similar for over and underachievers, though it is slightly smaller for FIP beaters.

The methodology isn’t perfect, but I found the results very compelling.  It does seem like consistently beating FIP is partially skill (which jibes with Eno’s results), and consistently allowing ERAs above FIPs is more than just bad luck.  As usual, this analysis leads to more questions than answers.  How many innings are needed before one can be considered a DIPS outlier?  Do FIP underachievers actually regress less than FIP beaters?  How does age-related decline affect the gap in ERA- and FIP-?  As the sample for a DIPS outlier grows, does he retain more of the difference going forward?  Etc.  I may try to dive into one or more of those questions later.  For now, hopefully this analysis is helpful as you consider how likely a pitcher on your team is to continue over/underperforming his FIP.


We’re In a Golden Age of the Lefty Fastball

The 2016 baseball season is well underway and we’re seeing an even more drastic version of the trends that we saw last year: There are more strikeouts, more home runs, and more challenges. And, notably, there has also been a steady increase in velocity across the league, assisted by the guys I’ll be highlighting here.

A “steady increase in velocity” might not be reason to stop the presses, but just soak in this Tweet real quick:


We’re basically seeing twice as many pitches thrown 95+ as we were in 2008. ¡2008!

Even left-handers, typically a step behind (always a bit of a quirky species, lefties), are chucking it. Across the league, lefties are throwing the ball 95+ mph just around 7.5% of the time. That’s way more often than the stereotype of the Tom Glavine-y, soft-tossing corner-nibbler would have you believe, but it’s 2016 and elite velocity isn’t just left to the elite pitchers anymore (Chris Sale is joined in that 95+ lefty fastball club by some guy named Buddy Boshers out of the bullpen for the Twins).

So…I’m not just interested in guys that throw hard; I want guys who throw hard and make the ball move, and I want them to be left-handed. (Truth: that lefty requirement is mostly an excuse so I can hopefully talk about Danny Duffy more, James Paxton for the first time, and because I already covered the right-handed side of things with my Charlie Morton post from the start of the season (The Unbelievable Emergence of Charlie Morton), and basically because lefties are more fun.)

A common refrain among pitching coaches is that movement is just as important as velocity. Velocity can get you to the majors, but big-league hitters will turn around 95+ fast if it’s straight. But when combined with some movement (and even better, control/command) 95+ is a high value commodity.

I’m after what I want to dub the best lefty fastball. Let’s start with the simple stuff: Who out there is throwing it 95+ most frequently? Note that the percentages here are for all pitches thrown, including the off-speed stuff.

Player Name Number of Pitches 95+ % of Pitches Thrown 95+
Zach Britton 152 93%
Sean Doolittle 118 84%
Aroldis Chapman 125 80%
Jake Diekman 111 73%
James Paxton 332 64%
Justin Wilson 81 62%
Josh Osich 58 57%
Enny Romero 86 54%
Tony Cingrani 102 53%
Jake McGee 32 51%
Danny Duffy 211 49%
Ian Krol 68 45%
Robbie Ray 208 41%
Felipe Rivero 61 35%
Sammy Solis 51 30%
Andrew Miller 52 30%
Andrew Chafin 6 26%
Carlos Rodon 90 23%
Blake Snell 45 23%

There are a number of relievers in there that I should probably get to know better. Zach Britton, Sean Doolittle, and Aroldis Chapman have all been flame-throwers for a while now; somehow their gas no longer brings the flicker to my eye that it once did. But Josh Osich and Enny Romero? Those are new guys that throw quite hard and are likely on their way to relevance.

The starters on the list are the most fun for me. James Paxton is there. Danny Duffy, too. But so are Carlos Rodon and Blake Snell. I’m not going to anoint any of these young guys just yet, but I’d venture that it’s been a long time since we’ve had four lefty starters out there throwing 95+ mph heaters at least 23% of the time. But…Carlos Rodon has a 4.16 ERA, and the other three all have fewer than 10 starts on the season. Let’s see if movement has anything to do with it.

We’re in search of the best lefty fastball and the best lefty fastball must move sideways, while also moving quickly. 10 inches of run seems like a pretty good place to set up camp.

Player Name Number of Pitches 95+
& 10+ inches of run
% of All Pitches
Jake Diekman 90 59%
James Paxton 171 33%
Josh Osich 24 24%
Cody Reed 18 20%
Chris Sale 90 16%
Sammy Solis 22 13%
Robbie Ray 58 11%
Brad Hand 26 11%
Clayton Richard 7 11%
Mike Montgomery 22 9%
Martin Perez 42 9%
Steven Matz 23 6%
Ian Krol 8 5%
Andrew Miller 9 5%
Ashur Tolliver 3 5%
Enny Romero 8 5%
Tony Cingrani 7 4%
Zach Britton 6 4%
T.J. McFarland 3 3%
Aroldis Chapman 4 3%
Sean Doolittle 3 2%
Carlos Rodon 8 2%

Look at that: Mr. Rodon and his 4.16 ERA bring up the rear, while Snell and Duffy dropped right off. But man, James Paxton is still up top there just behind Jake Diekman. Diekman is a very good reliever, who seems to be realizing his potential since his trade to Texas. Basically, by exclusively pounding the zone with that hard, running fastball, he’s posted an ERA below 2.00 since getting out of Philly.

Oh! Chris Sale, how did I forget to include him in my love fest of the young lefty starters in the league? Sale has thrown 110 pitches at least 95 mph, and of those, 90 have moved at least 10 inches. That’s nuts. His stuff is incredible.

We also see Steven Matz creep in there as 6% of his pitches are these 95 mph fastballs that move an unfair amount. Matz and his 2.96 ERA definitely belong in that quartet of young insanely talented left-handed starting pitching that I talked about before. He’ll be the fifth member of that group, and we instantly have to expand our Mount Rushmore of tantalizing excellence.

This is starting to feel a bit like the NBA where so much Amazing is happening. But it’s true: there’s a lot of amazing happening across the MLB landscape right now. These lefty fastballs are but one, tiny iota of all that is going on.

Let’s refine the batch of fastballs once more to include only those that have at least 10 inches of vertical movement, too. This admittedly feels like a laughable exercise. There’s no way that pitchers are actually throwing pitches that go 95 mph, while also running and rising that much….

Player Name Number of Pitches 95+
10+ inches of run
10+ inches of rise
Robbie Ray 15
James Paxton 14
Enny Romero 5
Rest of League 25

Oh. Damn. I see you Robbie Ray, James Paxton, and Enny Romero. I also see you Rest of League. That group included Danny Duffy, Sean Doolittle, Aroldis Chapman, Matt Moore, and Chris Sale. But really this is about those top three guys.

Ray was once a prospect known more for his feel and pitchability than a premier fastball. He’s starting for the Diamondbacks now and he’s striking out over 10 per game. His ERA sites at 4.59 and his WHIP is over 1.50, which are both significantly worse than his 2015 campaign, but still, if that pitchability from his earlier career outlook meets with his clearly impressive fastball, things could turn around quickly for the 24-year-old. I’m frankly surprised to see him here.

As for James Paxton, we know he’s throwing way harder now that he’s dropped his arm slot. I’ll save my full review of his stuff for the lengthier look that it deserves.

Then there’s Enny Romero. Romero isn’t well known in baseball circles just yet. He started a single game as a 22-year-old for the Rays back in 2013, spent 2014 throwing a 4.93 ERA in Triple-A, and hasn’t exactly torn things up in the majors since then. But he’s a young player, with a solid baseball name and a clearly electric fastball. He’s 25 and capable of figuring it out just like any other 25-year-old.

To be totally honest, I’m not entirely sure what to do with this group of pitchers. The guys atop this 95/10/10 club clearly have electric fastballs, but the electric fastball has not equated to big-league success so far. I guess that’s OK, and feeds back into the last bit of the the old pitching coach refrain: Velocity is nothing without movement…and control. But control is not sexy.

Speed is sexy, and all these guys throwing 95 are great, but Aroldis Chapman is the only one guy who’s ever thrown it 105 mph. He keeps the crown of best fastball. (All this talk of horizontal and vertical movement was really just an attempt to crown the best non-Chapman lefty fastball.)

So what is the takeaway?

This discussion mostly serves as a friendly reminder that we’re in the midst of a great revolution of left handed pitchers — all of whom make Clayton Kershaw old by comparison. These guys are throwing fastballs harder than we’ve ever seen before and there’s so many of them doing it.

Stat of the Day: I feel like I should also note that I unearthed an insane Andrew Miller pitch where he effectively threw a 95 mph slider on June 6th to some poor soul.