Can First-Half (x)FIP Predict Second-Half ERA?
This article was originally published on Check Down Sports.
Predictions are hard. Getting them right is harder. But everyone loves them, so I’m going to attempt to predict which starting pitchers will improve in the second half of the season, and which are poised to put up worse numbers. This information may be especially helpful for a GM thinking about acquiring a pitcher before the trade deadline, or, maybe more applicably, a fantasy owner trying to surge his team into playoff position.
How do you exactly predict starting-pitcher performance in MLB? Well, it’s pretty commonly known among baseball-thinkers that FIP is more accurate at predicting a subsequent year’s ERA than ERA itself. FIP is a statistic on an ERA-scale that only accounts for what the pitcher can control (strikeouts, walks, and home runs). There’s been a lot of research that looks at differences between ERA and FIP, but to my knowledge, there’s nothing out there to see if it can predict second-half performance. So that’s what I’m going to do here.
I compiled all the starting pitchers who were qualified in both the first and second halves of 2015 (57 total), and ran a basic scatter plot of their first-half ERA, FIP, and xFIP against second-half ERA, to see which of the former was best at predicting the latter.
First-Half ERA and Second-Half ERA
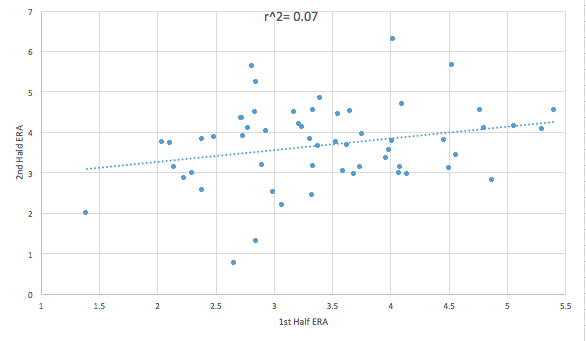
First up is first-half ERA and second-half ERA. A fairly weak correlation — 7% of a pitcher’s second-half ERA is explained by his first-half ERA — albeit significant (p-value < 0.10).
First-Half FIP and Second-Half ERA
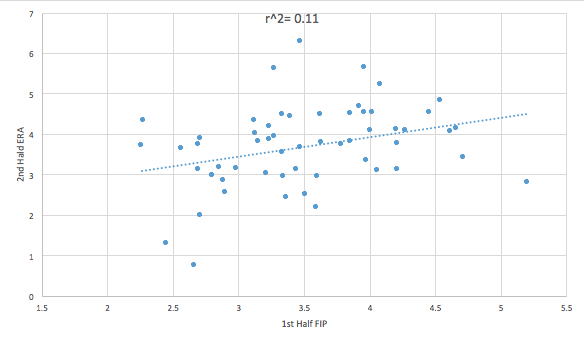
Next is first-half FIP and second-half ERA. It’s hard to tell but the dots are, on average, a bit closer to the fit line — 11% of second-half ERA is explained by first-half FIP (p-value < 0.05).
First-Half xFIP and Second-Half ERA
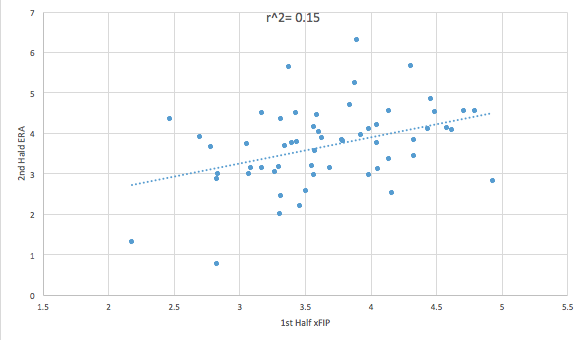
Lastly, we have first-half xFIP and second-half ERA. While FIP uses a pitcher’s actual home-run totals, xFIP uses league-average totals because home run rates fluctuate year-to-year. You can clearly see the dots are much closer to the fit line than in the previous two graphs — 15% of second-half ERA is predicted by first-half xFIP (p-value < 0.01).
Is 15% good? Using the same method as above, I looked at the correlation between 2014 xFIP and 2015 ERA — and found an r² of 27%. So while half-season predictions don’t seem to be as accurate as season-to-season predictions, if MLB teams are making real moves based on a 27% correlation, I’m going to take a leap and say my fantasy team can makes moves based on a 15% correlation.
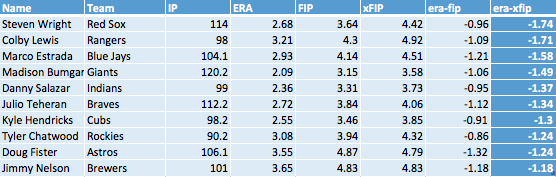
Now the part you (and I) have been waiting for: Here are the top 10 pitchers poised for second-half improvement followed by the top 10 pitchers who may get worse (sorted by the difference between ERA and xFIP, as of 7/9).
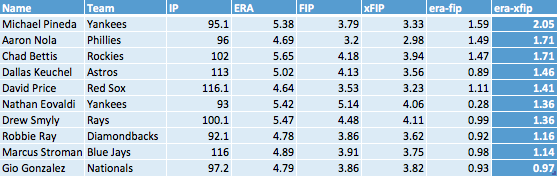
Some interesting things to note on the first list:
- Smyly is owned in 48% of Yahoo Fantasy leagues, Nola in 47%, Ray in 11%, and Bettis in 4%. Pick them up.
- The rest could be solid buy-low trade options (minus Eovaldi, unless your league values middle relievers).
- A common theme among the members are high BABIPs and home-run rates (>.300, >15%) — which suggests they have been victims of bad luck.
And the second list, where the opposites are mostly true:
- While Teheran’s name has come up in trade talks, his numbers suggest he may regress in the second half.
- Sell-high trade options in fantasy leagues.
- Low BABIPs and home-run rates (<.275, <10%).
Steven Wright should probably be taken off the list seeing as knuckleballers don’t usually follow the same rules. Other than that, Nola was really good up until he’s last couple starts when he just absolutely fell apart though that may have some to do with the mediocre defense behind him.
I’ve always liked ERA-xFIP for finding good buy low/sell high candidates, but it’s still important to see if any of that traditional ‘good fortune’ (BABIP and HR/FB) has been luck or earned.
In the case of Kyle Hendricks, he’s 7th best of 145 in average exit velocity (87.0 mph), from pitchers with 150 or more balls in play. He’s 4th on that list for LD/FB EV, and is actually generating more soft contact than hard. Tanner Roark is the only other qualified pitcher doing so this season.
Given Hendricks’ batted ball profile (>50% GB, >10% IFFB), and the performance of the three pitches that make up 92% of his mix – cutter, sinker, change (8th, t-2nd, 1st), he’s probably earning most of the .245 BABIP and 9.4% HR/FB. The BABIP may regress upward, but I could also see his HR/FB dropping a little lower since he’s giving up very little loud contact in the air.
Of the pitchers heavily outperforming their xFIP, he’s one I wouldn’t be so quick to sell high on.
This is some great insight, thanks!
A simple team/park adjustment to xFIP would go a long way to make a more accurate stat for predictions.