Author Archive

NY-Penn League Scouting: Chalmers, Shore, Chatham, Dalbec, and Dawson

I watch a lot of baseball. I get to see a lot of players. Some of them will go on to have productive major-league careers, but most will not. The point of this article is to look at some of those who may, at the the very least, reach the show.

This report comes after observing two NY-Penn League (low-A) series in late August/early Sept. and includes players from the Oakland Athletics, Boston Red Sox, and Houston Astros organizations.

I will introduce each player as follows:

Name, Position, Organization, Organizational Prospect Rank, Age


Dakota Chalmers, RHP, Oakland Athletics, Rank: 9, Age: 19

Chalmers was drafted out of a Georgia high school in 2015. He’s a four-pitch pitcher– fastball, changeup, curveball, slider. Though, there’s only a 2-3 mph difference between his slider and curveball and not much of a visible difference. His fastball sat 91-93 when I saw him last week; I’ve seen him as high as 93-95. He has a high-effort delivery and control remains his biggest issue, which I’d say is a pretty good place to be as a 19-year-old. His fastball and curveball/slider look above-average, while his changeup shows potential but still is inconsistent in terms of location. I imagine he didn’t have to throw it that often in high-school competition last year.


Logan Shore, RHP, Oakland Athletics, Rank: 12, Age: 21

Shore’s strength is his command. His fastball sits 90-92 and he also throws a changeup (his best pitch) and slider. He pounds the zone and shows the ability to throw any pitch for a strike in any count. He made one (big) mistake during his last outing – an opposite-field three-run home run– but otherwise was solid. His slider remains his weakest pitch, but when it’s on (and it mostly is) he sees a lot of quick and easy outs. I would imagine he won’t add much velocity in the future as he’s already filled out, but can still see him being an effective pitcher nonetheless.


C.J. Chatham, SS, Boston Red Sox, Rank: 15, Age: 21

Interestingly, Chatham is a tall (6’4) shortstop whose biggest strength is his defense. Many at his size project better as third basemen, but it looks like Chatham has the ability to stay at short. He uses his long frame well to cover ground and also shows good arm strength. At the plate, the first thing that stood out was his aggressiveness as he swung at seven of nine first pitches. He also showed some line-drive power, hitting two doubles (one over the center fielder’s head and one down the left-field line) in the two games I saw.


Bobby Dalbec, 3B, Boston Red Sox, Rank: 21, Age: 21

This guy hits the ball really really hard. I saw him in eight at-bats – three strikeouts and five very well-hit balls. Even his outs were hit hard. He looks like an all-or-nothing type hitter. Lots of doubles and home runs but a lot of strikeouts. A former pitcher in college, Dalbec definitely has the arm to remain at third base. His range looked good too — he made one nice play to his right, a charging backhand near third base while having to throw across his body to get the out.


Ronnie Dawson, OF, Houston Astros, Rank: 18, Age: 21

Another all-or-nothing-type hitter, Dawson was drafted in the second round of the 2016 draft out of Ohio State. He looks like he could have been a running back at OSU too — standing 6’2 and 225 lbs. His power and bat speed definitely show – he smoked a line-drive double down the right-field line when I saw him. But so do the swings and misses – he struck out in his other three at-bats. Defensively, Dawson projects more as left fielder as his arm and speed aren’t two of his better tools. From the eye test, Dawson reminds me of the Indians’ Carlos Santana, except Santana strikes out a lot less (14% compared to Dawson’s 24%).

Is Pitcher BABIP All Luck?

This article was originally published on Check Down Sports.

For those of you who have been reading baseball content at Check Down Sports semi-regularly, you’ve probably seen one of us talking about players and teams we think are performing at a level far from expected.

A lot of times when attempting to explain the reasoning behind abnormal pitching performance, we cite a few reasons, and then attribute the rest to good or bad luck. Luck we usually associate with a batter’s batting average on balls in play (BABIP), which is agreed upon by most as beyond the control of the pitcher.

The influx of ball-tracking systems in MLB has allowed for a boatload of new measurements that, until a few years ago, were only dreams in the minds of analysts and evaluators. One of those — the velocity of ball exiting the bat (exit velocity) — is a popular, yet informative piece of data.

Intuitively, it makes sense that the softer the ball leaves the bat, the less likely the ball should result in a hit. A pitcher who suppresses exit velocity should allow fewer batted balls to become base hits than a pitcher who gives up a high exit velocity. Yes, bloops and seeing-eye ground balls will find open space, but on average, I think this assumption makes sense.

But thanks to Statcast and baseballsavant.com, this assumption doesn’t have to be an assumption at all. We can test it out.

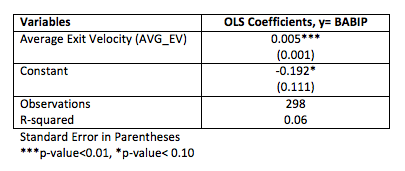
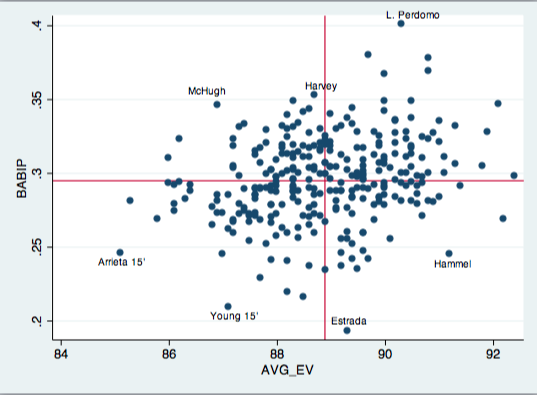
Baseball Savant has exit-velocity data since the beginning of 2015, so that’s where I started. I gathered average exit velocity against for pitchers with at least 190 batted-ball events in 2015 and 2016 (298 total). I then got the BABIP for those pitchers in those seasons from FanGraphs. Next, using STATA, I ran a simple linear regression with the two variables. Results are shown below.

Screen Shot 2016-07-14 at 12.33.28 PM

Screen Shot 2016-07-13 at 11.05.37 PM

The scary math-stuff explained:

  • A pitcher’s BABIP isn’t entirely caused by luck
  • Exit velocity has a minor, yet significant, effect on BABIP
  • 6% of a pitcher’s BABIP can be explained by exit velocity
  • If a pitcher decreases his average exit velocity by 1 mph his BABIP will decrease by 0.005 points, on average (i.e. a pitcher decreases his average exit velocity from 90 to 89 mph — his .300 BABIP would fall to .295. In turn, this would lower his ERA)
  • The bottom-left quadrant is ideal. Though, because of exit velocity’s small effect on BABIP, probably not sustainable. We’ve seen Arrieta and and Chris Young come back to earth a bit in 2016
  • The top-left quadrant includes candidates for improvement in the second half of 2016 or 2017. Pitchers here have been unlucky in terms of BABIP. Their exit velocities suggest they should have a lower BABIP, and, therefore, ERA


Can First-Half (x)FIP Predict Second-Half ERA?

This article was originally published on Check Down Sports

Predictions are hard. Getting them right is harder. But everyone loves them, so I’m going to attempt to predict which starting pitchers will improve in the second half of the season, and which are poised to put up worse numbers. This information may be especially helpful for a GM thinking about acquiring a pitcher before the trade deadline, or, maybe more applicably, a fantasy owner trying to surge his team into playoff position.

How do you exactly predict starting-pitcher performance in MLB? Well, it’s pretty commonly known among baseball-thinkers that FIP is more accurate at predicting a subsequent year’s ERA than ERA itself. FIP is a statistic on an ERA-scale that only accounts for what the pitcher can control (strikeouts, walks, and home runs). There’s been a lot of research that looks at differences between ERA and FIP, but to my knowledge, there’s nothing out there to see if it can predict second-half performance. So that’s what I’m going to do here.

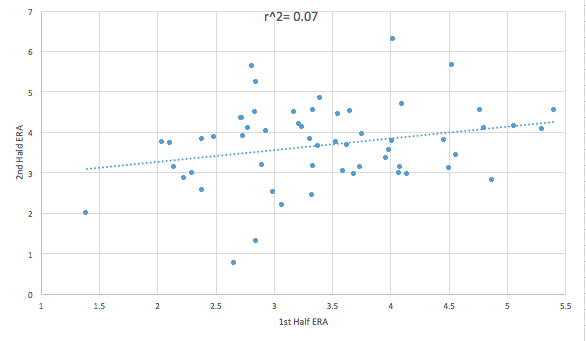
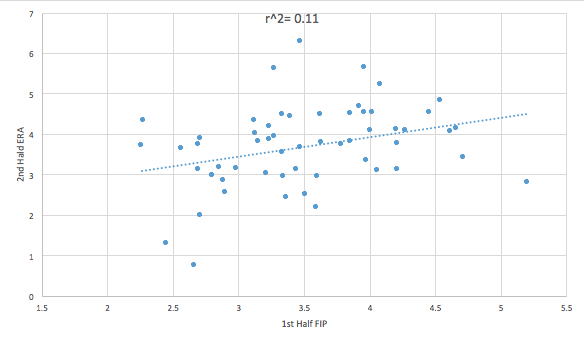
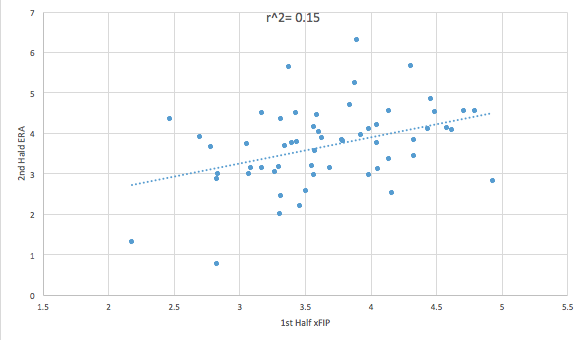
I compiled all the starting pitchers who were qualified in both the first and second halves of 2015 (57 total), and ran a basic scatter plot of their first-half ERA, FIP, and xFIP against second-half ERA, to see which of the former was best at predicting the latter.

First-Half ERA and Second-Half ERA

ERA_ERA

First up is first-half ERA and second-half ERA. A fairly weak correlation — 7% of a pitcher’s second-half ERA is explained by his first-half ERA — albeit significant (p-value < 0.10).

First-Half FIP and Second-Half ERA

FIP_ERA

Next is first-half FIP and second-half ERA. It’s hard to tell but the dots are, on average, a bit closer to the fit line — 11% of second-half ERA is explained by first-half FIP (p-value < 0.05).

First-Half xFIP and Second-Half ERA

xFIP_ERA

Lastly, we have first-half xFIP and second-half ERA. While FIP uses a pitcher’s actual home-run totals, xFIP uses league-average totals because home run rates fluctuate year-to-year. You can clearly see the dots are much closer to the fit line than in the previous two graphs — 15% of second-half ERA is predicted by first-half xFIP (p-value < 0.01).

Is 15% good? Using the same method as above, I looked at the correlation between 2014 xFIP and 2015 ERA — and found an r² of 27%. So while half-season predictions don’t seem to be as accurate as season-to-season predictions, if MLB teams are making real moves based on a 27% correlation, I’m going to take a leap and say my fantasy team can makes moves based on a 15% correlation.

Now the part you (and I) have been waiting for: Here are the top 10 pitchers poised for second-half improvement followed by the top 10 pitchers who may get worse (sorted by the difference between ERA and xFIP, as of 7/9).

Screen Shot 2016-07-11 at 5.04.32 PM

Screen Shot 2016-07-11 at 5.06.34 PM

Some interesting things to note on the first list:

  • Smyly is owned in 48% of Yahoo Fantasy leagues, Nola in 47%, Ray in 11%, and Bettis in 4%. Pick them up.
  • The rest could be solid buy-low trade options (minus Eovaldi, unless your league values middle relievers).
  • A common theme among the members are high BABIPs and home-run rates (>.300, >15%) — which suggests they have been victims of bad luck.

And the second list, where the opposites are mostly true:

  • While Teheran’s name has come up in trade talks, his numbers suggest he may regress in the second half.
  • Sell-high trade options in fantasy leagues.
  • Low BABIPs and home-run rates (<.275, <10%).

Bryce Harper Looks Average

Bryce Harper is in a slump. Not a daily, weekly, or monthly slump, but a slump that has been going on since the beginning of May — nearly two months. Coming off a breakout season in 2015, Harper seemed poised to be even better this year. In April he had a .714 slugging percentage, a 1.121 OPS, and a 181 wRC+ (creates 81% more runs than the average hitter). No pitcher wanted to pitch to him. On a day during the first week of May, Harper went 0-0, with six walks and one hit-by-pitch. Since then, it seems like walking is the only thing he’s done well. In May, he hit .200/.363/.785 with a 105 wRC+. In June, he’s hit .262/.369/.720 with a 95 wRC+(though he did post OBPs of .422 and .351 in May and June, respectively). In essence, Harper has produced like an average major-league hitter over the last two months. The only problem with that is that Harper is widely regarded as not an average MLB hitter, but one of the best (if not the best) hitters in all of baseball.

Sure, hitters go into slumps all the time. It’s no reason to get worked up about a bad spell here and there. Remember, baseball is a game where a hitter fails 70% of the time and is considered a Hall-of-Famer. There are going to be 0-4 days.

But two months seems like an awfully long time. And it’s my job here to find out why. So let’s take a look.


The first thing that stands out when examining Harper under the microscope of a computer is his batting average on balls in play (BABIP). He’s hitting .257 in said category — well below his career average of .323 and well below the 2016 MLB average of .300. BABIP does reflect the ability of the hitter, but it also depends significantly on defense and luck. A batter whose BABIP is well below his career and league average may just be getting unlucky — whether that is from hitting the ball directly at defenders or defenders making spectacular plays.

So, is Harper hitting the ball with the same authority he did last year (which would confirm the idea that he’s getting unlucky)? Not quite. In the following table you can see that the number of line drives he’s hit (LD%) is down 7% and number of balls he’s hit softly (Soft%) is up 12%. He’s hitting fewer line drives and more fly balls (FB%) — but those fly balls aren’t turning into home runs, as his HR/FB% is down from 27% to 17% (i.e. last year for every 100 fly balls that Harper hit, 27 of those were home runs. This year he’s hitting 17 home runs for every 100 fly balls).

Screen Shot 2016-06-28 at 11.53.23 AMScreen Shot 2016-06-28 at 11.54.42 AM.png

So, Harper is hitting more soft fly balls that are getting caught by outfielders, and fewer line drive that find gaps. Could this be a result of his discipline at the plate — his ability to differentiate strikes from balls and to swing accordingly? There are two things I want you to look at: Z-Swing% and O-Contact%. They sound confusing but they’re simple to understand. Z-Swing% is the percentage of strikes the batter swings at. O-Contact% is the percentage of balls outside the strike zone that the batter makes contact with.

Screen Shot 2016-06-28 at 12.06.25 PMScreen Shot 2016-06-28 at 12.06.42 PMScreen Shot 2016-06-28 at 12.06.50 PM

You can see the difference between last year and this year. Harper is swinging at fewer strikes (5% less) and making contact with more balls outside the strike zone (5% more). That would explain why he’s hit more balls softly this year — he’s making weak contact with pitches outsize the zone. It’s much harder for a batter to hit a ball well outside the zone because it’s farther away from him. You can see the truth in this statement from the following graph (all qualified hitters from 2012-2016).

Screen Shot 2016-06-28 at 12.46.55 PM

The graph shows the relationship between isolated power (ability to hit for extra bases) and O-Contact%. It’s pretty clear that the more often a batter makes contact with a ball out of the zone, the less likely that ball with result in a double, triple, or home run. In 2016, Harper is somewhere right smack in the middle of all the dots (0.65 O-Contact%, .225 ISO).

Before I end, I just want to make it clear that Harper isn’t by any means a bad player. He’s a superstar, an All-Star, and probably the face of MLB — oh, and he’s 23. But, for lack of a better term, he’s performed like an average player the majority of this season, so I set out to find why. I think it’s mostly due to being unlucky with his deflated BABIP, but I’d also be cognizant of plate discipline if I were him. Pitchers do try to pitch around hm — just being a little more patient and swinging at more strikes and fewer balls wouldn’t hurt.


MLB’s Qualifying Offer: A King’s Ransom

With the MLB draft just past, I thought it would be appropriate to examine one of the most controversial topics surrounding the draft: the qualifying offer. Essentially, the qualifying offer intends to reward teams — presumably the small-market, low budget ones — that lose players in free agency. This reward comes in the form of an additional first-round draft pick for every player that signs with another team.

Only it isn’t that simple. Once a player reaches the end of his contract, the team can decide whether or not to offer the player a 1-year extension known as the qualifying offer. This new contract is equal to the average of the highest 125 salaries in MLB ($15.8 million in 2016). The player then chooses to either accept the qualifying offer or decline it — and thus, enter free agency with the assumption that he can earn more than a 1-year, $15.8 million contract. Once the player signs on with another team, his former team is awarded a first-round draft pick (to go along with the one(s) they already have, assuming they do) as compensation. Additionally, the player’s new team loses their first-round pick in the draft so long as it is outside the top 10 (in which case their second-round pick would be forfeited).

So, one would assume that, more often than not, a small-market team with a low payroll would benefit from this system. A budding star player reaches the end of his contract and commands a new contract worth hundreds of millions and spread over 5+ seasons. His current team does not have the financial resources to resign him, and another big-market team does. The cash-strapped team receives an additional first-round pick as compensation, while his new team willfully forfeits its first-round pick in exchange for his services over the next half-decade. And that’s that.

Not quite. I went back over the draft order for every year since 2013 (when the qualifying offer was first introduced) and summed the number of draft picks gained and lost. Results are shown below. I sorted the teams by their average payroll over the span in descending order. As you can see, the compensation is not in line with the assumption I presented above. In any way you shape it, the high-payroll teams are the ones benefiting from the current system. The 10 highest-payroll teams have received 19 additional draft picks over the four seasons — highlighted by the Cardinals who have gained four and lost none. The 10 teams with the lowest payrolls have received eight additional picks. The high payroll teams have a net draft pick gain of four, while the low payroll teams have a net loss of two.

Screen Shot 2016-05-29 at 5.27.18 PM

Now, I’m not coming up with any revolutionary solutions here — I’m not that smart and I don’t get paid enough. I am simply presenting data that supports that MLB’s current free-agent compensation system doesn’t benefit the teams that need it the most. In fact, this seems to be a story of “the rich are getting richer” — big-money teams are receiving the extra draft picks that were seemingly meant for the low-budget ones. Maybe MLB scraps the compensation system altogether, maybe they extend the time frame for when a player can accept the qualifying offer (they currently have seven days), or maybe they come up with some other solution. In any case, the current CBA ends after the 2016 season so us fans will likely know the answer before next year’s draft.


The Steady Improvement of Xander Bogaerts

Amidst a disappointing first half for the Boston Red Sox, one of the few bright spots has been the steady offensive improvement of Xander Bogaerts. The 22-year-old shortstop is beginning to live up to hype that has seemingly plagued the former 6th overall prospect during his first full season in Boston. Bogaerts maintains a .302/.339/.414 clip through July 6, which equates to a 2.2 WAR, second to only Brandon Crawford’s 2.9 for shortstops in the MLB.

First off, its important to point out to all who thought Bogaerts was a bust after his performance a year ago, that he is still only 22 years old. To put it into perspective, consider this: Francisco Lindor was the #3 overall prospect coming into this year. The Indians called him up from AAA on June 14th to, like Bogaerts, begin his career as an every-day shortstop at age 21. And similar to Bogaerts, Lindor is enduring his share of rookie struggles, batting .215 through his first 79 at-bats. It’s not fair to write off Lindor, or Bogaerts, as busts after their 21-year old seasons. Most players, especially those that young, need time to adjust to major-league pitching.

Bogaerts is walking about the same as a year ago, but has significantly improved his strikeout percentage, which has fallen from around 23% to 14%. His BABIP has risen almost 50 percentage points from a year ago (up to .347) which would help explain the improvements in batting average.

Another explanation for improvement has been Bogaerts new-found use of the ground and opposite field in 2015. Two-thirds of his balls in play are traveling to center and right fields this year, compared to around 40% last year. And his percentage of balls hit to the opposite field has increased from 19% to 31%. While the Monster may bait right-handed hitters into becoming pull-happy, Xander has found better success driving the ball the other way.

Bogaerts has also been putting the ball on the ground more this season. His GB% has risen 12% (to 50%) and FB% has dropped the same amount (his line-drive percentage has stayed roughly the same). Xander isn’t a burner on the base paths (only four steals) but he can put his athleticism to good use when he hits on the ground.

Xander’s improvement may even result in his first All-Star appearance. Alcides Escobar and former Red Sox, Jose Iglesias, are the two American League shortstop representatives for now. Even if Bogaerts is left off the team, his first-half play has been refreshing enough in an otherwise frustrating year for many Red Sox players. The young shortstop is taking some nice steps towards proving he is the player the Boston media, and fans alike, thought he was going to be.