Archive for Research

Is the Baseball Actually Juiced?

Home runs are on the rise. We all know this. The number of homers per game is at an all-time high in 2019, and has increased by about 36% just since 2015:

Home Run Rate
Year HR/game
2015 1.01
2016 1.16
2017 1.26
2018 1.15
2019 1.37

What we do not know is exactly why.

Commissioner Manfred recently suggested that the current baseballs have less drag through the air, caused by the more perfect “centering of the pill” (the innermost part of the ball). It has basically become an operational fact that there is something going on with the baseballs. Manfred’s explanation implies that the flight of the baseball is the key difference.

To look at this closer, I considered the distance traveled by balls in the air as a function of the exit velocity and launch angle at contact. If the average distance on similarly struck balls has increased over time, it would suggest that the ball itself is more aerodynamically efficient.

Pitch-by-pitch data for the 2015-2019 seasons was collected from Baseball Savant via the Statcast Search page. Two random forest models were built for each year, one using all fly balls and one using home runs. To account for a possible difference in flight due to the warm air in the summer months, only data through June of each year was used. (At the end of the season, the analysis can be applied to the full data set). In both cases, the distance the ball traveled is the response variable and the exit velocity and launch angle are the explanatory variables. The models are applied to a test data set of various exit velocity/launch angle combinations. Read the rest of this entry »


Ballpark Attendance and Starting Pitchers

When I am thinking about buying a ticket to a baseball game, often my first question is “Who’s pitching?” I have always felt that the most enjoyable type of game is one in which a great starter is on the mound. Is this feeling common among fans or do they buy tickets regardless of the starting pitcher?

To answer this question, I trained random forest models to predict attendance for games based on situational factors (not including the starting pitcher). Then I considered how the quality of starting pitchers relates to whether the models overestimate or underestimate the attendance. If the models consistently underestimate attendance when star pitchers are on the mound, it would suggest more tickets are sold because of the starter.

Data

Information about each game was collected from Retrosheet’s game logs. In accordance with Retrosheet’s terms of use, please note the following statement: “The information used here was obtained free of charge from and is copyrighted by Retrosheet. Interested parties may contact Retrosheet at retrosheet.org.” Pitcher performance data was gathered from FanGraphs. In addition, the people.csv data set found here was used to match player ids from Retrosheet to FanGraphs. Read the rest of this entry »


The Arm of Marcell Ozuna and the Outfield Arm Runs Saved Statistic

Sunday night baseball is such a great thing. Yes, I may fall asleep around the sixth or seventh inning, but I tend to fall asleep to baseball, which is nice. It’s such a summer feeling for me to have the window open, the summer breeze blowing in, and talk of baseball in the background. On June 9, the Cubs were aggressive early on the base paths. At one point, with Kyle Schwarber on first base and Kris Bryant at the plate, Bryant hit what would typically be a routine single to left-center. ​Now, with the Cardinals and the Cubs fighting it out for the top spot in the division, you saw an aggressive approach by Schwarber. Did mastermind Joe Maddon have that all planned and ready? Did he tell his team to run on Marcell Ozuna? Well, if so, maybe he (or his team of data scientists and analysts) was evaluating the rARM statistic.

Part 1: The Stat – Throwing Arm Runs Saved

A player’s total Throwing Arm Runs Saved is then the sum of our three halves: flyballs Runs Saved + groundballs Runs Saved + Miscellaneous Kills Runs Saved.

– The Fielding Bible Read the rest of this entry »


Does Switching Leagues Affect Pitching Performance?

When Major League pitchers change leagues, strange things begin to happen.

Jordan Zimmermann, an ace by any measure when he played for the Washington Nationals, became a free agent after the 2015 season before signing with the Detroit Tigers — only to quickly learn that he was not so invincible.

Wei-Yin Chen’s four strong seasons with the Baltimore Orioles gave him free agent swagger — and a hefty asking price — that led him to a spot on the Marlins roster just before the 2016 season. And then he suddenly became very human.

As is often the case, the stories that develop around pitchers as they transition from one league to the next are fed by assumptions, a bit of baseball history, certainly a little bias, and what can only be called the gut instincts of the fan.

Statistics, of course, aren’t infected by ESPN punditry and don’t care what color a uniform is. They are emotionless, sober friends of reason.

The known stats of Zimmermann and Chen — before I got involved — tell you part of the story. A deeper analysis, however, upends the conventional wisdom. Read the rest of this entry »


Fun Numbers Through the First Two Months

SNELL THE GLOVE

Since 2002, when the stat began being recorded, the top three swinging strike percentages for pitchers through June 1st of a season (minimum 60 innings) are…

1. Blake Snell (2019) – 19.1%
2. Max Scherzer (2018) – 17.5%
3. Curt Schilling (2002) – 16.8%

To say that Snell has been in fine form the first two months of the season would be a massive understatement, as he’s in historic form according to this metric. The reigning AL Cy Young winner’s surface numbers may not look as incredible as they did last year, but his talent is still off the charts.

RYU READY TO ROCK?

When facing lefties, there is an offense that ranks first in ISO, second in wOBA, third in wRC+, and possesses the eighth-lowest strikeout rate this season. It’s not the Twins, who have caught the serious attention of the baseball world. It’s not the Astros, who have had quite the reputation of being death to lefties for the past few years. It’s also not the other teams (the Dodgers, Mariners, Braves, Cardinals, etc.) you would normally suspect…

Yep, you didn’t guess it!

It’s the Arizona Diamondbacks. Granted, two months of data may still be leaning on the short side of sample sizes when it comes to team trends. Their BABIP indicates at least some bit of good fortune, and they currently sit with the third-lowest walk rate. However, none of this mattered against Hyun-Jin Ryu in his last outing on June 4. The Dodgers southpaw continued his stellar campaign by firing seven scoreless innings against the D-backs, allowing just three hits to move to 9-1 in 12 starts. Ryu now holds a 1.35 ERA, 2.6 fWAR, and has allowed just five walks to 71 strikeouts in 80 innings.

It’s worth noting that the matchup took place at Chase Field, where they’ve been conveniently keeping the roof open for night games, which in turn mitigates the effects of the humidor system they installed before the 2018 season. That said, Ryu is doing something truly remarkable and seems capable of silencing just about any lineup in MLB. Read the rest of this entry »


“Stuff” and Father Time

The question of how pitchers age is paramount to players and front offices. “Stuff,” the colloquial term for raw talent throwing the baseball, can really be boiled down to velocity and movement (if we really wanted to oversimplify things). PITCHf/x gives us an opportunity to use big data to estimate “stuff” by looking at measurements of velocity and movement. We can use the copious data collected to estimate what “stuff” we can expect from pitchers as they pass the dreaded 30-years-old mark and beyond.

PITCHf/x reports movement in horizontal and vertical vectors. Horizontal movement (Hmov) is the right or left movement of the pitch compared to the expected trajectory without air resistance. A positive value is away from a right-handed batter. Vertical movement (Vmov) is the amount the ball moves up or down relative to the expected drop in a vacuum. A positive value means the ball dropped less than would be expected without effective spin.

It has been established that fastball velocity tends to decrease with age, but movement trends haven’t been looked at before. Might aging pitchers compensate their decrease in velocity with an increase in movement? Or does time steal away effective spin as well?

Let’s find out.

Methods:

I collected all PITCHf/x data from every pitcher with at least 300 innings pitched from 2007 to 2018 (n=537). Data was aged based on the age of the player on April 1st of the corresponding season. Velocity, horizontal movement, and vertical movement were averaged for each age and graphed. The horizontal axis of left-handed pitchers was flipped so right and left-handed data could be analyzed together.

I then took out the top starters by WAR (n=63), according to FanGraphs, from 2007 to 2018 and graphed their data separately.

Results/Discussion: Graphs are available by clicking on the links below, and raw data available in tables at the end of this post. Read the rest of this entry »


Do Higher Signing Bonuses Help Players Advance?

A lot has been written over the past year about pay at the minor league level and attempts to fix things, and with good reason — it’s a pretty bad situation, and with fundamental decency in mind, it is certainly a good thing that it may be changing.

But alongside that discussion, I’ve been kind of curious of how changing minor league pay would actually change performance. In theory, paying players more could let them focus on baseball, translating to better performance. If that’s the case, it’s even possible that paying players more could actually “pay for itself” if the value of the extra wins players generate outweighs the costs of paying them more. In a perfect world, to test that, you could randomly pay some players more than others and see which group does better.

We don’t live in a perfect world, but we do live in one where signing bonuses are still pretty random. Yes, obviously players drafted higher receive higher bonuses on average, but there’s still pretty significant variation across the board, especially when you get into later rounds. In 2015, for example, there were 105 players drafted who had assigned “slot values” of between $130,000 and $200,000, and their bonuses were anywhere from $2,000 to $1,000,000. While in general higher bonuses should go to more talented prospects, it also stands to reason that two players drafted around the same time with around the same slot values should have around the same talent level and chances to make the majors.

With that in mind, I took a look at a couple different ways of seeing how well players with much lower bonuses progressed. Using 2014-16 draft data from SBN, I had a set of all players drafted in the first 10 rounds along with their signing bonuses and slot values, which I then matched with FanGraphs’ data on player appearances at either the Triple-A or major league level from 2014 to 2019. In total, this left me with 922 players, of whom 319 (~35%) made a Triple-A or MLB appearance and 144 (~16%) that made an MLB appearance. 153 (~17%) had a signing bonus of $50,000 or lower. I looked at two different ways to see how signing bonuses varied with advancement. Read the rest of this entry »


Does Rule 5 Draft Position Matter?

Orioles fans like myself don’t have a lot of hope. It’s hard to get excited about a starting lineup featuring Austin Wynns, Joey Rickard, and Rio Ruiz. The Orioles’ hope is for the future, and one thing that got some Orioles fans excited this winter was the selection of Richie Martin with the first pick of the Rule 5 draft. Fans can dream about their team unearthing a diamond in the Rule 5 draft, reminding each other that Jose Bautista was a Rule 5 draft pick once. But the likelihood of success remains extremely low. Still, the first shot at a Rule 5 draft pick seems to suggest a better chance at success. The question is, how much does Rule 5 draft position predict the player’s future career value or team contribution?

To answer this, I identified data from the 2003 to 2014 Rule 5 drafts. I included only players selected in the major league portion of the draft, a sample size of 175. I also only included data up until 2014 to give players time to contribute towards their career bWAR and team bWAR values.

First off, the bar for success in the Rule 5 major league draft is fairly low. Take a look at the distribution of total bWAR provided to the team during the selected players’ tenure.

teambwar

That’s a lot of clustering around 0 with the exception of some highlights like Shane Victorino, Dan Uggla, Joakim Soria, Marwin Gonzalez, and Odubel Herrera, who all come in at top-10 in team bWAR. The mean team bWAR provided is .61 for this sample. Only six players, or 3.4%, provide more than 5 bWAR to their selecting team. In comparison, 25% of them posted a negative team bWAR, including poor Levale Speigner, who posted a -1.7 bWAR in 26 games across two seasons with the Washington Nationals. Read the rest of this entry »


The Logic Behind Opt-Outs

Opt-outs are complicated to understand. On a basic level, an opt-out allows a player the choice, during a specified offseason, to nullify his current contract and become a free agent again. How an opt-out affects the value of a contract has been written about plenty — despite the differences in methods or dollar-per-WAR values, it is generally accepted that the inclusion of an opt-out lowers the total salary of the contract.

Given the issues with trying to calculate an exact value of an opt-out — the two biggest challenges being having sparse contract data and the necessity of a reliable future projection system — I tried to explore opt-outs from a theoretical perspective: why would a player ask for an opt-out, and why would a team write one into a contract. Note: the equations were originally in latex, but they lost formatting through submission. They have been replaced with plain text.

From the Player’s Perspective:

A player would sign a contract with an opt-out if he believed the expected present value of the contract was greater than a contract offer without an opt-out.

EPV_opt < EPV_no-opt

The expected present value of the contract without an opt-out (EPV_no-opt) is just the expected present value of the contract itself. The expected present value of the contract with an opt-out (EPV_opt) is more complex.

The expected present value of a contract with an opt-out can be broken down into two components: the expected present value of the pre-opt-out portion of the contract ($latex EPV_{pre\:opt}$) and the expected present value of the post-opt-out portion. Regardless of whether the player opts out or not, the pre-opt-out value of the contract is the same. The post-opt-out value differs, depending on three values: the value of the new contract should the player opt-out ($latex EPV_{opt}$), the value of staying in the current contract and not opting out ($latex EPV_{no\:opt}$), and the probability the player opts out (P opt-out). Read the rest of this entry »


Lucas Giolito and the Long-Awaited Comeback

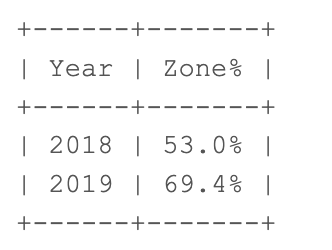
Are we finally seeing the Lucas Giolito performance that we waited so long for? Once pegged as a “top-of-the-rotation demigod,” Giolito has struggled to find any consistency in the majors. Through the month of May, he’s got the highest K% of his career at 29.2% and the largest K% increase in MLB from 2018 to 2019 with a 13.1% jump. He’s got an average fastball velocity of 93.4 mph, up exactly one tick from last season, and has also added 148 rpm to his heater. Giolito has been more aggressive in terms of overall zone percentage, with the third-largest MLB increase from 2018 to 2019 at 6.8%. Even while down in a hitter’s count, he’s found ways to battle back in the zone, something he was below league average in last season:

Batters are having a tougher time squaring him up and he’s even added some vertical break on his fastball and curveball: Read the rest of this entry »