The Arm of Marcell Ozuna and the Outfield Arm Runs Saved Statistic

Sunday night baseball is such a great thing. Yes, I may fall asleep around the sixth or seventh inning, but I tend to fall asleep to baseball, which is nice. It’s such a summer feeling for me to have the window open, the summer breeze blowing in, and talk of baseball in the background. On June 9, the Cubs were aggressive early on the base paths. At one point, with Kyle Schwarber on first base and Kris Bryant at the plate, Bryant hit what would typically be a routine single to left-center. Now, with the Cardinals and the Cubs fighting it out for the top spot in the division, you saw an aggressive approach by Schwarber. Did mastermind Joe Maddon have that all planned and ready? Did he tell his team to run on Marcell Ozuna? Well, if so, maybe he (or his team of data scientists and analysts) was evaluating the rARM statistic.
Part 1: The Stat – Throwing Arm Runs Saved
– The Fielding Bible
After researching the Ozuna question and trying to find the statistic that would best explain the decision to run or not to run, I settled on the Throwing Arm Runs Saved statistic and it’s detailed approach to quantifying an outfielder’s ability to hold runners on base. A very detailed overview of this statistic can be found here, but I’ll do my best to break it down:
The statistic is built around three categories:
1. When a runner moves an extra base. For example, when a runner advances from first to third on a single just like in the case of Schwarber and Ozuna. This is known as “Moved.”
2. When a runner does not move an extra base. This would have been the case if Schwarber stayed at second or when a player simple goes from “station to station.” This is known as “Did Not Move.”
3. When a runner gets thrown out trying to take the extra base. This is known as “Thrown Out.”
Each fielding position (infield and outfield) is then broken down into zones or buckets, which take into consideration where the ball landed or where the play was made.
(1) Fly Ball Arm Runs Saved
League Average: Percentages of “Moved,” “Did Not Move,” and “Thrown Out” for each zone, at each position, for each situation.
Opportunities: # of times runners move on a player + # of times runners don’t move on a player + # of throw outs.
Expected Runs Saved: (Opportunities) x (the league average). The difference between expected and actual multiplied by the run value of each play.
(2) Repeat above calculation for Ground Balls Runs Saved
(3) Miscellaneous Kills
Calculate the league average: Take the number of miscellaneous kills per touch (the sum of miscellaneous kills / total number of touches).
Calculate expected miscellaneous kills: Multiply league average by the player’s touches.
The difference in expected and actual multiplied by run value.
Outfield Throwing Arm Runs Saved: (1) Fly ball arm runs saved + (2) ground ball arm runs saved + (3) miscellaneous kills.
Part 2: The Arm of Ozuna
With this complicated and in-depth defensive metric, the real question is a two parter:
(1) Are the Cubs using such a statistic to run on Ozuna?
(2) Who are the people actually calculating this metric? Who is actually measuring the percentages in each zone? That’s crazy!
Let’s see how Ozuna stacks up:
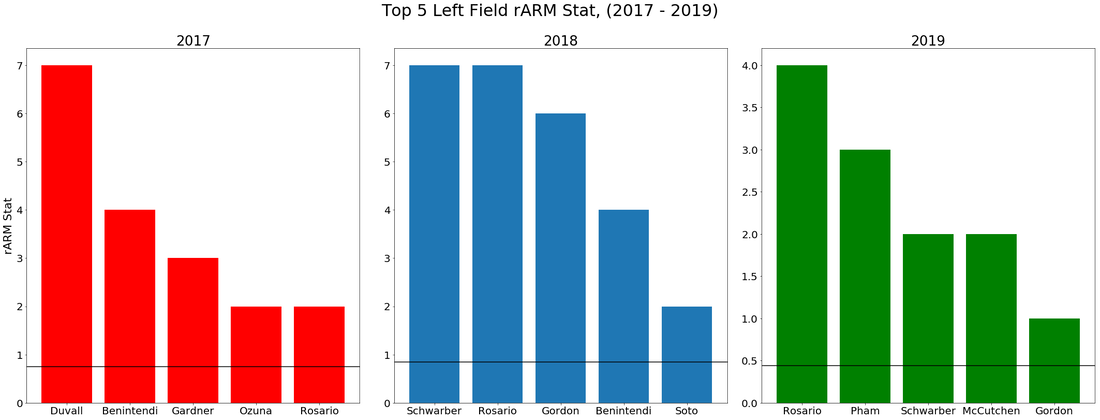
Looking at the first chart on the left, we see that Ozuna shows up just above the league average (indicated by the horizontal line). We also see no Ozuna in seasons 2018 (middle chart) and 2019 (right chart). Clearly teams may feel like it is worth the risk to run on Ozuna in this current season. Here’s the top 30 left fielders as measure by the rARM stat in the past three seasons.
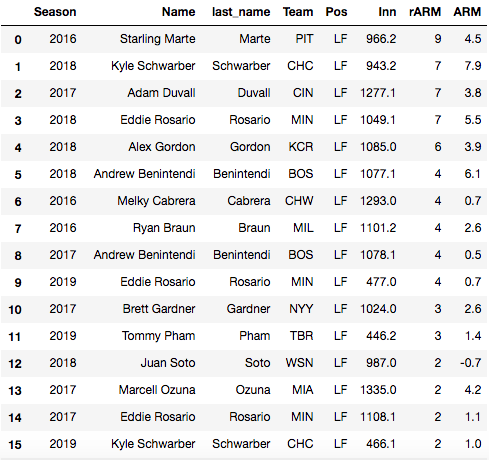
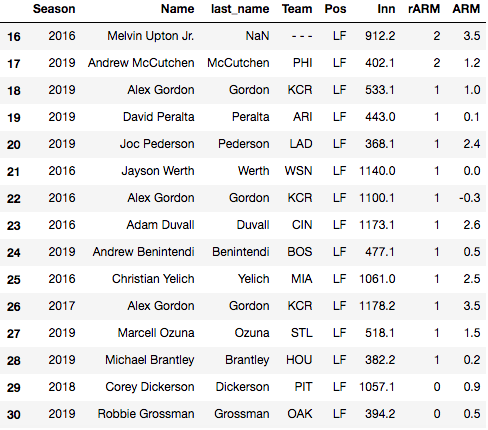
Interestingly enough, Ozuna shows up in the top 30 twice, once in the 2017 season and once again in the current 2019 season, just above the league average of 0.5. A second interesting piece is that the runner who took that extra base was Kyle Schwarber, whose 2018 rARM mark was the second-highest in the past three season, and this season (2019) he’s been above average. This may just suggest that when a left fielder is sizing up another left fielder, there may be more of a reason to run and show a more aggressive approach.
Did the first base (or possibly third base) coach take all these factors into consideration? Perhaps. Maybe Schwarber just had an extra cup of coffee that day. The point is, you can run on Ozuna, but beware, as he is above the league average this season for the rARM stat.
References:
In this specific situation, the determing factor was likely that Ozuna was moving to his left and throwing to his right (momentum moving away from the the throw).
Had he been charging or moving to his right (easier throw), they may not have ran.
As a Cardinal fan, I read plenty of comments from fellow fans mocking ozuna’s arm. Visuals have more of an impact on many viewers than do outcomes.
Just like how speed is often confused as hustle.
That was just a terrible throw primarily because it was offline to both the cutoff man and also third base and was not at the correct height to be cut off. But almost every arm rating system ignores the running speed of the trailing runner as a factor in both advancement of the lead runner and the arm rating of outfielders. In this case if the batter was very fast and aggressively running to 2b the official scorer might have credited him with a double and your arm rating system credited Ozuna for holding the lead runner on third instead of scoring on a double. I’ll