Does Switching Leagues Affect Pitching Performance?
When Major League pitchers change leagues, strange things begin to happen.
Jordan Zimmermann, an ace by any measure when he played for the Washington Nationals, became a free agent after the 2015 season before signing with the Detroit Tigers — only to quickly learn that he was not so invincible.
Wei-Yin Chen’s four strong seasons with the Baltimore Orioles gave him free agent swagger — and a hefty asking price — that led him to a spot on the Marlins roster just before the 2016 season. And then he suddenly became very human.
As is often the case, the stories that develop around pitchers as they transition from one league to the next are fed by assumptions, a bit of baseball history, certainly a little bias, and what can only be called the gut instincts of the fan.
Statistics, of course, aren’t infected by ESPN punditry and don’t care what color a uniform is. They are emotionless, sober friends of reason.
The known stats of Zimmermann and Chen — before I got involved — tell you part of the story. A deeper analysis, however, upends the conventional wisdom.
Zimmermann, drafted in the second round of the 2007 MLB draft by the Nationals, recorded a 3.32 earned run average in over 1,000 innings across seven seasons with Washington. He was named to the National League All-Star team in 2013 and 2014, finishing top 10 in Cy Young Award voting both seasons. The right-hander also threw the first no-hitter in Nationals history on the final day of the regular season in 2014.
Naturally, when it was time for Zimmermann to hit free agency, he was highly sought after. He signed a five-year deal with Detroit worth $110 million. But Zimmermann’s transition from the National League to the American League has not been quite as smooth as he, or the team, expected. Through three-plus seasons in the Motor City, Zimmermann has struggled to a 5.30 ERA in 431 innings. Zimmermann recorded a FIP (fielding independent pitching) under 3.75 each year from 2011 (his first full season) to 2015 with the Nationals. He has yet to record a FIP below 4.42 during his tenure with the Tigers.
Zimmermann seems to be a prime example of a pitcher who was unable to adapt to the firepower of American League offenses.
Chen signed with the Orioles as a free agent in 2012. He posted a 3.72 ERA and 4.14 FIP in just over 700 innings across four seasons in Baltimore. On paper, the southpaw seemed like a candidate to improve his performance when he signed a five-year, $80 million deal with the Marlins in free agency prior to the 2016 season. He was going from one of the most hitter-friendly ballparks in Baltimore to one of the most pitcher-friendly ballparks in Miami — and he would no longer have to regularly face a designated hitter.
And yet, in parts of four seasons with the Marlins, Chen’s ERA has ballooned to 4.99 while his FIP has also increased to 4.45. Chen’s situation goes against the grain with the commonly held assumption that National League pitchers have an easier job.
Given the reputation of the designated hitter, pitching in the American League is typically seen as more difficult than pitching in the National League. This would mean that the AL-to-NL transition would be smoother than vice versa.
This got me thinking: When pitchers switch leagues, how big of a factor is this change when predicting future performance?
Determined to figure out the impact of this league swap, I conducted an independent sample research study to get to the bottom of this ever-elusive question. To collect sufficient data, I compared the statistics of pitchers who switched leagues. The criteria for the study sample is as follows:
- The pitcher must have pitched at least 100 innings in each season prior to the switch in order to ensure a large enough sample size.
- The change has to have occurred in my lifetime (since 2001) because professional baseball has changed a lot over its history.
- Pitchers who either switched to or from Colorado were excluded from the study. It was predetermined that altitude was too large a factor and would skew the data.
To reach a conclusion, I created a statistic called Relative Adjusted Performance (RAP). The stat takes into account five real-world statistics and creates a weighted average using five different variables: earned run average (ERA), walks plus hits per inning pitched (WHIP), fielding independent pitching (FIP), batting average against (BAA), and wins.
Desirability variables
- ERA in the pitcher’s first full season after the switch vs. their last full season before the switch (weighted at 30%)
- WHIP in the pitcher’s first full season after the switch vs. their last full season before the switch (weighted at 20%)
- FIP in the pitcher’s first full season after the switch vs. their last full season before the switch (weighted at 20%)
- BAA in the pitcher’s first full season after the switch vs. their last full season before the switch (weighted at 20%)
- Wins in the pitcher’s first full season after the switch vs. their last full season before the switch (weighted at 10%)
Sampling and data collection
To create my data set, I used convenience sampling. It would be tough to find every starting pitcher in history who switched leagues from one season to the next while also pitching 100 innings each of those years.
This spreadsheet compares the five most critical pitching statistics (ERA, WHIP, FIP, BAA, wins) from a pitcher’s final year in one league to those statistics in their first year in the other. The rows written in red represent pitchers who started in the American League and those in blue represent pitchers who began in the National League. Each statistic was then put into a percentile, where lower values of RAP are more desirable. These percentiles are based solely on the averages of pitchers in the specific league they appeared in that season.
I then combined all of those statistics using the weights shown in the desirability variables section and the function revealed the final combined number: RAP, or a weighted average of the five categories. To measure the impact of the league change, I divide the two weighted averages to give us a number, which I named League Impacted Performance (LIP). If the LIP is greater than one, the pitcher improved, but if it is below one, it means that individual regressed.
Data analysis
No single variable can tell the whole story; the combination of multiple variables gives a more complete picture. The goal of creating Relative Adjusted Performance was to give a more holistic view of a pitcher’s performance through an all-encompassing stat.
The weighted average gives us the opportunity to compare each pitcher examined to the others based on the five most relevant categories for assessing long-term success in Major League Baseball. On the RAP scale, a lower number represents a better pitcher’s score, with the average rating being 0.5; numbers closer to 1.0 are below average while numbers closer to zero are above average.
Earned run average was valued most because it focuses on the most important factor of pitching: preventing runs from scoring. The three other stats valued at 20% — WHIP, FIP, and BAA — are of similar importance because they all factor into run prevention, though they are not as directly tied to run prevention. All three, fundamentally, are about preventing baserunners.
Wins are valued lowest because they are so reliant on outside forces. Wins are calculated on a different scale than other variables. This is of course because a high number of wins is desirable, while with the other variables, lower values are more desirable. To solve that predicament, wins were placed on the same scale by doing one minus the percent rank.
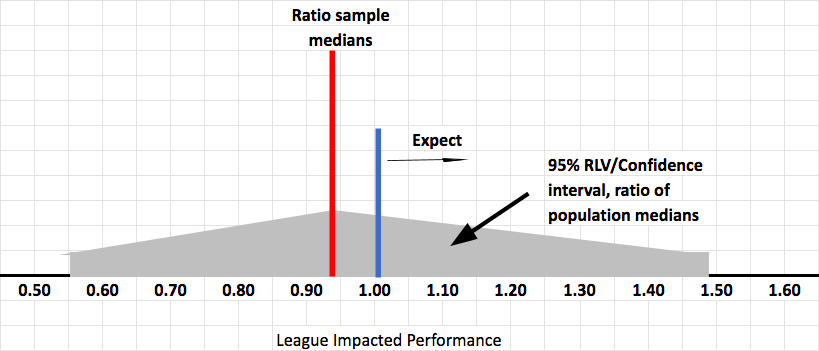
The box plots below show a significant amount of overlap between the two groups of pitcher data, which suggests that there is not a significant difference in pitcher performance after switching leagues. This data contradicts the conventional belief that it is more difficult to make the switch to the American League.
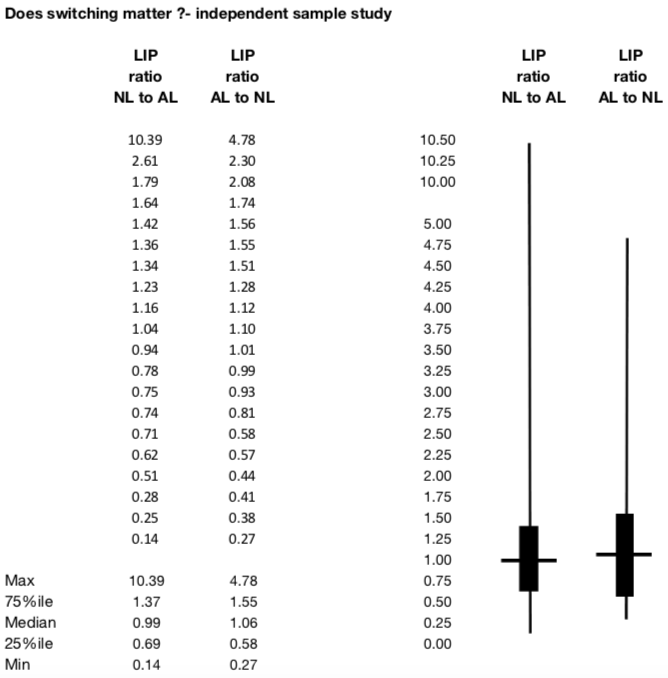
As part of the resampling examination process, I made a two-batch data analysis where one of the groups represented AL-to-NL pitchers and the other batch represented NL-to-AL pitchers. It was discovered that the range of likely values was too broad to determine a significant change in production after changing leagues. It is just as likely for a pitcher to improve or regress regardless of which league they transferred to.
Discussion
After creating the statistics Relative Adjusted Performance and League Impacted Performance, and analyzing the data that resulted from these developments, I discovered there is no conclusive evidence that changing leagues is a large factor on starting pitcher performance. The relatively equal distribution of LIP totals on each side of the median sample represents a larger trend: There is no advantage or disadvantage to a pitcher switching leagues. This is one of the many factors general managers are likely to consider when determining whether to sign starting pitchers. Perhaps they should be focusing less on league factor and placing greater emphasis on others metrics.
Note: The original version of this analysis was awarded the Curtis Jacobs Prize for Most Outstanding Statistics Project by the Washington Statistical Society.
I’m interested in your rationale in the construction of RAP you use as your figure of merit. Specifically, why did you weight the variables the way you did? Were the percentages motivated by something or selected arbitrarily?