Archive for Player Analysis

Pawtucket Red Sox Prospect Review

This Saturday and Sunday I caught the Pawtucket Red Sox on the road against the Buffalo Bisons. The matchup of the Red Sox and Blue Jays AAA affiliates featured several of the top prospects in the Red Sox organization with the following members of Marc Hulet’s preseason Top 15 Red Sox prospects on the Pawtucket roster: #1 Xander Bogaerts, #3 Jackie Bradley Jr., #4 Allen Webster, #10 Brandon Workman, #12 Bryce Brentz and #14 Anthony Ranaudo. Additionally, 2012 #2 Will Middlebrooks manned the hot corner for Pawtucket. Bogaerts at #2, JBJ at #38, and Ranaudo at #49 also appeared on Hulet’s 2013 midseason top 50 list.

I offer the following (perhaps voluminous) review for your reading pleasure. Furthermore, I included the following images and GIFs for your viewing pleasure.

  (Image from Milb.com)

Xander Bogaerts: The Red Sox wisely held onto Bogaerts this trade deadline, the crown jewel of their farm system, and the consensus top shortstop prospect in baseball. The 20 year-old has thrived following a promotion to AAA, with a .282/.378.477 line in 47 games along with a .387 wOBA and 139 wRC+, despite a BABIP% of .311, 31 points lower than his minor league career average. Impressively, the youngster has posted a 12.4 BB%, and has actually cut his strikeout rate from 21.6% to 16.9% after being promoted from AA to AAA. Bogaerts has excellent bat speed and real power, and hit a couple balls hard the other way, including a fly ball to the wall in right-center. While Bogaerts appeared to recognize off-speed pitches well, he swung through several breaking balls, including three straight in one poor at-bat. Improved patience will be key for Bogaerts to realize his full potential at the next level.

Tall and lean at 6’3 and 185 pounds, Bogaerts looked smooth at the shortstop position. He flashed some nice range making a sliding backhand play and putting plenty on the throw to first. While he may eventually outgrow the position his defense is sufficient for the major-league level. In the best-case scenario, Bogaerts provides elite-level offense combined with solid defense from the shortstop position a la Troy Tulowitzki or a young Nomar Garciaparra. Bogaerts may have the opportunity to make a Manny Machado-like impact as a late-season call-up. With Stephen Drew being a free agent this offseason, Bogaerts will likely have the opportunity to win the Red Sox starting shortstop job in 2014, which would be his age-21 season. Nomar Garciaparra, the last great Sox shortstop, took over the position full-time in his age-23 season.
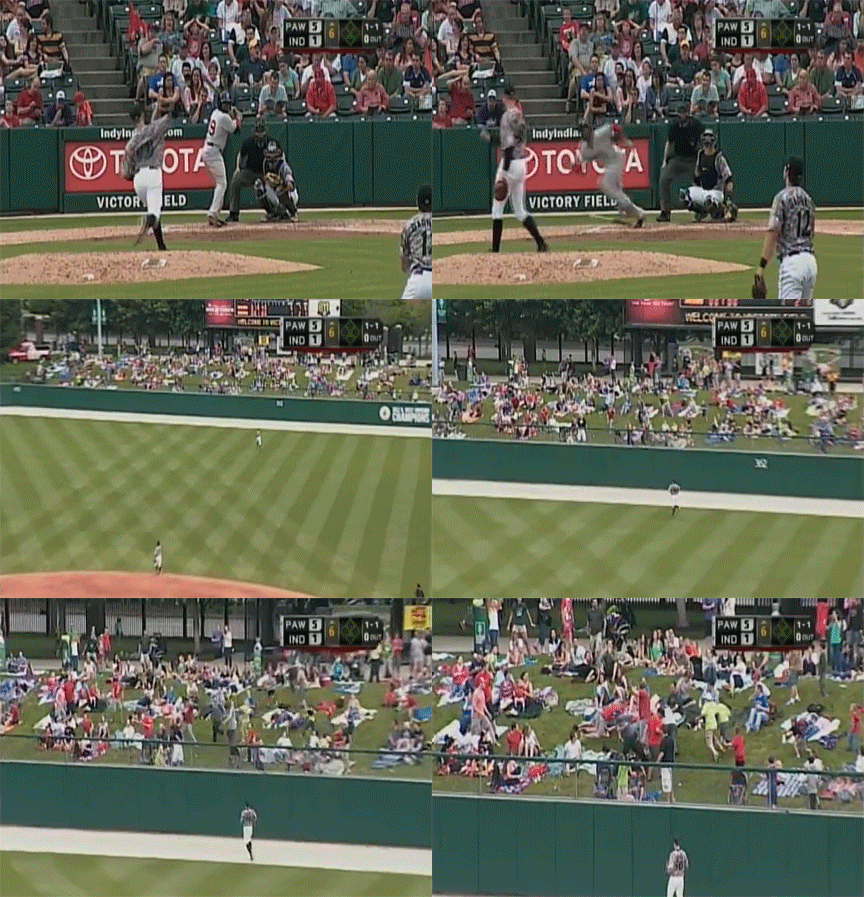
Jbj-hr (overthemonster)

Jackie Bradley Jr.: An outstanding spring earned Bradley Jr. a starting spot in left field for the Red Sox.  He then promptly reminded fans how little spring stats mean, as he has posted a .155/.258/.310 slash line, with a .259 wOBA and 54 wRC+, compiling a -0.4 fWAR in 23 games. A 30.3 K% hampered him in 66 PA with the Sox. Fortunately, his minor league stats have shown much more promise, as he is currently at .278/.378/.489 with a .388 wOBA and 140 wRC+ with Pawtucket. Bradley Jr. has also exhibited good patience with a 12.3 BB%. Plate discipline has been a strength of Bradley Jr’s. game, as he has posted a 14.0 BB% and a 16.7 K% over his minor league career. While his career minor league BABIP% of .350 will likely fall some at the big league level, it will certainly be higher than the .194 this year, with his true talent likely being in the .310 range. Though Bradley is only 31/46 in stolen bases for his professional career, scouts have noted his base running chops. Additionally, his speed, range, throwing arm and instincts give him the potential to be a plus defender. With the likely departure of Jacoby Ellsbury this offseason, JBJ will have every chance to win a starting spot in 2014.
Middlebrooks-dickey-homer-1_medium (GIF from SBNation)

Will Middlebrooks: Middlebrooks burst onto the scene last year, offering a bright spot for the Red Sox during a mostly dismal 2012 campaign. He slashed his way to .288/.325/.509 with a .357 wOBA and 122 wRC+ compiling 1.9 fWAR before a broken bone in his hand ended his season after 75 games. These numbers may have obscured his plate-discipline issues, as his strikeout and walk percentages were 24.5% and 4.5%, respectively. However, 2013 has not been so kind to Middlebrooks, who was sent down on June 25. At the time of his demotion, he was .192/.228/.389 with a woeful .266 wOBA and 60 wRC+, posting a -0.6 fWAR. His K% increased to 27.8%, with his BB% at 4.2%. A major culprit of his struggles are BABIP-related.  In 2012 his xBABIP% was .336, and his actual BABIP% was .335.  This neat symmetry has been dashed in 2013 as his xBABIP% is .327, a far cry from the .221 he has experienced. Furthermore, his struggles have been compounded by a HR/FB % that has dropped from 21.4 to 15.0 despite his average fly ball distance experiencing a small increase from 278.9 to 280.4. Middlebrooks’ batted ball profile suggests that his poor offensive numbers are due for a positive correction. In 40 AAA games Middlebrooks has shown improved contact skills, posting a K% of 18.8% with a BB% of 8.0%, improvements on his career minor league rates of 25.6% and 7.5%. He showed more patience at the plate when I saw him, laying off several breaking balls, and pouncing on a hanger. His BABIP% of .281, compared to his minor league career average of .346, has limited him to a solid but unspectacular .339 wOBA and 107 wRC+. Middlebrooks showed a strong arm and good athleticism and footwork at third, but he occasionally gets sloppy on his throws and his range to his left could be improved.

While Middlebrooks’ stock may have fallen with his struggles in the majors this year, and less than great AAA results, Red Sox fans should not lose faith. His stellar results in 75 games in 2012 may have caused some fans/personnel to gloss over his raw plate approach. While pitchers seemed to do a better job of exploiting that weakness before Middlebrooks’ demotion in 2013, at least some of his poor results can be attributed to a .221 BABIP. His contact rate in AAA has been an improvement on his career minor-league numbers, and despite fewer of those balls in play going for hits, he has managed decent numbers. If Middlebrooks can hold a K% and BB% around 20% and 6-7% at the next level, he should be a very productive player for the Red Sox, as his BABIP% will likely undergo positive regression to go along with his excellent power.


 (Image from overthemonster)

Allen Webster: Webster had a rough go of it over six starts at the big-league level, as the 23-year-old right-hander posting a 9.57 ERA in 26.1 innings with 21 strikeouts and 14 walks and a whopping 7 home runs. While his DIPS numbers were less awful, his 6.57 FIP and 5.07 xFIP earned him a -0.3 fWAR. Nevertheless, Webster showed some promise. Despite a strikeout rate of only 16.4%, Webster’s contact rate was only 71%, well below the MLB average of 78%. When I saw Webster June 28 against Toronto, I was impressed by his fastball, which ranged from 92-97 with sinking action that produced lots of ground balls. In six starts his GB% is 41.8. For the season, his fastball has averaged 94.1 mph, which is 18th highest among pitchers with 20 or more innings. His changeup, which he throws 26.8% of the time is his favorite secondary offering. At an average of 85.3 mph there is good separation from the fastball, and it showed good depth and tilt. His slider, which he throws only 9.8% of the time looked promising, with some late bite. It averages 84.5 mph. He mixed in a couple curveballs at 77mph, but this looked like more of a show-me pitch than something Webster can feature. Generally Webster had a smooth, clean delivery, and his 6’3 frame allowed him to get a good plane on his pitches. His release point faltered as he tired in the 5th and 6th innings. Webster’s control and command will have to progress to realize his potential as a starting pitcher, as his professional walk rate of 10% is on the high side. If Webster can lower his walks and import his minor league 22.3 K% and 3.09 FIP, he could be the Red Sox #2/3 pitcher. If not, his fastball velocity will likely slot him into a high-leverage relief role.
Anthony_ranaudo_curveball_4_27_13_medium (GIF from SBNation)

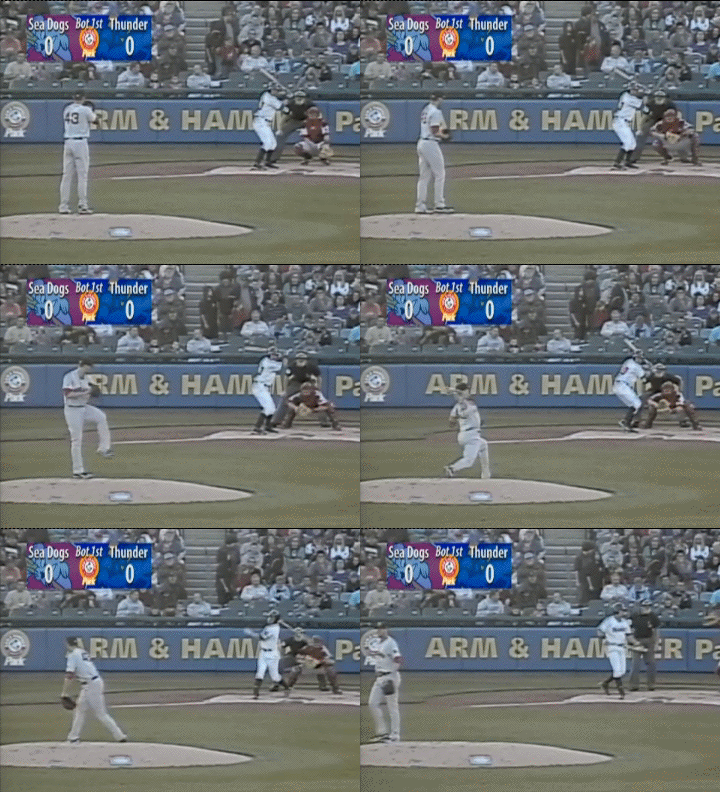
Anthony Ranaudo: The 6’7 225 right-hander from LSU was the 39th overall pick for the Sox in 2010. After posting a 2.95 ERA, 3.51 FIP, 24.0 K%, and 9.7 BB% in 109.2 AA innings, he earned a promotion to AAA.  I caught Ranaudo’s first AAA start, and he went 6 shutout innings with 5 strikeouts and no walks, throwing 85 pitches, 56 for strikes. His fastball was in the 89-92 range, and gets up to 94. It had good sink and a downward plane and produced lots of ground balls. He features a curveball at 75-79 with good downward break as this grainy GIF shows. His changeup could develop into above-average pitch, but is currently an inconsistent offering. Ranaudo’s stock has risen significantly after a lackluster 2012 in AA where he walked 27 hitters in 37.2 innings before having his season shut down due to injuries. If his shoulder and elbow hold up, Ranaudo could be a solid #3 starter at the next level.

 (Image from mlblogs.com)

Brandon Workman: The tall right-hander was optioned to Pawtucket following the acquisition of Jake Peavy. In 4 appearances at the big-league level (3 starts) and 20.1 innings, Workman posted a 3.54 ERA with a 2.75 FIP and 3.11 xFIP, accumulating 0.7 fWAR. Additionally, Workman had stellar strikeout and walk rates at 26.8% and 4.9%, respectively. His repertoire consists of a fastball which has averaged 91.8 mph, and a cutter, curveball, and changeup, which have improved to become average to above-average pitches. Workman has had consistent success throughout the minors, with a 23.4 K%, 6.9 BB% and 3.33 FIP. Moreover, he has been durable, throwing nearly 400 professional innings over 2+ seasons. While Workman will be pitching out of the bullpen in Pawtucket with the possibility of returning to the majors in that role down the stretch, long term he projects as a quality back-end innings eater. At his worst he is probably a lower-leverage bullpen arm.

 (Image from randombaseballstuff)

Bryce Brentz: A power-hitting outfield prospect for the Sox, Brentz is likely to miss the remainder of the season following right-knee surgery to repair a torn meniscus suffered on a slide into second base July 5th. Brentz also missed spring training in 2013 after accidentally shooting himself in the leg. Prior to the knee injury Brentz had a slash line of .272/.321/.487 with a .359 wOBA and 120 wRC+. Brentz’s biggest weakness is recognizing breaking balls, and he has posted 2013 strikeout and walk rates of 23.5% and 5.9%, respectively. His impressive minor-league stats are fueled in part by a career .332 BABIP, which is likely to fall to the .260 range at the major-league level. Brentz is not a great runner, and the knee surgery will likely affect his slightly below-average range. A former two-way player, Brentz does feature a very strong arm which resulted in 10 outfield assists in 87 games in 2012. Brentz is unlikely to post high walk rates, so future big league success will depend heavily on tapping into his impressive raw power while keeping his strikeout rate from ballooning above the 20-25% range.

—

Stats provided by Baseball-Reference, FanGraphs, and baseballheatmaps.com. Thanks to Marc Hulet’s prospect rankings for additional insights.


Why the Blue Jays should have dealt Casey Janssen

The Blue Jays were in a tough spot this trade deadline. They came into the season with huge expectations and as you may know they have failed to live up to those lofty expectations. They should have been sellers in my opinion this deadline; instead they decided to hold, which is understandable as most of the core is at least signed though next season. Casey Janssen is considered one of those core pieces.

With that being said here are three reasons why I think that Janssen should not be a core piece and should have been dealt this past deadline.

Reason #1 Get a piece for the future.

Here’s how Janssen compares to the other “proven closer” who got traded this deadline.

Name ▾ IP BB% K% HR/9 BABIP LOB% GB% HR/FB ERA FIP xFIP WAR RA9WAR
Casey Jannsen 34.1 6.7% 25.4% 0.26 0.225 67.6% 48.3% 3.7% 2.36 2.32 3.03 1.1 0.9
Jose Veras 44.0 8.1% 25.6% 0.82 0.234 76.7% 45.9% 9.3% 2.86 3.39 3.56 0.6 0.9


The numbers are similar but clearly Janssen has been better this season, meaning he could have brought back something better than Danry Vasquez who the Astros got for Veras. That type of prospect could have helped the Blue Jays’ depleted system recover somewhat from all the off-season trades.

Reason #2 Blue Jays have a replacement closer in the wings.

If Janssen had been dealt the Blue Jays could have handed the closer’s job to all-star Steve Delabar. Delabar has all the traits you look for in a closer: he throws hard, averaging a touch over 94mph this season. He gets strikeouts, 13.59 K/9 and 34.7% K rate. He is also getting good results sporting a pitching triple slash line (ERA/FIP/xFIP) of 2.90/2.44/3.11.  He also doesn’t have a platoon issue, allowing a .297 wOBA against righties and a .304 wOBA against lefties. I don’t see how the Blue Jays management could have a problem giving Delabar a shot at the closer’s job if they had dealt Janssen.

Reason #3 Janssen is declining

This is the big reason why the Blue Jays should have dealt Casey Janssen. His skills are declining and selling him now would have been the perfect time before he potentially implodes next season. Here’s why I see Janssen declining and not being the same next season. He will turn 32 this September so he is on the wrong side of the pitcher aging curve. He is at that age where across the board numbers usually begin to decline, and we are already starting to see that this season.  Let’s start with velocity; he is down almost 2MPH this season from 91.7mph the last 2 seasons to 90.0mph this season. We know velocity is highly correlated with strikeouts so it’s not surprising to see a significant drop in both his K/9 and K%. His K/9 is down from 9.47 last season to 8.91 this season and his K% has dropped from 27.7% to 25.4%. His swinging strike rate has never been great but it peaked last season at 9.5% which was just barely above the league average. It has dropped back to 2010-2011 levels at 8.2% and is now below average. His O-Swing rate is down, which leads me to believe his stuff isn’t fooling batters as it had in the past, and it supports why his walk rate has shot up from 1.55 BB/9 last season to 2.36 this season.

We can clearly see his skills are declining, but despite all that Janssen has managed to post the best FIP and xFIP of his career. I see this as being significantly influenced by luck. He is posting the lowest BABIP of his career at .225 vs. a career .290; his HR/9 and HR/FB% are also at career lows sitting at 0.26 and 3.7% respectively. Pitching in Toronto you have to figure there is no way he keeps suppressing home runs at his current rate.

To sum this up, we have a closer who has declined across the board, who will be 32 next month, and who is getting results by suppressing home runs in a hitter-friendly park. Yet he was kept around despite the possibility of being able to get a decent prospect and having a potential closer replacement waiting. But hey who knows what will happen in a year from now, maybe Janssen will keep it up for one more season and make me look like an idiot, but I wouldn’t bet on it.


What Kind of A-Rod Will We See?

News Today

     The Yankees welcomed Third Baseman Alex Rodriguez in Chicago today to make his season debut tonight against the White Sox.  A-Rod is expected to be in the lineup, returning to his original position for the club.  The other major event on Monday is Commissioner Bud Selig announcing the suspensions of 12 players for 50 games, and Rodriguez’s 211 game suspension, which takes effect  on Thursday, August 8th.  This has been appealed by A-Rod already as reported by the MLB Twitter account.   A-Rod will be on the active roster through the appeal process, and  should be able to play a few weeks before his status is ultimately decided on, so what can we expect to see from him on the field?

Click for a Full-size Image

Looking at his Performance

     Rodriguez played in 15 minor league rehab games to ease his return to the big leagues from off-season hip surgery. In those games, he hit .214 with a double, and 3 HR, while driving in 10 runs.  In this extremely small sample size of varying levels, it’s difficult to make any reasonable assessment.  However, we can look at a few peripheral statistics to try and gauge they type of A-Rod we’re going to see.  In his 51 minor league plate appearances, A-Rod struck out 13 times and walked 6.  This leads to a 25.5% K-Rate and an 11.8% BB-Rate.  The small sample size accounts for a large amount of error, but these numbers don’t appear to be too drastically apart from his usual self.  A-Rod’s career K-Rate is 18.2%, and it is 19% over the last five seasons.  As he’s aged, Rodriguez’s strikeout numbers have marginally increased, and seems to be following that trend.  He walked 10.9% of the time over his career, and 11.3% over the last five seasons.  A-Rod has become a more disciplined hitter with time, as pitchers have also been more cautious and pitch around him at the plate.

     Due to A-Rod’s K% and BB% in the minors seeming to be fairly stable compared to his past performance, I believe that we’ll see A-Rod maintain his current career trajectory.  His durability is not what it has been in the past, but he should return to the player he would’ve been in 2013, injury or not.  I don’t see a sudden huge drop-off, or surprising upturn in performance happening.

Career Trajectory

3
Click for a Full-size Image

     The following three plots show A-Rod’s Career trajectory in OPS (On-Base Percentage Plus Slugging Percentage), wOBA (Weighted On-Base Percentage),wRC+ (Weighted Runs Created, adjusted to the league where 100 is average), and WAR/162 (Wins Above Replacement prorated for 162 Games).  In all of the categories, higher numbers indicate a better performance.  I used 4th power exponential trend lines to approximate in all of these cases except for WAR, where I used a 6th power polynomial to account for the increased variance.

Click for a Full-size Image

     The reason for choosing a 4th degree polynomial is that I believe it truly reflects the path of A-Rod’s career.  He burst on to the scene during his first full year in 1996 with the Mariners, as he was named an All-Star, won the Silver Slugger Award, and finished 2nd in MVP voting.  His line that year was .358 / .414 / .631 and an OPS of 1.045.  Rodriguez experienced a “Sophomore Slump” if you can call it that where he hit a measly .300 / .350 / .496 and an OPS of .846, garnering his second All-Star Game appearance.  it would take A-Rod two more years to return to his 1996 performance, causing this first curve.  This curve started slowly climbing upward in 2001, his first year with the Rangers where Rodriguez admitted steroid use due to the pressure he felt to perform.  He reached his peak in 2007, an MVP season where he hit .314 /.422 /.645 with an OPS of 1.067 and 54 Home Runs, the most of his career.

Click for a Full-size Image

     This is where his current downward trend begins, as A-Rod began creeping into his mid-late 30s which bring us to where we are today.  I’ve indicated A-Rod’s drop-off since 2007 by the vertical black lines.  Notably, A-Rod’s agent Scott Boras announced during the Game 4 of the 2007 World Series, as the Red Sox were about to clinch a championship, that Rodriguez would be opting out of his contract.  The Yankees initially didn’t want to negotiate with A-Rod, but later signed him to a new deal, worth $275MM over 10 years.  Seeing A-Rod’s current decline, this was not a good move for the Yankees.  However, this was perfect for A-Rod, as he secured the deal coming off of an MVP caliber season when his value was the highest.  It’s just Boras working his magic again.

     Alex Rodriguez is on a downward decline, but as stated earlier, we should see a version of A-Rod resembling what he would be if he never missed time for injury.  This is a much needed boost for the Yankees, as their 3B for the year have accumulated a -0.9 WAR, which is 26th in the league.  With A-
Rod, who I projected to have a 2.1 WAR, the Yankees greatly improve at his position.  Assuming A-Rod plays 15 games before we know the results of his appeal, he’ll accumulate a 0.19 WAR, while the Yankees other 3B options would produce a -.08 WAR based on their performance this season.  This is a 0.27 WAR swing for the Yankees.  If you prorate this over a 162 game season, this would be a 2.92 WAR improvement which is on the Solid Starter/Good Player borderline.  For however long the Yankees have Alex Rodriguez in the lineup, he will be a huge improvement in their lineup.  It’s just a question of how well A-Rod can focus on playing during one of the most controversial and stressful times in his long career.


The Curious Case of Cody Dent

From my personal blog: msilbbaseball.wordpress.com

Path to the Draft

     What’s the usual story with first-year draftees?  They put up stellar numbers in college and/or high school, but can’t replicate those numbers after they’re drafted due to better competition in the minors.  A college All-American who hit .400 can struggle to stay above .200 as they adjust to minor-league ball.  It’s nothing to worry about, just the way things go.  So what would you expect to see from a college senior infielder, converted outfielder, converted back to infielder who hit .176 in 330 career at-bats, who didn’t hit a home run until the end of his last season, and who only had six extra-base hits in his entire college career?  I’d have my doubts that this player would even record one minor-league hit.  However, I present to you Cody Dent, the man who’s mirroring the trend.

Speaking of home runs, his father did this.

     Cody played for four years at the University of Florida, and reached the College World Series three times.  Throughout his career, he was a light-hitting utility infielder who saw a majority of his time as a defensive replacement.  During his senior year, Dent started 48 games for the Gators, but his struggles at the plate still remained.  Cody hit .233 his freshman year, then .207, .134, and .169 in each subsequent season.  But, he’s 6th on UF’s all-time sacrifice bunt leaderboard with 26 in his college career.  So, that’s something; It seems like he’d make a good-hitting pitcher.

Cody Dent Bunting for the University of Florida

     Dent’s bright spot was the 2011 NCAA Tournament, where he played in and started 11 games, and hit .273 with a double, triple, and 4 RBIs as the Gators made it the championship series in Omaha.  He was named to the All-Tournament team.  Following his senior season, the previously undrafted Dent was selected by the Washington Nationals in the 22nd round of the 2013 First-Year Player Draft, likely/hopefully for his defense.

Faux-Struggles?

     As a student a the University of Florida, I attended a large amount of baseball games, and I always rooted for Cody to do well.  He never showed negative body language, and went about his business professionally.  Also, he was the king of the “at ’em ball”.  I can’t count how many times he’s hit a rope right at an outfielder.  I always imagined what kind of horrible BABIP Dent would have, so I calculated it.  During his senior season, Cody Dent had a .193 BABIP.  With an average BABIP ranging from about .290 – .310, this created a huge dent in his average (pun intended).  Some players have established BABIPs in a different range (ex. Miguel Cabrera and Ichiro Suzuki around .345), however .193 can not be the true average for an SEC starter with MLB bloodlines.  By personally watching Dent play, I can also attest that he’s better than the numbers show.  I consider BABIP to be a measure of luck, and use it to determine whether a player is playing at their true ability.  A BABIP far under the average means that a player is under performing, and a BABIP far above the average means that a player is over performing.  To re-iterate, Dent’s senior BABIP was .193.  This, coupled with only an 11.7% Strikeout Percentage (K%) creates a sense of hope that Cody could grow into a serviceable/not as dreadful bat.

Dent’s Adjusted AVG

Professional Performance

     So what does he do during his first 27 games in Short-Season A ball?  Hit .278/ .365 /.300 with a .326 wOBA and a 108 wRC+.  With 100 being the standard average for wRC+, this means that Cody Dent is an above-average producer in Short-Season A ball.  ABOVE AVERAGE!!!  Considering the offensive woes he went through as a Gator, this is absolutely huge.  Maintaining his improved offense will be a challenge for Cody, as he’s in danger of regressing.  Dent’s minor-league BABIP is .387, way above average, and astronomically above his college numbers.  Is this a sign of the real Cody Dent?  Is he having a lucky month?  Or has Cody Dent gone through enough punishment and suffering from the baseball gods that they’re rewarding him for his perseverance?  It’s time to sit back and watch The Curious Case of Cody Dent.

Like Father, Like Son

     Also, now he’s breaking up perfect games. This came against the Lowell Spinners, the Boston Red Sox’s New York-Penn League team.  The pure perfection of this can’t be explained. Cody “Bleeping” Dent!


The Art of Doubling to the Pitcher

Kendrys Morales and Gerardo Parra aren’t two players you tend to think about together. Parra is an elite defensive player with solid offensive skills and Morales is a slugging DH. Parra walks a little bit more and strikes out a little bit less, but Morales makes up for that differential by slugging about 80 points higher. Parra stands right around average at the plate in 2013 with a 99 wRC+ and Morales is above average at 138 wRC+. They’re both valuable in different ways, but they are also the only two players to date in 2013 to be credited with an extra-base hit to the pitcher.

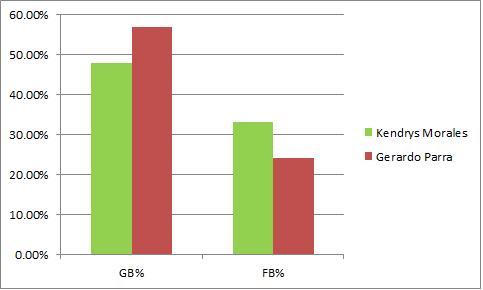
Their batted ball profiles are quite different as Parra tends to put the ball on the ground and Morales makes his money in the air.

gbfb

Parra swings more often and makes more contact along the way, but Morales seems to hit the ball with more force considering his higher home run total in a less hitter-friendly park. These are two players who aren’t all that similar but happen to be the only players to accomplish one of the stranger feats in baseball during the 2013 season.

Up front, it’s important to know this comes from Pitch F/X classifications, meaning that the play had to be scored a double, triple, or home run and it had to be fielded by the pitcher or hit into his zone. I don’t know exactly how the latter determination is made but I will assume that there aren’t massive mistakes in classification. I’ve watched Parra and Morales’ hits to confirm, but I obviously haven’t watched every double this season to make sure there aren’t any missing points.

What’s wonderful about these two extra base hits to the pitcher (both doubles) is that they match the respective players so perfectly.

May 5, 2013 – Mariners at Blue Jays

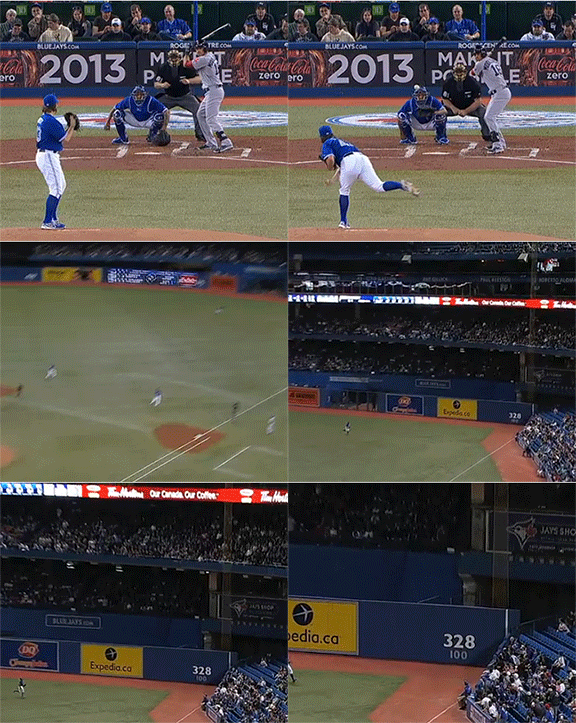
With Brandon Morrow on the mound Morales came to the plate in the Top of the 8th inning and worked a 1-1 count. Amazingly, before Morrow could throw his 3rd pitch of the at bat, a fan ran onto the field and stopped play. I have no idea if that was responsible for what happened next, but the coincidence is too hilarious not to mention.

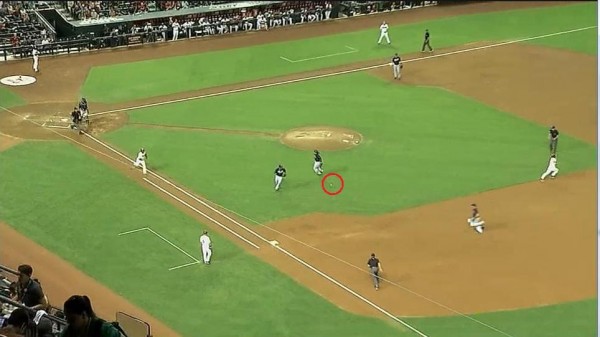
When play resumed Morrow came at Morales with an 85.7 MPH slider which the Mariners’ DH hit way up into air. With the roof open and sun beating down, the infielders converged toward the back of the pitcher’s mound to field the routine pop fly.

3

There are three professional athletes within 10 feet of where the baseball is going to land and they are all close enough to make the play quite easily. However, things take a comical/terrible turn depending on your personal feelings toward the Blue Jays.

4

As you can see, hopefully, Encarnacion called the ball vigorously and then fell over causing the third baseman to jump out of the way and lose sight of the ball, thus removing any hope of catching it himself. The baseball bounced about 10 feet into the air and Morales, who had been hustling, cruised into second base.

Morales hit his double to the pitcher in a very Morales fashion. He hit a fly ball and the defense didn’t catch it. The fan who ran on the field may have been in the minds of the players, but it’s more likely Encarnacion was trying so hard to fight the sun that he forgot about the hill located in the center of the diamond.

May 14, 2013 – Braves at Diamondbacks

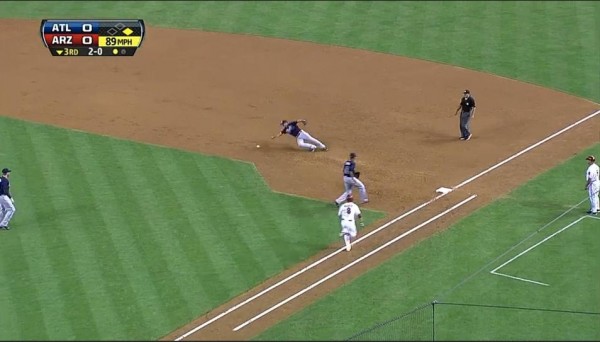
In the Bottom of the 3rd, Cliff Pennington stood on first base and Julio Teheran climbed onto the mound. Parra dug in and took the first two pitches for balls, putting him into a nice hitter’s count. On the next pitch, Teheran delivered an 89.3 MPH fastball with some nice tailing action that Parra slapped to the right side.

2

You can see the baseball came right between the pitcher and first baseman as neither could make the play on the weakly hit bouncer. Generally this situation should result in a respectable infield single. After all, if I hadn’t prepared you, it would seem likely that the second baseman would pick up the ground ball and hold the runners at 1st and 2nd. You can see the third baseman is manning his position and just off the screen I assure you the shortstop is doing the same.

However, it didn’t exactly happen like this. Dan Uggla over-ran the ball, perhaps because he was expecting to run to the bag and couldn’t decide quickly enough to change course.

6

As a result, the pitcher had to back up the second baseman on a ground ball as Parra hustled into 2nd base.

1

This strikes me as a very Gerardo Parra type of hit. He put it on the ground and used his legs to turn it from an infield single into an infield double. It required a defensive mistake, but it was a defensive mistake that was, in part, forced by his ability.

Didi Gregorius singled in the next at bat to plate the Dbacks only two runs of the game, which also happened to be decisive in their win over the Braves. The final score was 2-0, so Pennington would have scored the winning run even if Uggla made the play on Parra, but it’s possible the defensive implosion took focus from Teheran or simply exhausted him given how far he had to run to make get the ball and resulted in poorer pitches

Nothing came of the Morales double as the Mariners didn’t score and went on to lose 10-2 despite that double coming as a result of much more egregious defensive play. Parra was going to have a single unless the Braves made an excellent play, but Morales shouldn’t have been on base at all. Apparently, the Baseball Gods agreed and didn’t punish Morrow as much as Teheran.

Baseball is often remarkable for the strange things you see. If you had to guess which two players doubled to the pitcher in 2013 you probably wouldn’t have picked Morales and you probably wouldn’t have expected that neither case involved someone failing to cover second base. This is one of those wonderfully weird moments in baseball that ties together to very different players with an odd set of circumstances.

Twice this season a player has doubled to the pitcher and both times that player did so in a way that was partly in line with their style of play, but both were very different. In one case the play was critical to the outcome and in one case it was meaningless.

Doubles to the pitcher are rare as a database search going back to 2008 reveals these as the only two. They happened nine days apart and are the only extra-base hits to the pitcher recorded by Pitch F/X in the last six seasons. Next time something like this happens, maybe the batter will try to stretch it into a triple in order to have an honor all his own.


Joe Blanton Defies the Odds

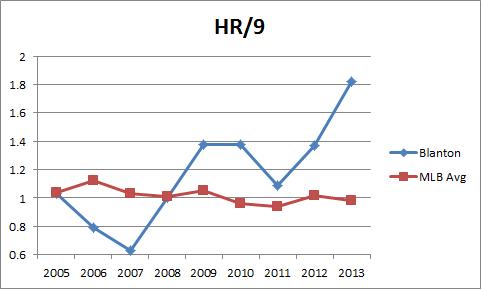
Let’s start with a picture. What it communicates won’t surprise you and it tells you essentially two things. First, over the last nine seasons, we’ve seen a modest decline in home runs. Second, that doesn’t apply to Joe Blanton.
HR9
Now, Blanton has had a respectable career. He’s accumulated 19.3 WAR which is good for about 2 WAR per season and in all but one of his seasons, he has provided or is on pace for at least 175 IP. He has essentially been the definition of an innings-eater with a flash of greatness in 2007.

But over the last few seasons, Blanton has turned himself into one of the most homer-prone pitchers in baseball. Since the start of 2010, only three qualifying pitchers have allowed more HR/9 than Blanton’s 1.45 mark. It’s not terribly interesting that Blanton started giving up more home runs when he moved from Oakland to Philadelphia, but it is interesting that he’s giving up even more this season since moving to Angels Stadium.

In fact, Blanton’s 2013 mark is the 9th highest HR/9 total in the xFIP Era (2002-present). You’ll notice something interesting about the list of the qualifying pitchers who have given up the most home runs:

Rank Season Name IP HR/9 xFIP-
1 2011 Bronson Arroyo 199 2.08 118
2 2012 Ervin Santana 178 1.97 108
3 2004 Jamie Moyer 202 1.96 109
4 2008 Brandon Backe 166.2 1.94 112
5 2004 Eric Milton 201 1.93 110
6 2005 Eric Milton 186.1 1.93 116
7 2006 Carlos Silva 180.1 1.90 107
8 2004 Darrell May 186 1.84 110
9 2013 Joe Blanton 119 1.82 95
10 2009 Braden Looper 194.2 1.80 113
11 2005 Ramon Ortiz 171.1 1.79 110
12 2004 Brian Anderson 166 1.79 119
13 2006 Jeff Weaver 172 1.78 105
14 2004 Ismael Valdez 170 1.75 123
15 2004 Jose Lima 170.1 1.74 97

Most of them aren’t great even if you factor out their fluky high HR/FB rate and home park, and Joe Blanton is the only pitcher in the top 14 on this list with an xFIP- below 100. He’s getting a decent number of ground balls (43.7%) and his K% (18.1%) and BB% (5.2%) are both pretty good. Usually guys who give up a ton of long balls are also doing a lot of other things poorly. Blanton doesn’t seem to be on the surface.

But with an ERA of 5.52, FIP of 4.82, and xFIP of 3.81 it makes you wonder exactly what’s going on. This is a pitcher who has a solid strikeout profile, good walk numbers, and a solid ground ball rate. Not only should that lead to pretty good run prevention, but it shouldn’t go hand in hand with a high HR/9.

gb

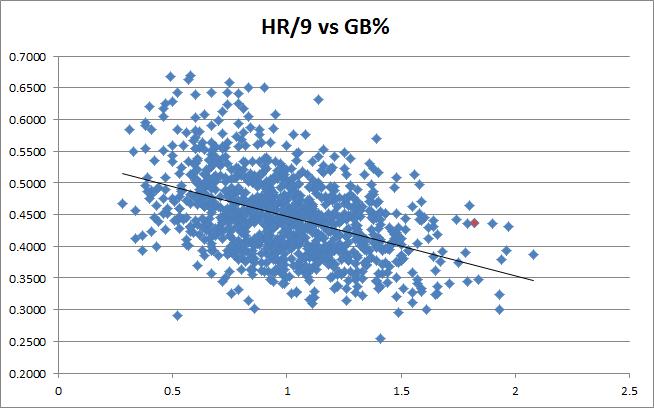
These are all the qualifying seasons since 2002, with Blanton labeled in red. Of pitchers in that cluster of HR/9 above 1.7, only Braden Looper in 2009 had a higher GB%. On average, pitchers who throw 43% ground balls allow around 1.00 HR/9. Everything about Blanton’s huge homer total screams that the HR/FB rate is unsustainable. It’s 17.3%. It will come down.

It’s the highest of his career, but he’s now calling Los Angeles home. He gave up more home runs when he moved from Oakland to Philly, but now he’s giving up more in his move from Philly to LA.
hrfb

Look at that trend. It makes sense that it would go up between 2008 and 2009, but it went up every year he was in Philadelphia and is going up again now that he’s in a pitcher friendly park. Keith Law remarked recently that HR/FB and BABIP regression paradigms don’t apply to guys with stuff as poor as Blanton’s, and while I’m not sure I would go that far, this information has me wondering.

This doesn’t look like luck to me. You buy the first jump because of the ballpark and I know it’s only been 120 innings this season, but this is the 10th highest HR/FB% since 2002. And only one pitcher who has posted a higher HR/FB% had a GB% below 50%. In other words, the guys who have the really bad HR/FB% are usually guys who don’t allow many fly balls to begin with.

Season Name Team GB HR/FB xFIP-
2003 Odalis Perez Dodgers 53.00% 19.70% 79
2013 Roberto Hernandez Rays 51.60% 19.60% 89
2012 Ervin Santana Angels 43.20% 18.90% 108
2005 Derek Lowe Dodgers 63.10% 18.90% 81
2005 Brandon Webb Diamondbacks 65.00% 18.80% 70
2004 Greg Maddux Cubs 50.90% 18.20% 79
2013 Jason Marquis Padres 52.30% 18.20% 128
2012 Henderson Alvarez Blue Jays 57.00% 18.10% 107
2007 A.J. Burnett Blue Jays 54.80% 17.70% 79
2013 Joe Blanton Angels 43.70% 17.40% 95

It’s reasonable to expect some regression because that’s always the reasonable thing to do, but Blanton’s HR/9 and HR/FB% have gone up since moving to a better park. It’s worth considering if there is something about Joe Blanton that’s causing this to happen because pretty much everything else he’s doing seems to be working. In fact, if you normalize his home run rate he’s actually above average even now that he’s back in the AL.

What stands out to me is what hitters are doing against his four-seam fastball according to Pitch F/X data. 12 of his 24 HR allowed have come on the fastball, and he’s allowed a .442 wOBA against that pitch, which is the pitch he throws most often in 2013. Against the fastball, he’s allowing a 27.3 HR/FB% and has allowed the ball to be hit in the air more often against it than any other pitch at 32.8%. Let’s take a look at the average movement on his four-seam fastball:
x
z

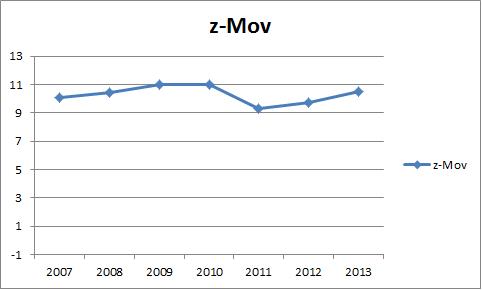
The vertical movement fluctuates some over time but it’s getting worse since 2011 and the horizontal movement is trending in a bad direction especially considering he’s throwing this pitch more often than anything else he’s got. Some of this could be classification issues, but the basic numbers say this is his main pitch and it’s not moving nearly enough. It was never a great pitch, but now it’s one of the straightest fastballs in the game and he’s getting crushed on it.

Of the 12 HRs he’s allowed on fastballs, the average velocity was 89 mph with less than three inches of horizontal break, and only one missed the strike zone. Those aren’t flukes, they are asking to be crushed. Here’s a look at his home runs allowed this year with Angel Stadium superimposed. He’s not giving up too many cheap ones considering the size of that stadium.
ang

I’m not sure I have a perfectly clear conclusion to offer. If you only looked at Blanton’s 2013 stat line, you’d feel pretty confident that his HR/FB% would come down and he would pitch closer to his xFIP going forward given the decent strikeout, walk, and ground ball numbers he’s putting up. But if you look at his 2013 in the context of his other seasons and in the context of recent history you come to a different conclusion. If you’re looking with a wider lens, it seems as if Blanton isn’t going to rein in the home-run rate.

The trends don’t look good for Blanton who is allowing more home runs than ever before after moving to a bigger park thanks to a fastball that has less bite than at any time in his career. He’s throwing 89 mph heaters with little life down the middle and opposing hitters aren’t missing. This doesn’t seem like something that’s due for regression, it seems like it’s a function of the pitcher Blanton is right now.

I haven’t watched his starts closely, so perhaps an Angels fan can speak to this better, but I think I might bet against a whole lot of regression in this case. I think Law’s point my be valid, at least in this case. Blanton’s fastball might not be good enough for us to apply our standard beliefs. Blanton might be the exception that proves the rule.

Normally we expect a pitcher’s HR/FB% to come back to the pack, but only if that pitcher’s skills are close enough to average. Maybe that’s what we’re seeing with Joe Blanton in 2013. He’s routinely throwing a pitch that isn’t good enough to get hitters out and it’s costing him. It’s also possible that this is all a mirage and things will even out with more time.

I don’t have a perfect answer, but I think it’s worth raising the question and following Blanton’s season the rest of the way in order to find out.


Getting Ahead with Wainwright and Moore

If I were to argue that Adam Wainwright and Matt Moore were having similar seasons, you’d probably question my analytical skills. They have similar win totals and are both major-league starting pitchers on good teams, but you generally wouldn’t consider them to have a lot else in common when thinking about them in the context of their contemporaries. Heck, they don’t even throw with the same arm! I’m not going to argue that they’re having similar seasons, but there is one thing they are doing at a surprisingly similar rate. Allow me to explain.

Let’s start by talking about how they are different. Wainwright goes much deeper into games, walks way fewer batters, gets a lot more ground balls, and limits runs a better rate. FIP and xFIP like him a lot better, no doubt because he doesn’t issue free passes. Moore strikes out more batters, but other than that he doesn’t measure up to what Wainwright brings. Wainwright is right in the thick of the NL Cy Young race, Moore is just having a solid season.

Name GS IP K/9 BB/9 HR/9 BABIP LOB% GB% HR/FB ERA FIP xFIP WAR
Adam Wainwright 21 154.2 7.97 0.99 0.35 0.308 76.30% 49.10% 5.30% 2.44 2.20 2.72 4.9
Matt Moore 20 116.1 8.66 4.33 0.62 0.252 77.00% 39.00% 6.20% 3.17 3.56 4.22 1.9

The comparison comes as a byproduct of some aimless leaderboard scanning and a stray thought. I started wondering about the correlation between Zone% and BB%, much in a similar way to how Jeff Sullivan considered the connection between Contact% and K% earlier this year. My study led me to the production of this graph, with BIS data through July 24:

Zone

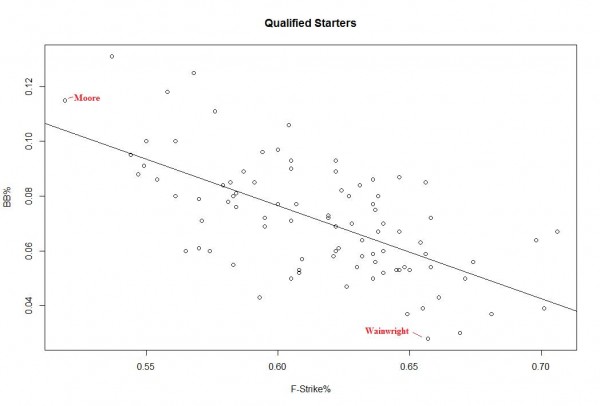
Generally, a higher Zone% correlates with a lower BB%. The slope coefficient is -0.33 and is statistically significant, but the Adjusted R squared is only .2116. Pitchers who pound the zone usually walk fewer batters than pitchers who don’t, but there is a lot of unexplained variation. Matt Moore and Adam Wainwright carry quite a bit of the blame for that as they have nearly identical Zone% and extremely different BB%. In fact, Wainwright is 1st in BB% and Moore is 87th among qualified starters.

Wainwright has a K/BB ratio above 8. Moore’s is 2. Wainwright and Moore both strike out between 22 and 24% of the batters they face, but Wainwright walks less than 3% and Moore walks more than 11%.

Amazingly, Wainwright and Moore throw 44.5% and 44.2% of their pitches in the zone, respectively, despite what their walk rates seems to be telling you.

If you give them both 100 pitches and 25 batters, they’ll both average 55-56 strikes but Wainwright will walk fewer than 1 and Moore will walk close to 3. That’s impressive. No other two starters in baseball this year have such similar Zone% and such different walk rates. (Ubaldo is the data point above Moore, but he is a full percent behind Wainwright in Zone%)

Name O-Swing% F-Strike%
Adam Wainwright 38.40% 65.70%
Matt Moore 28.50% 51.90%

Well that’s something. Wainwright and Moore throw the same number of pitches in and out of the zone, but Wainwright gets batters to chase when he leaves the zone much more often and starts at bats with strikes much more often as well. It’s pretty interesting that two pitchers can throw the ball in the zone with the same frequency and get such dramatically different results.

You can see that despite hitting the zone with similar frequencies, Wainwright hits the zone early to set up chases later on in the at bat. Here are their zone plots on first pitches.

Wainwright
Wainwright

Moore
Moore
Wainwright and Moore are a great example of how averages can sometimes be deceiving. Despite throwing the same percentage of pitches in and out of the zone, they are throwing them in and out of the zone at much different times. Wainwright pounds the zone early and gets hitters to chase late. Moore misses more consistently.

Think of it this way. When Wainwright throws a pitch out of the zone, he’s doing it when he’s ahead in the count so hitters are forced to chase and get themselves out. Moore leaves the zone with less purpose and more because he doesn’t have great control. It balances out to the same percentage, but the effects are much different. You can see it in BB%, you can see it in ERA, and you can see it in FIP and other advanced stats.

Matt Moore is still a very promising young pitcher and is still quite valuable in his current form. Nothing about this is meant to degrade Moore, but rather to highlight some extreme variation and consider how important it is to get ahead of hitters. By the third and fourth pitches in at bats, Wainwright has hitters chasing and Moore has hitters taking.

Getting ahead early with a first-pitch strike is really important as it is much more predictive of BB% than Zone%. The slope coefficient is nearly identical to Zone%, but the Adjusted R Squared comes in at .4020.

FStrike

Finding the zone is important, but as Wainwright and Moore demonstrate, finding the zone early is more important. Matt Moore has tremendous stuff, but if he hopes to get results to match Wainwright, he’s going to have to command it more effectively, even if he is hitting the zone with the same frequency.

Moore doesn’t really profile as a Wainwright kind of pitcher, but Wainwright’s own impressive drop in BB% rate can be instructive for pitchers looking to improve. Wainwright is throwing pitches in the zone less frequently as he’s aged, but is adding to his first-pitch strikes. I’ll let the data speak for itself. Adam Wainwright is fantastic.

ZF

BB


The New John Lackey

Earlier this season, while writing a piece on Rick Porcello’s breakout, I noticed he was mixing a certain combination of skills that seemed both interesting and valuable. He was striking out more than 7 hitter per 9, walking fewer than 2, and also inducing a ground ball rate above 50%. The story with Porcello was the increase in strikeouts, but it also put him in some excellent company. Going back to 2002 (when GB% becomes available) the list of qualifying pitchers to meet those criteria is short and impressive. Roy Halladay (4), Chris Carpenter (3), and Cole Hamels (1). Porcello is doing it this year and so is John Lackey. And Lackey’s story might be the most interesting.

(Note: K% and BB% tell a similar story, the cut-offs are just harder to express and are not the real focus of the article.)

Porcello’s key was an improved changeup and new curveball that induced more strikeouts, but Lackey has actually improved his numbers in all three categories pretty dramatically. Even if we accept that Lackey’s 2011 numbers were depressed due to the coming injury, if you take his career numbers and place them next to his 2013 season, the change is quite interesting.

Season IP K/9 BB/9 HR/9 BABIP GB% HR/FB ERA FIP xFIP WAR
2002-2012 1876 7.03 2.73 0.91 0.309 43.20% 9.10% 4.10 3.91 4.08 34.7
2013 106 8.44 1.94 1.18 0.290 50.80% 14.70% 2.95 3.64 3.18 2.1

At 32, Lackey is getting better. Certainly he had some excellent seasons from 2005-2007 when he exceeded 5.0 WAR for three straight years, but this performance is quite something. He’s getting more strikeouts than in all but one year of his career and he’s posting the best walk rate and highest ground ball rate in his career by substantial margins. The results are better if you look at ERA, FIP, and xFIP as he’s never had a lower ERA or xFIP and only bested this year’s FIP during that run from 2005-2007.

Lackey is having a career renaissance. But the interesting thing on the surface is that Lackey’s velocity isn’t much different and his pitch selection isn’t either. He’s got the same repertoire and it seems to be of the same quality. But looks can be deceiving.

A word is needed up front regarding pitch classification. Pitch F/X seems to think he’s throwing a different mix of pitches, but it’s actually just classifying them differently. You can see in the two charts below, from 2011 and 2013, that the velocity and horizontal movements are quite similar, but the pitches are being called something different.

Lackey Velocity, H-Movement in 2011

Lackey Velocity, H-Movement in 2013

His velocity isn’t much different from his rough 2011 campaign and the location of the pitches aren’t terribly different either. He’s routinely working low and away to both RHH and LHH this year just like he did in 2011.

This doesn’t seem to be about stuff or location, and this isn’t an increase in performance driven by BABIP because the indicators I’m looking at are entirely within the pitcher’s control This is an analysis about an increase in strikeouts, a decrease in walks, and an improvement in GB%. Lackey is getting better results because he’s doing well in those categories. Yet he’s not throwing harder and he’s not throwing much differently than he did in one of his worst years.

Well, not so fast. There is one key difference that I’ve been able to find and I think it can explain why Lackey is doing so much better. Let me start by pointing out some even more interesting tidbits. First, Lackey is throwing fewer pitches in the zone overall while inducing much less contract overall with virtually the same swing percentage as in 2011. His first-pitch strikes are up but are not much different than his career norms. Lackey is getting more swings and misses, which could point to the strikeout increase. But Lackey is also hitting the zone less often, which means a good portion of the walk decline is coming from batters swinging at pitches outside the zone. That all makes sense to some degree.

Lackey is getting more swings and misses via pitches out of the zone, so his strikeouts are up and his walks are down. But the increase in GB% is the aspect about which I was most curious and it fits in with what I believe is cause the strikeout and walk transformation.

Lackey isn’t throwing harder, the ball isn’t moving more horizontally, and the general location of his pitches haven’t changed. What has changed is the vertical movement on a subset of his pitches. It’s hard to notice when you’re looking at season averages, but graphically it is quite striking. In certain situations, Lackey throws a variation of his fastball and cut fastball that moves with the same velocity and horizontal movement as normal, but with more vertical break. It’s almost like having another pitch that Pitch F/X doesn’t understand. Take a look and remember he’s thrown fewer pitches overall in 2013, so the cluster stands out even more:

Lackey Velocity, V-Movement in 2011

Lackey Velocity, V-Movement in 2013

I’m not a leading expert on Pitch F/X or pitching in general, but this is the kind of thing that catches my attention. Lackey’s pitches don’t seem different overall, but there is a group of them that are acting differently. The increased downward break is likely to blame for more ground balls and I can certainly imagine it’s part of what’s driving the strikeouts via hitters swinging and missing on pitches they didn’t except to drop so much.

In analyzing this particular cluster of fastballs, the results were striking. Of 86 such pitches, 27 were called balls, 17 were called strikes, 19 were fouled off, 10 were swung at and missed, 3 were hit for singles, and 10 resulted in ground outs. When Lackey throws this pitch, the worst thing that happens is a single and even those are pretty rare. If we consider this pitch in context, during at bats in which he threw one of these pitches, he walked 14 hitters, struck out 28, induced 3 line outs, got 33 groundouts, and allowed just eight hits. All singles.

I haven’t watched many Lackey starts, so Red Sox fans might be able to speak more confidently on the subject, but it appears as if Lackey has turned himself into one of these special pitchers who can maintain high K%, low BB%, and a high GB%. We only have a couple of months of data, so this could still vanish from in front of our eyes.

My interest in Lackey, Porcello, and these pitchers at large comes from my belief in DIPS theory, but also a more general belief that limiting walks and extra base hits will help prevent runs and a pitcher can play a role in limiting extra base hits even if some of it is out of their control. If you’re inducing ground balls when you allow contact, you’re not going to get hurt nearly as often. Whether you like metrics like SIERA for this, or simply like to read FIP alongside GB%, it makes good sense.

John Lackey is becoming one of those guys. Along with Porcello (and Fister and Felix who have been hovering around these somewhat arbitrary cutoffs), he is headed for the club occupied only by Doc, Carpenter, and Hamels. I can’t tell you how often this happened prior to 2002, but the fact that only one of the eight recorded seasons is anything short of great makes me think this is worth tracking. The specific numbers aren’t hugely important, but they allowed me to discover the new and improved John Lackey.

He gets more strikeouts, allows fewer walks, and induces more ground balls. He’s had a bit of a rough stretch since his peak five years ago, but with this new approach, and occasionally different fastball, John Lackey is pitching himself back into the upper reaches of the American League.


Josh Willingham: Selective Hitter?

Josh Willingham hasn’t been very good this year. He’s on pace to put up his worst full-season WAR mark. I’m secretly glad about this because I’ve never really liked Josh Willingham as a player. (Well, I guess it isn’t a secret anymore.)

One of the reasons Willingham has been considered a good player is his selectivity at the plate. He’s certainly a patient hitter: this year, he’s swung at a lower percentage of pitches than any other qualified batter. But has he been selective?

One simple selectivity approximator is O-Swing%. The less pitches a hitter swings at outside the strike zone, the better he probably is at identifying where pitches will end up and which ones not to swing at. And sure enough, Willingham is third-best by this measure for 2013.

But O-Swing% isn’t the best way to measure selectivity. After all, an infinitely unselective batter could take every single pitch he saw and record a perfect 0.00000 O-Swing% — but a 0.00000 batting average as well. Last year, Carson Cistulli noticed this and constructed a leaderboard of hitters with the greatest discrepancies between their O-Swing and Z-Swing rates, in order to highlight batters who swing at lots of hittable pitches but lay off balls. And guess what? Josh Willingham proved to be baseball’s 8th-most selective hitter.

So there’s no doubt, then, that Josh Willingham is selective? Well, it depends how you define “selective”. First, we should notice that Willingham ranks in the bottom 20 of Z-Swing% this year — which means that he made it onto Cistulli’s leaderboard not because he swung at a lot of pitches in the zone, but just on the strength of his amazing ability to lay off pitches out of the strike zone. This is a useful skill — it leads to a high walk rate — but the low Z-Swing% is concerning.

There are two possibilities that I can make out: either Josh Willingham is only swinging at pitches he likes in the zone, but taking “bad” strikes, which would make him a true selective hitter; or he’s just indiscriminately taking too many pitches, kind of like that hypothetical 0.00000 O-Swing% guy.

Which is it?

Here are the pitches swung at by Josh Willingham in 2013, courtesy of Texas Leaguers:

Josh Willingham taken pitches, 2013

If we just look at pitches in the strike zone, it looks to me like he’s avoiding pitches down and in, as well as pitches down and away. So there’s a pattern, then. That’s a good sign.

Now let’s take a look at his career swing rates, this time via Baseball Prospectus:

Looks similar, right? So Willingham must know what he’s doing. Throughout his career, he’s made sure to lay off not just balls, but also pitches in the bottom-left and bottom-right parts of the strike zone. Those must be the kinds of pitches he’s bad at hitting.

Here’s his BABIP chart:

Well, that changes things, doesn’t it? He seems to be pretty good at hitting those down-and-in pitches he selects against. Willingham appears to have a good eye, but it doesn’t look like he’s choosing his pitches wisely.

But maybe BABIP isn’t the right thing to look at. After all, it leaves home runs and whiffs out of the equation. So here’s the same chart, but using TAv this time (TAv is basically Baseball Prospectus’s version of wOBA; wOBA is better, though):

This seems to justify him swinging at those high, inside pitches, but it still doesn’t explain him laying off pitches down and in, or swinging at pitches up and away.

So I think we can tentatively conclude that Josh Willingham isn’t as good at selecting pitches to swing at as one might think. This analysis is incomplete, of course, because there are a whole lot of factors — pitch type, count, base-out states, etc. — which I haven’t taken into consideration. I also haven’t looked at other hitters’ data — maybe Willingham is actually good at this compared to other major league hitters.

Why not take a look at another hitter? Say, Marco Scutaro. Here’s his Swing% chart:

And TAv:

I would say Scutaro’s selectivity is a little better. He’s good at hitting pitches inside and he knows it, so he mostly swings at pitches inside. Now, he’s inexplicably not very good at hitting pitches right down the middle, but Scutaro probably figures he should swing at those anyway because, well, they’re easy to hit, in theory.

Marco Scutaro is more selective than Josh Willingham. Intuitively, that seems right, as it would explain (to some degree) Scutaro’s league-best SwStr%.

Conclusion

I guess the moral of the story is don’t trust O-Swing% and Z-Swing% as selectivity indicators. And PITCHf/x data is fun to look at.


Jason Marquis, Expectations, and Reality

On the surface, Jason Marquis looks like he’s having a good season. He’s 9-4 with  a 3.77 ERA for the San Diego Padres and if you’re looking at how well his team performs collectively during his starts and how effective he has been at limiting runs, you might even say Jason Marquis is having one of the best seasons of his career. If you look more closely, however, he’s actually having one of the worst seasons in baseball history.

That’s a crazy juxtaposition. We’re used to evaluating players by advanced statistics like FIP, xFIP, WAR, and others, but it’s pretty rare that they tell us something totally different from the basic descriptive stats. Usually we look at a player’s FIP and think their ERA might be due for some regression. We don’t often look at a player’s FIP only to find that their ERA is propped up with toothpicks and Scotch tape.

Such is the case with Jason Marquis. His numbers this season are actually quite remarkable. He’s 48th among qualified starters in ERA, good for an ERA- of 104, which is just a bit below average. If you turn to FIP, he’s dead last at 5.70, good for a 156 FIP-. His xFIP is better, but it still remains fourth-worst in MLB at 4.77 to go along with an MLB-worst 125 xFIP-.

No qualifying starter’s ERA is outperforming their FIP as much as Marquis’ is this season. Jeff Locke and Jeremy Guthrie are in the conversation, but Marquis is decidedly ahead. Perhaps even more noteworthy is that Jason Marquis’ 156 FIP- is the second-worst number for a qualifying starter since 1901, and the record is within reach at 159.

Marquis is essentially having an all-time worst season in terms of strikeout rate, walk rate, and home-run rate when adjusting for park and league average. Yet he’s allowing a very average number of runs in a very respectable number of innings. Only two players in history have had their FIP- outperform their ERA- by more than Marquis’ difference of 52 and they both played before 1910.

I don’t mean to belabor Marquis’ 2013 season among the all-time clunkers in MLB history, but rather to simply set the stage for the remainder of this analysis. Marquis is doing a pretty decent job preventing runs, but is doing a terrible job at the aspects of preventing runs a pitcher can most control. What’s going on here?

First, let’s consider the Padres defense. By DRS, UZR, and UZR/150, the Padres rank between 15th and 21st in MLB this season. They aren’t a terrible defensive team, but this doesn’t appear to be a club that should systematically deflate their pitchers’ ERA. It’s possible that they are playing amazing behind Marquis and not for everyone else, but that seems unlikely. If you consider the Padres starters as a whole, their ERA is higher than their FIP and have individual starters on both sides of the divide. Additionally, it doesn’t appear as if any of this can be explained by the GB/FB ratio of each pitcher, which might have pointed to a particular aspect of the Padres defense.

Sometimes it’s just about the situation, but on the surface it doesn’t look like this is a good explanation either. Marquis allows a .318 wOBA with the bases empty to go with a .380 wOBA with men on and a .306 wOBA with men in scoring position. He’s more or less the same pitcher with men in scoring position as he is with no one on so pitching from the windup versus the stretch isn’t the answer. Let’s look at each base situation.

Split PA BA OBP SLG
— 294 0.225 0.320 0.395
1_ _ 78 0.422 0.500 0.656
_ 2 _ 32 0.269 0.406 0.385
_ _ 3 5 0.200 0.200 0.200
1 2 _ 39 0.188 0.316 0.344
1 _ 3 15 0.222 0.429 0.556
_ 2 3 10 0.000 0.500 0.000
123 18 0.143 0.222 0.214

Obviously, some of the samples are really small, but notice how much worse Marquis is when a runner is on first base, but not also on second base. Could this have something to do with holding the runner? A couple of possibilities spring to mind. One, Marquis is distracted by the baserunner. Two, having the first baseman holding the runner creates a hole where Marquis often allows hits. Three, the presence of the baserunner and location of the runner cause Marquis to pitch differently in order to avoid the hole on the right side, resulting in pitches that get smashed. I’m not sure if any or all of these are factors, but they are possible factors. If something like this is the case, it’s possible that Marquis isn’t actually as bad as his FIP tells us overall, but rather just really terrible in certain situations and reasonably average most of the time.

Some of this timing argument is dispelled if we consider that he’s actually allowing a higher percentage of his home runs with men on base (48%) than league average (40%) so his high walk rate and high home-run rate should be costing him dearly. But they are not. Marquis is pitching like he should allow close to 6 runs per 9 innings but he’s allowing fewer than 4.

His strikeout rate is 12th-worst in baseball at 14.7% and his walk rate is easily the worst at 13.2%. Only 1o pitchers have a higher HR/9. Yet he’s right around league average in ERA. Metrics like SIERA don’t rate him any better, as he comes in 2nd-worst at 5.11.

He shouldn’t be doing this well. He’s leaving runners on base like he’s Felix Hernandez, but walking guys like he’s Carlos Marmol, giving up home runs like Jose Valverde, and only striking guys out like he’s Bronson Arroyo. He’s getting a lot of ground balls, but he has a low BABIP against.

If you look at Lucas Harrell and Jason Marquis, most of the stat line is nearly identical.

Name IP K/9 BB/9 HR/9
Jason Marquis 112.1 5.77 5.21 1.44
Lucas Harrell 108.1 5.57 4.74 1.25


Name BABIP LOB% GB% HR/FB
Jason Marquis 0.256 79.70% 53.20% 19.60%
Lucas Harrell 0.304 70.40% 52.70% 16.00%


Name ERA FIP xFIP WAR
Jason Marquis 3.77 5.70 4.77 -1.4
Lucas Harrell 5.07 5.37 4.78 -0.3

If anything, based on K/9, BB/9, and HR/9, Harrell should be doing better. But somehow, Marquis is getting a much lower BABIP and a higher LOB% despite getting pretty much the same number of ground balls and having a worse HR/FB rate. They have essentially identical xFIP and Marquis has a worse FIP. The fact that Harrell has a 5.07 ERA and Marquis has a 3.77 ERA defies understanding (the story is the same with park-adjusted numbers).

This is likely just one of those small sample size mirage/miracles. Marquis has lost a tick on his fastball this year and his changeup is acting more like a splitter according to Pitch F/X, but nothing appears fundamentally different that would allow him to actually sustain this low BABIP (last year it was .311). Perhaps baseball fans who watch the Padres more regularly can offer some insight into what exactly is the driving force behind his low BABIP this season.

If you’re someone who likes to look at FIP, you’re looking at one of the worst seasons in baseball history. If you’re someone who cares more about overall run prevention, you’re looking at an average year. Granted, it’s not uncommon for a player to over or under perform their peripherals over 100 innings, but it is amazing how dramatically it is happening for Marquis.

It’s not unusual for BABIP to drive over- and under-performances by 20 or so points in on the ERA/FIP- scale, but what Marquis is doing is beyond the typical variation. For every qualifying season since 1901, the mean FIP-/ERA- differential is around 2.3 and the standard deviation is about 13.8. Marquis’ 2013 season is 3.6 standard deviations above the mean. (For just 2013 those numbers are a mean of 1.3, SD of 17.6, and Marquis is 2.8 SD above the mean)

The simple takeaway of this entire exercise is this. Jason Marquis is over-performing his peripherals this season and there isn’t a clear explanation for why this might be the case other than standard variation in BABIP. It’s a perfectly reasonably explanation. Marquis is getting some good fortune regarding where baseballs have been hit during key moments that have allowed his ERA to stay relatively low despite the fact that based on his other numbers it should be much higher. That happens. What is so amazing about this is the degree to which it is happening.

We’re all open to the idea that some players will over- and under-perform, but Marquis is over-performing at such a rare level. He’s in the top 0.25% of all over-performances when comparing ERA- and FIP-, which are statistics that control for league average and park effects. When you strip away the context, Jason Marquis’ 2013 season stands out as the third-biggest over-performance in the last 113 years, which includes more than 8,000 individual seasons.

Everything I know about baseball tells me Jason Marquis won’t maintain this ERA if he maintains these K, BB, and HR levels, but part of me is really hoping that he does. I like when things make sense and can be easily explained, but sometimes it’s a lot of fun to watch a player defy the odds for no other reason than that the Gods of probability have chosen that player to be the exception that proves the rule. Jason Marquis and Padres fans are  hoping he can keep it up. Anything can happen, but as we should note, it usually doesn’t.