Joe Blanton Defies the Odds
Let’s start with a picture. What it communicates won’t surprise you and it tells you essentially two things. First, over the last nine seasons, we’ve seen a modest decline in home runs. Second, that doesn’t apply to Joe Blanton.
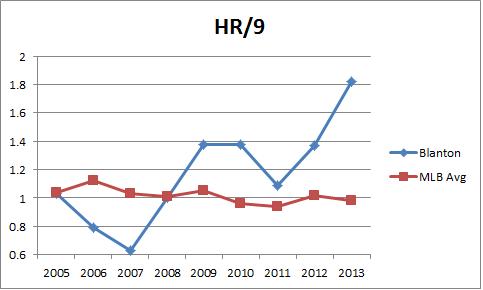
Now, Blanton has had a respectable career. He’s accumulated 19.3 WAR which is good for about 2 WAR per season and in all but one of his seasons, he has provided or is on pace for at least 175 IP. He has essentially been the definition of an innings-eater with a flash of greatness in 2007.
But over the last few seasons, Blanton has turned himself into one of the most homer-prone pitchers in baseball. Since the start of 2010, only three qualifying pitchers have allowed more HR/9 than Blanton’s 1.45 mark. It’s not terribly interesting that Blanton started giving up more home runs when he moved from Oakland to Philadelphia, but it is interesting that he’s giving up even more this season since moving to Angels Stadium.
In fact, Blanton’s 2013 mark is the 9th highest HR/9 total in the xFIP Era (2002-present). You’ll notice something interesting about the list of the qualifying pitchers who have given up the most home runs:
| Rank | Season | Name | IP | HR/9 | xFIP- |
| 1 | 2011 | Bronson Arroyo | 199 | 2.08 | 118 |
| 2 | 2012 | Ervin Santana | 178 | 1.97 | 108 |
| 3 | 2004 | Jamie Moyer | 202 | 1.96 | 109 |
| 4 | 2008 | Brandon Backe | 166.2 | 1.94 | 112 |
| 5 | 2004 | Eric Milton | 201 | 1.93 | 110 |
| 6 | 2005 | Eric Milton | 186.1 | 1.93 | 116 |
| 7 | 2006 | Carlos Silva | 180.1 | 1.90 | 107 |
| 8 | 2004 | Darrell May | 186 | 1.84 | 110 |
| 9 | 2013 | Joe Blanton | 119 | 1.82 | 95 |
| 10 | 2009 | Braden Looper | 194.2 | 1.80 | 113 |
| 11 | 2005 | Ramon Ortiz | 171.1 | 1.79 | 110 |
| 12 | 2004 | Brian Anderson | 166 | 1.79 | 119 |
| 13 | 2006 | Jeff Weaver | 172 | 1.78 | 105 |
| 14 | 2004 | Ismael Valdez | 170 | 1.75 | 123 |
| 15 | 2004 | Jose Lima | 170.1 | 1.74 | 97 |
Most of them aren’t great even if you factor out their fluky high HR/FB rate and home park, and Joe Blanton is the only pitcher in the top 14 on this list with an xFIP- below 100. He’s getting a decent number of ground balls (43.7%) and his K% (18.1%) and BB% (5.2%) are both pretty good. Usually guys who give up a ton of long balls are also doing a lot of other things poorly. Blanton doesn’t seem to be on the surface.
But with an ERA of 5.52, FIP of 4.82, and xFIP of 3.81 it makes you wonder exactly what’s going on. This is a pitcher who has a solid strikeout profile, good walk numbers, and a solid ground ball rate. Not only should that lead to pretty good run prevention, but it shouldn’t go hand in hand with a high HR/9.
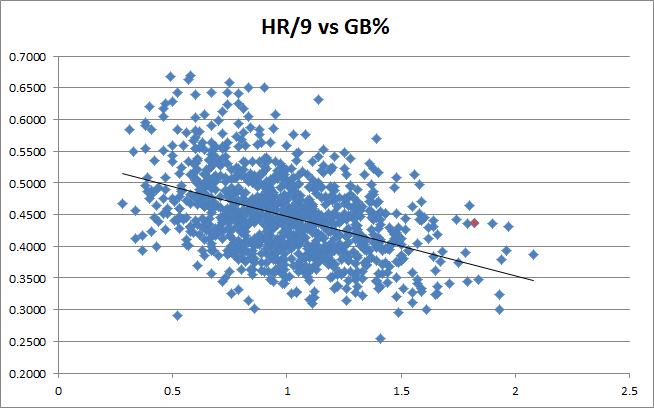
These are all the qualifying seasons since 2002, with Blanton labeled in red. Of pitchers in that cluster of HR/9 above 1.7, only Braden Looper in 2009 had a higher GB%. On average, pitchers who throw 43% ground balls allow around 1.00 HR/9. Everything about Blanton’s huge homer total screams that the HR/FB rate is unsustainable. It’s 17.3%. It will come down.
It’s the highest of his career, but he’s now calling Los Angeles home. He gave up more home runs when he moved from Oakland to Philly, but now he’s giving up more in his move from Philly to LA.

Look at that trend. It makes sense that it would go up between 2008 and 2009, but it went up every year he was in Philadelphia and is going up again now that he’s in a pitcher friendly park. Keith Law remarked recently that HR/FB and BABIP regression paradigms don’t apply to guys with stuff as poor as Blanton’s, and while I’m not sure I would go that far, this information has me wondering.
This doesn’t look like luck to me. You buy the first jump because of the ballpark and I know it’s only been 120 innings this season, but this is the 10th highest HR/FB% since 2002. And only one pitcher who has posted a higher HR/FB% had a GB% below 50%. In other words, the guys who have the really bad HR/FB% are usually guys who don’t allow many fly balls to begin with.
| Season | Name | Team | GB | HR/FB | xFIP- |
| 2003 | Odalis Perez | Dodgers | 53.00% | 19.70% | 79 |
| 2013 | Roberto Hernandez | Rays | 51.60% | 19.60% | 89 |
| 2012 | Ervin Santana | Angels | 43.20% | 18.90% | 108 |
| 2005 | Derek Lowe | Dodgers | 63.10% | 18.90% | 81 |
| 2005 | Brandon Webb | Diamondbacks | 65.00% | 18.80% | 70 |
| 2004 | Greg Maddux | Cubs | 50.90% | 18.20% | 79 |
| 2013 | Jason Marquis | Padres | 52.30% | 18.20% | 128 |
| 2012 | Henderson Alvarez | Blue Jays | 57.00% | 18.10% | 107 |
| 2007 | A.J. Burnett | Blue Jays | 54.80% | 17.70% | 79 |
| 2013 | Joe Blanton | Angels | 43.70% | 17.40% | 95 |
It’s reasonable to expect some regression because that’s always the reasonable thing to do, but Blanton’s HR/9 and HR/FB% have gone up since moving to a better park. It’s worth considering if there is something about Joe Blanton that’s causing this to happen because pretty much everything else he’s doing seems to be working. In fact, if you normalize his home run rate he’s actually above average even now that he’s back in the AL.
What stands out to me is what hitters are doing against his four-seam fastball according to Pitch F/X data. 12 of his 24 HR allowed have come on the fastball, and he’s allowed a .442 wOBA against that pitch, which is the pitch he throws most often in 2013. Against the fastball, he’s allowing a 27.3 HR/FB% and has allowed the ball to be hit in the air more often against it than any other pitch at 32.8%. Let’s take a look at the average movement on his four-seam fastball:

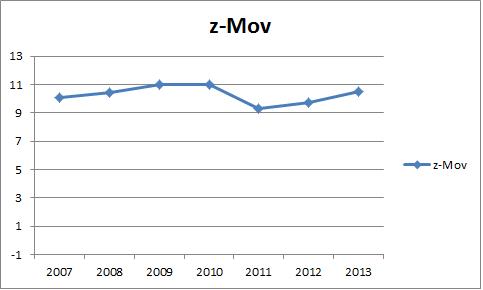
The vertical movement fluctuates some over time but it’s getting worse since 2011 and the horizontal movement is trending in a bad direction especially considering he’s throwing this pitch more often than anything else he’s got. Some of this could be classification issues, but the basic numbers say this is his main pitch and it’s not moving nearly enough. It was never a great pitch, but now it’s one of the straightest fastballs in the game and he’s getting crushed on it.
Of the 12 HRs he’s allowed on fastballs, the average velocity was 89 mph with less than three inches of horizontal break, and only one missed the strike zone. Those aren’t flukes, they are asking to be crushed. Here’s a look at his home runs allowed this year with Angel Stadium superimposed. He’s not giving up too many cheap ones considering the size of that stadium.

I’m not sure I have a perfectly clear conclusion to offer. If you only looked at Blanton’s 2013 stat line, you’d feel pretty confident that his HR/FB% would come down and he would pitch closer to his xFIP going forward given the decent strikeout, walk, and ground ball numbers he’s putting up. But if you look at his 2013 in the context of his other seasons and in the context of recent history you come to a different conclusion. If you’re looking with a wider lens, it seems as if Blanton isn’t going to rein in the home-run rate.
The trends don’t look good for Blanton who is allowing more home runs than ever before after moving to a bigger park thanks to a fastball that has less bite than at any time in his career. He’s throwing 89 mph heaters with little life down the middle and opposing hitters aren’t missing. This doesn’t seem like something that’s due for regression, it seems like it’s a function of the pitcher Blanton is right now.
I haven’t watched his starts closely, so perhaps an Angels fan can speak to this better, but I think I might bet against a whole lot of regression in this case. I think Law’s point my be valid, at least in this case. Blanton’s fastball might not be good enough for us to apply our standard beliefs. Blanton might be the exception that proves the rule.
Normally we expect a pitcher’s HR/FB% to come back to the pack, but only if that pitcher’s skills are close enough to average. Maybe that’s what we’re seeing with Joe Blanton in 2013. He’s routinely throwing a pitch that isn’t good enough to get hitters out and it’s costing him. It’s also possible that this is all a mirage and things will even out with more time.
I don’t have a perfect answer, but I think it’s worth raising the question and following Blanton’s season the rest of the way in order to find out.
Neil Weinberg is the Site Educator at FanGraphs and can be found writing enthusiastically about the Detroit Tigers at New English D. Follow and interact with him on Twitter @NeilWeinberg44.