Author Archive

The Art of Doubling to the Pitcher

Kendrys Morales and Gerardo Parra aren’t two players you tend to think about together. Parra is an elite defensive player with solid offensive skills and Morales is a slugging DH. Parra walks a little bit more and strikes out a little bit less, but Morales makes up for that differential by slugging about 80 points higher. Parra stands right around average at the plate in 2013 with a 99 wRC+ and Morales is above average at 138 wRC+. They’re both valuable in different ways, but they are also the only two players to date in 2013 to be credited with an extra-base hit to the pitcher.

Their batted ball profiles are quite different as Parra tends to put the ball on the ground and Morales makes his money in the air.

gbfb

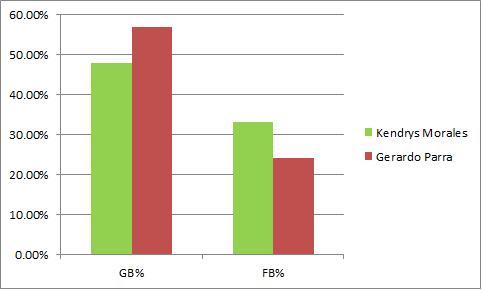
Parra swings more often and makes more contact along the way, but Morales seems to hit the ball with more force considering his higher home run total in a less hitter-friendly park. These are two players who aren’t all that similar but happen to be the only players to accomplish one of the stranger feats in baseball during the 2013 season.

Up front, it’s important to know this comes from Pitch F/X classifications, meaning that the play had to be scored a double, triple, or home run and it had to be fielded by the pitcher or hit into his zone. I don’t know exactly how the latter determination is made but I will assume that there aren’t massive mistakes in classification. I’ve watched Parra and Morales’ hits to confirm, but I obviously haven’t watched every double this season to make sure there aren’t any missing points.

What’s wonderful about these two extra base hits to the pitcher (both doubles) is that they match the respective players so perfectly.

May 5, 2013 – Mariners at Blue Jays

With Brandon Morrow on the mound Morales came to the plate in the Top of the 8th inning and worked a 1-1 count. Amazingly, before Morrow could throw his 3rd pitch of the at bat, a fan ran onto the field and stopped play. I have no idea if that was responsible for what happened next, but the coincidence is too hilarious not to mention.

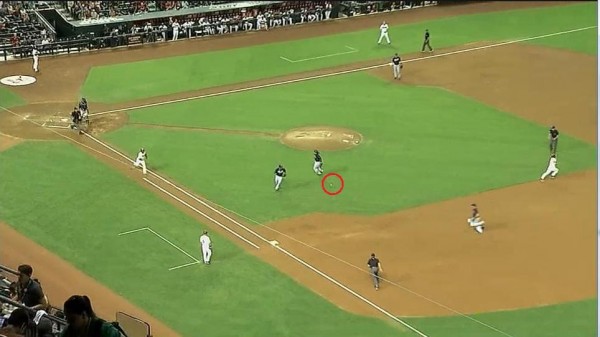
When play resumed Morrow came at Morales with an 85.7 MPH slider which the Mariners’ DH hit way up into air. With the roof open and sun beating down, the infielders converged toward the back of the pitcher’s mound to field the routine pop fly.

3

There are three professional athletes within 10 feet of where the baseball is going to land and they are all close enough to make the play quite easily. However, things take a comical/terrible turn depending on your personal feelings toward the Blue Jays.

4

As you can see, hopefully, Encarnacion called the ball vigorously and then fell over causing the third baseman to jump out of the way and lose sight of the ball, thus removing any hope of catching it himself. The baseball bounced about 10 feet into the air and Morales, who had been hustling, cruised into second base.

Morales hit his double to the pitcher in a very Morales fashion. He hit a fly ball and the defense didn’t catch it. The fan who ran on the field may have been in the minds of the players, but it’s more likely Encarnacion was trying so hard to fight the sun that he forgot about the hill located in the center of the diamond.

May 14, 2013 – Braves at Diamondbacks

In the Bottom of the 3rd, Cliff Pennington stood on first base and Julio Teheran climbed onto the mound. Parra dug in and took the first two pitches for balls, putting him into a nice hitter’s count. On the next pitch, Teheran delivered an 89.3 MPH fastball with some nice tailing action that Parra slapped to the right side.

2

You can see the baseball came right between the pitcher and first baseman as neither could make the play on the weakly hit bouncer. Generally this situation should result in a respectable infield single. After all, if I hadn’t prepared you, it would seem likely that the second baseman would pick up the ground ball and hold the runners at 1st and 2nd. You can see the third baseman is manning his position and just off the screen I assure you the shortstop is doing the same.

However, it didn’t exactly happen like this. Dan Uggla over-ran the ball, perhaps because he was expecting to run to the bag and couldn’t decide quickly enough to change course.

6

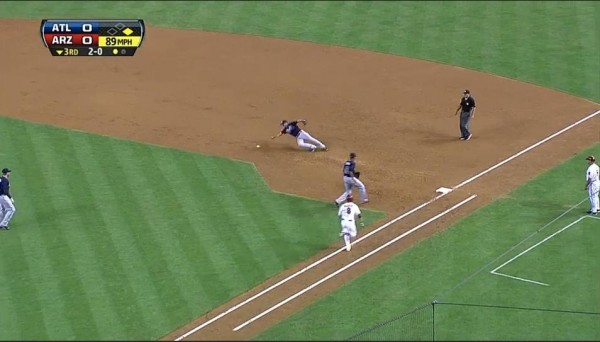
As a result, the pitcher had to back up the second baseman on a ground ball as Parra hustled into 2nd base.

1

This strikes me as a very Gerardo Parra type of hit. He put it on the ground and used his legs to turn it from an infield single into an infield double. It required a defensive mistake, but it was a defensive mistake that was, in part, forced by his ability.

Didi Gregorius singled in the next at bat to plate the Dbacks only two runs of the game, which also happened to be decisive in their win over the Braves. The final score was 2-0, so Pennington would have scored the winning run even if Uggla made the play on Parra, but it’s possible the defensive implosion took focus from Teheran or simply exhausted him given how far he had to run to make get the ball and resulted in poorer pitches

Nothing came of the Morales double as the Mariners didn’t score and went on to lose 10-2 despite that double coming as a result of much more egregious defensive play. Parra was going to have a single unless the Braves made an excellent play, but Morales shouldn’t have been on base at all. Apparently, the Baseball Gods agreed and didn’t punish Morrow as much as Teheran.

Baseball is often remarkable for the strange things you see. If you had to guess which two players doubled to the pitcher in 2013 you probably wouldn’t have picked Morales and you probably wouldn’t have expected that neither case involved someone failing to cover second base. This is one of those wonderfully weird moments in baseball that ties together to very different players with an odd set of circumstances.

Twice this season a player has doubled to the pitcher and both times that player did so in a way that was partly in line with their style of play, but both were very different. In one case the play was critical to the outcome and in one case it was meaningless.

Doubles to the pitcher are rare as a database search going back to 2008 reveals these as the only two. They happened nine days apart and are the only extra-base hits to the pitcher recorded by Pitch F/X in the last six seasons. Next time something like this happens, maybe the batter will try to stretch it into a triple in order to have an honor all his own.


Joe Blanton Defies the Odds

Let’s start with a picture. What it communicates won’t surprise you and it tells you essentially two things. First, over the last nine seasons, we’ve seen a modest decline in home runs. Second, that doesn’t apply to Joe Blanton.
HR9
Now, Blanton has had a respectable career. He’s accumulated 19.3 WAR which is good for about 2 WAR per season and in all but one of his seasons, he has provided or is on pace for at least 175 IP. He has essentially been the definition of an innings-eater with a flash of greatness in 2007.

But over the last few seasons, Blanton has turned himself into one of the most homer-prone pitchers in baseball. Since the start of 2010, only three qualifying pitchers have allowed more HR/9 than Blanton’s 1.45 mark. It’s not terribly interesting that Blanton started giving up more home runs when he moved from Oakland to Philadelphia, but it is interesting that he’s giving up even more this season since moving to Angels Stadium.

In fact, Blanton’s 2013 mark is the 9th highest HR/9 total in the xFIP Era (2002-present). You’ll notice something interesting about the list of the qualifying pitchers who have given up the most home runs:

Rank Season Name IP HR/9 xFIP-
1 2011 Bronson Arroyo 199 2.08 118
2 2012 Ervin Santana 178 1.97 108
3 2004 Jamie Moyer 202 1.96 109
4 2008 Brandon Backe 166.2 1.94 112
5 2004 Eric Milton 201 1.93 110
6 2005 Eric Milton 186.1 1.93 116
7 2006 Carlos Silva 180.1 1.90 107
8 2004 Darrell May 186 1.84 110
9 2013 Joe Blanton 119 1.82 95
10 2009 Braden Looper 194.2 1.80 113
11 2005 Ramon Ortiz 171.1 1.79 110
12 2004 Brian Anderson 166 1.79 119
13 2006 Jeff Weaver 172 1.78 105
14 2004 Ismael Valdez 170 1.75 123
15 2004 Jose Lima 170.1 1.74 97

Most of them aren’t great even if you factor out their fluky high HR/FB rate and home park, and Joe Blanton is the only pitcher in the top 14 on this list with an xFIP- below 100. He’s getting a decent number of ground balls (43.7%) and his K% (18.1%) and BB% (5.2%) are both pretty good. Usually guys who give up a ton of long balls are also doing a lot of other things poorly. Blanton doesn’t seem to be on the surface.

But with an ERA of 5.52, FIP of 4.82, and xFIP of 3.81 it makes you wonder exactly what’s going on. This is a pitcher who has a solid strikeout profile, good walk numbers, and a solid ground ball rate. Not only should that lead to pretty good run prevention, but it shouldn’t go hand in hand with a high HR/9.

gb

These are all the qualifying seasons since 2002, with Blanton labeled in red. Of pitchers in that cluster of HR/9 above 1.7, only Braden Looper in 2009 had a higher GB%. On average, pitchers who throw 43% ground balls allow around 1.00 HR/9. Everything about Blanton’s huge homer total screams that the HR/FB rate is unsustainable. It’s 17.3%. It will come down.

It’s the highest of his career, but he’s now calling Los Angeles home. He gave up more home runs when he moved from Oakland to Philly, but now he’s giving up more in his move from Philly to LA.
hrfb

Look at that trend. It makes sense that it would go up between 2008 and 2009, but it went up every year he was in Philadelphia and is going up again now that he’s in a pitcher friendly park. Keith Law remarked recently that HR/FB and BABIP regression paradigms don’t apply to guys with stuff as poor as Blanton’s, and while I’m not sure I would go that far, this information has me wondering.

This doesn’t look like luck to me. You buy the first jump because of the ballpark and I know it’s only been 120 innings this season, but this is the 10th highest HR/FB% since 2002. And only one pitcher who has posted a higher HR/FB% had a GB% below 50%. In other words, the guys who have the really bad HR/FB% are usually guys who don’t allow many fly balls to begin with.

Season Name Team GB HR/FB xFIP-
2003 Odalis Perez Dodgers 53.00% 19.70% 79
2013 Roberto Hernandez Rays 51.60% 19.60% 89
2012 Ervin Santana Angels 43.20% 18.90% 108
2005 Derek Lowe Dodgers 63.10% 18.90% 81
2005 Brandon Webb Diamondbacks 65.00% 18.80% 70
2004 Greg Maddux Cubs 50.90% 18.20% 79
2013 Jason Marquis Padres 52.30% 18.20% 128
2012 Henderson Alvarez Blue Jays 57.00% 18.10% 107
2007 A.J. Burnett Blue Jays 54.80% 17.70% 79
2013 Joe Blanton Angels 43.70% 17.40% 95

It’s reasonable to expect some regression because that’s always the reasonable thing to do, but Blanton’s HR/9 and HR/FB% have gone up since moving to a better park. It’s worth considering if there is something about Joe Blanton that’s causing this to happen because pretty much everything else he’s doing seems to be working. In fact, if you normalize his home run rate he’s actually above average even now that he’s back in the AL.

What stands out to me is what hitters are doing against his four-seam fastball according to Pitch F/X data. 12 of his 24 HR allowed have come on the fastball, and he’s allowed a .442 wOBA against that pitch, which is the pitch he throws most often in 2013. Against the fastball, he’s allowing a 27.3 HR/FB% and has allowed the ball to be hit in the air more often against it than any other pitch at 32.8%. Let’s take a look at the average movement on his four-seam fastball:
x
z

The vertical movement fluctuates some over time but it’s getting worse since 2011 and the horizontal movement is trending in a bad direction especially considering he’s throwing this pitch more often than anything else he’s got. Some of this could be classification issues, but the basic numbers say this is his main pitch and it’s not moving nearly enough. It was never a great pitch, but now it’s one of the straightest fastballs in the game and he’s getting crushed on it.

Of the 12 HRs he’s allowed on fastballs, the average velocity was 89 mph with less than three inches of horizontal break, and only one missed the strike zone. Those aren’t flukes, they are asking to be crushed. Here’s a look at his home runs allowed this year with Angel Stadium superimposed. He’s not giving up too many cheap ones considering the size of that stadium.
ang

I’m not sure I have a perfectly clear conclusion to offer. If you only looked at Blanton’s 2013 stat line, you’d feel pretty confident that his HR/FB% would come down and he would pitch closer to his xFIP going forward given the decent strikeout, walk, and ground ball numbers he’s putting up. But if you look at his 2013 in the context of his other seasons and in the context of recent history you come to a different conclusion. If you’re looking with a wider lens, it seems as if Blanton isn’t going to rein in the home-run rate.

The trends don’t look good for Blanton who is allowing more home runs than ever before after moving to a bigger park thanks to a fastball that has less bite than at any time in his career. He’s throwing 89 mph heaters with little life down the middle and opposing hitters aren’t missing. This doesn’t seem like something that’s due for regression, it seems like it’s a function of the pitcher Blanton is right now.

I haven’t watched his starts closely, so perhaps an Angels fan can speak to this better, but I think I might bet against a whole lot of regression in this case. I think Law’s point my be valid, at least in this case. Blanton’s fastball might not be good enough for us to apply our standard beliefs. Blanton might be the exception that proves the rule.

Normally we expect a pitcher’s HR/FB% to come back to the pack, but only if that pitcher’s skills are close enough to average. Maybe that’s what we’re seeing with Joe Blanton in 2013. He’s routinely throwing a pitch that isn’t good enough to get hitters out and it’s costing him. It’s also possible that this is all a mirage and things will even out with more time.

I don’t have a perfect answer, but I think it’s worth raising the question and following Blanton’s season the rest of the way in order to find out.


Getting Ahead with Wainwright and Moore

If I were to argue that Adam Wainwright and Matt Moore were having similar seasons, you’d probably question my analytical skills. They have similar win totals and are both major-league starting pitchers on good teams, but you generally wouldn’t consider them to have a lot else in common when thinking about them in the context of their contemporaries. Heck, they don’t even throw with the same arm! I’m not going to argue that they’re having similar seasons, but there is one thing they are doing at a surprisingly similar rate. Allow me to explain.

Let’s start by talking about how they are different. Wainwright goes much deeper into games, walks way fewer batters, gets a lot more ground balls, and limits runs a better rate. FIP and xFIP like him a lot better, no doubt because he doesn’t issue free passes. Moore strikes out more batters, but other than that he doesn’t measure up to what Wainwright brings. Wainwright is right in the thick of the NL Cy Young race, Moore is just having a solid season.

Name GS IP K/9 BB/9 HR/9 BABIP LOB% GB% HR/FB ERA FIP xFIP WAR
Adam Wainwright 21 154.2 7.97 0.99 0.35 0.308 76.30% 49.10% 5.30% 2.44 2.20 2.72 4.9
Matt Moore 20 116.1 8.66 4.33 0.62 0.252 77.00% 39.00% 6.20% 3.17 3.56 4.22 1.9

The comparison comes as a byproduct of some aimless leaderboard scanning and a stray thought. I started wondering about the correlation between Zone% and BB%, much in a similar way to how Jeff Sullivan considered the connection between Contact% and K% earlier this year. My study led me to the production of this graph, with BIS data through July 24:

Zone

Generally, a higher Zone% correlates with a lower BB%. The slope coefficient is -0.33 and is statistically significant, but the Adjusted R squared is only .2116. Pitchers who pound the zone usually walk fewer batters than pitchers who don’t, but there is a lot of unexplained variation. Matt Moore and Adam Wainwright carry quite a bit of the blame for that as they have nearly identical Zone% and extremely different BB%. In fact, Wainwright is 1st in BB% and Moore is 87th among qualified starters.

Wainwright has a K/BB ratio above 8. Moore’s is 2. Wainwright and Moore both strike out between 22 and 24% of the batters they face, but Wainwright walks less than 3% and Moore walks more than 11%.

Amazingly, Wainwright and Moore throw 44.5% and 44.2% of their pitches in the zone, respectively, despite what their walk rates seems to be telling you.

If you give them both 100 pitches and 25 batters, they’ll both average 55-56 strikes but Wainwright will walk fewer than 1 and Moore will walk close to 3. That’s impressive. No other two starters in baseball this year have such similar Zone% and such different walk rates. (Ubaldo is the data point above Moore, but he is a full percent behind Wainwright in Zone%)

Name O-Swing% F-Strike%
Adam Wainwright 38.40% 65.70%
Matt Moore 28.50% 51.90%

Well that’s something. Wainwright and Moore throw the same number of pitches in and out of the zone, but Wainwright gets batters to chase when he leaves the zone much more often and starts at bats with strikes much more often as well. It’s pretty interesting that two pitchers can throw the ball in the zone with the same frequency and get such dramatically different results.

You can see that despite hitting the zone with similar frequencies, Wainwright hits the zone early to set up chases later on in the at bat. Here are their zone plots on first pitches.

Wainwright
Wainwright

Moore
Moore
Wainwright and Moore are a great example of how averages can sometimes be deceiving. Despite throwing the same percentage of pitches in and out of the zone, they are throwing them in and out of the zone at much different times. Wainwright pounds the zone early and gets hitters to chase late. Moore misses more consistently.

Think of it this way. When Wainwright throws a pitch out of the zone, he’s doing it when he’s ahead in the count so hitters are forced to chase and get themselves out. Moore leaves the zone with less purpose and more because he doesn’t have great control. It balances out to the same percentage, but the effects are much different. You can see it in BB%, you can see it in ERA, and you can see it in FIP and other advanced stats.

Matt Moore is still a very promising young pitcher and is still quite valuable in his current form. Nothing about this is meant to degrade Moore, but rather to highlight some extreme variation and consider how important it is to get ahead of hitters. By the third and fourth pitches in at bats, Wainwright has hitters chasing and Moore has hitters taking.

Getting ahead early with a first-pitch strike is really important as it is much more predictive of BB% than Zone%. The slope coefficient is nearly identical to Zone%, but the Adjusted R Squared comes in at .4020.

FStrike

Finding the zone is important, but as Wainwright and Moore demonstrate, finding the zone early is more important. Matt Moore has tremendous stuff, but if he hopes to get results to match Wainwright, he’s going to have to command it more effectively, even if he is hitting the zone with the same frequency.

Moore doesn’t really profile as a Wainwright kind of pitcher, but Wainwright’s own impressive drop in BB% rate can be instructive for pitchers looking to improve. Wainwright is throwing pitches in the zone less frequently as he’s aged, but is adding to his first-pitch strikes. I’ll let the data speak for itself. Adam Wainwright is fantastic.

ZF

BB


The New John Lackey

Earlier this season, while writing a piece on Rick Porcello’s breakout, I noticed he was mixing a certain combination of skills that seemed both interesting and valuable. He was striking out more than 7 hitter per 9, walking fewer than 2, and also inducing a ground ball rate above 50%. The story with Porcello was the increase in strikeouts, but it also put him in some excellent company. Going back to 2002 (when GB% becomes available) the list of qualifying pitchers to meet those criteria is short and impressive. Roy Halladay (4), Chris Carpenter (3), and Cole Hamels (1). Porcello is doing it this year and so is John Lackey. And Lackey’s story might be the most interesting.

(Note: K% and BB% tell a similar story, the cut-offs are just harder to express and are not the real focus of the article.)

Porcello’s key was an improved changeup and new curveball that induced more strikeouts, but Lackey has actually improved his numbers in all three categories pretty dramatically. Even if we accept that Lackey’s 2011 numbers were depressed due to the coming injury, if you take his career numbers and place them next to his 2013 season, the change is quite interesting.

Season IP K/9 BB/9 HR/9 BABIP GB% HR/FB ERA FIP xFIP WAR
2002-2012 1876 7.03 2.73 0.91 0.309 43.20% 9.10% 4.10 3.91 4.08 34.7
2013 106 8.44 1.94 1.18 0.290 50.80% 14.70% 2.95 3.64 3.18 2.1

At 32, Lackey is getting better. Certainly he had some excellent seasons from 2005-2007 when he exceeded 5.0 WAR for three straight years, but this performance is quite something. He’s getting more strikeouts than in all but one year of his career and he’s posting the best walk rate and highest ground ball rate in his career by substantial margins. The results are better if you look at ERA, FIP, and xFIP as he’s never had a lower ERA or xFIP and only bested this year’s FIP during that run from 2005-2007.

Lackey is having a career renaissance. But the interesting thing on the surface is that Lackey’s velocity isn’t much different and his pitch selection isn’t either. He’s got the same repertoire and it seems to be of the same quality. But looks can be deceiving.

A word is needed up front regarding pitch classification. Pitch F/X seems to think he’s throwing a different mix of pitches, but it’s actually just classifying them differently. You can see in the two charts below, from 2011 and 2013, that the velocity and horizontal movements are quite similar, but the pitches are being called something different.

Lackey Velocity, H-Movement in 2011

Lackey Velocity, H-Movement in 2013

His velocity isn’t much different from his rough 2011 campaign and the location of the pitches aren’t terribly different either. He’s routinely working low and away to both RHH and LHH this year just like he did in 2011.

This doesn’t seem to be about stuff or location, and this isn’t an increase in performance driven by BABIP because the indicators I’m looking at are entirely within the pitcher’s control This is an analysis about an increase in strikeouts, a decrease in walks, and an improvement in GB%. Lackey is getting better results because he’s doing well in those categories. Yet he’s not throwing harder and he’s not throwing much differently than he did in one of his worst years.

Well, not so fast. There is one key difference that I’ve been able to find and I think it can explain why Lackey is doing so much better. Let me start by pointing out some even more interesting tidbits. First, Lackey is throwing fewer pitches in the zone overall while inducing much less contract overall with virtually the same swing percentage as in 2011. His first-pitch strikes are up but are not much different than his career norms. Lackey is getting more swings and misses, which could point to the strikeout increase. But Lackey is also hitting the zone less often, which means a good portion of the walk decline is coming from batters swinging at pitches outside the zone. That all makes sense to some degree.

Lackey is getting more swings and misses via pitches out of the zone, so his strikeouts are up and his walks are down. But the increase in GB% is the aspect about which I was most curious and it fits in with what I believe is cause the strikeout and walk transformation.

Lackey isn’t throwing harder, the ball isn’t moving more horizontally, and the general location of his pitches haven’t changed. What has changed is the vertical movement on a subset of his pitches. It’s hard to notice when you’re looking at season averages, but graphically it is quite striking. In certain situations, Lackey throws a variation of his fastball and cut fastball that moves with the same velocity and horizontal movement as normal, but with more vertical break. It’s almost like having another pitch that Pitch F/X doesn’t understand. Take a look and remember he’s thrown fewer pitches overall in 2013, so the cluster stands out even more:

Lackey Velocity, V-Movement in 2011

Lackey Velocity, V-Movement in 2013

I’m not a leading expert on Pitch F/X or pitching in general, but this is the kind of thing that catches my attention. Lackey’s pitches don’t seem different overall, but there is a group of them that are acting differently. The increased downward break is likely to blame for more ground balls and I can certainly imagine it’s part of what’s driving the strikeouts via hitters swinging and missing on pitches they didn’t except to drop so much.

In analyzing this particular cluster of fastballs, the results were striking. Of 86 such pitches, 27 were called balls, 17 were called strikes, 19 were fouled off, 10 were swung at and missed, 3 were hit for singles, and 10 resulted in ground outs. When Lackey throws this pitch, the worst thing that happens is a single and even those are pretty rare. If we consider this pitch in context, during at bats in which he threw one of these pitches, he walked 14 hitters, struck out 28, induced 3 line outs, got 33 groundouts, and allowed just eight hits. All singles.

I haven’t watched many Lackey starts, so Red Sox fans might be able to speak more confidently on the subject, but it appears as if Lackey has turned himself into one of these special pitchers who can maintain high K%, low BB%, and a high GB%. We only have a couple of months of data, so this could still vanish from in front of our eyes.

My interest in Lackey, Porcello, and these pitchers at large comes from my belief in DIPS theory, but also a more general belief that limiting walks and extra base hits will help prevent runs and a pitcher can play a role in limiting extra base hits even if some of it is out of their control. If you’re inducing ground balls when you allow contact, you’re not going to get hurt nearly as often. Whether you like metrics like SIERA for this, or simply like to read FIP alongside GB%, it makes good sense.

John Lackey is becoming one of those guys. Along with Porcello (and Fister and Felix who have been hovering around these somewhat arbitrary cutoffs), he is headed for the club occupied only by Doc, Carpenter, and Hamels. I can’t tell you how often this happened prior to 2002, but the fact that only one of the eight recorded seasons is anything short of great makes me think this is worth tracking. The specific numbers aren’t hugely important, but they allowed me to discover the new and improved John Lackey.

He gets more strikeouts, allows fewer walks, and induces more ground balls. He’s had a bit of a rough stretch since his peak five years ago, but with this new approach, and occasionally different fastball, John Lackey is pitching himself back into the upper reaches of the American League.


Jason Marquis, Expectations, and Reality

On the surface, Jason Marquis looks like he’s having a good season. He’s 9-4 with  a 3.77 ERA for the San Diego Padres and if you’re looking at how well his team performs collectively during his starts and how effective he has been at limiting runs, you might even say Jason Marquis is having one of the best seasons of his career. If you look more closely, however, he’s actually having one of the worst seasons in baseball history.

That’s a crazy juxtaposition. We’re used to evaluating players by advanced statistics like FIP, xFIP, WAR, and others, but it’s pretty rare that they tell us something totally different from the basic descriptive stats. Usually we look at a player’s FIP and think their ERA might be due for some regression. We don’t often look at a player’s FIP only to find that their ERA is propped up with toothpicks and Scotch tape.

Such is the case with Jason Marquis. His numbers this season are actually quite remarkable. He’s 48th among qualified starters in ERA, good for an ERA- of 104, which is just a bit below average. If you turn to FIP, he’s dead last at 5.70, good for a 156 FIP-. His xFIP is better, but it still remains fourth-worst in MLB at 4.77 to go along with an MLB-worst 125 xFIP-.

No qualifying starter’s ERA is outperforming their FIP as much as Marquis’ is this season. Jeff Locke and Jeremy Guthrie are in the conversation, but Marquis is decidedly ahead. Perhaps even more noteworthy is that Jason Marquis’ 156 FIP- is the second-worst number for a qualifying starter since 1901, and the record is within reach at 159.

Marquis is essentially having an all-time worst season in terms of strikeout rate, walk rate, and home-run rate when adjusting for park and league average. Yet he’s allowing a very average number of runs in a very respectable number of innings. Only two players in history have had their FIP- outperform their ERA- by more than Marquis’ difference of 52 and they both played before 1910.

I don’t mean to belabor Marquis’ 2013 season among the all-time clunkers in MLB history, but rather to simply set the stage for the remainder of this analysis. Marquis is doing a pretty decent job preventing runs, but is doing a terrible job at the aspects of preventing runs a pitcher can most control. What’s going on here?

First, let’s consider the Padres defense. By DRS, UZR, and UZR/150, the Padres rank between 15th and 21st in MLB this season. They aren’t a terrible defensive team, but this doesn’t appear to be a club that should systematically deflate their pitchers’ ERA. It’s possible that they are playing amazing behind Marquis and not for everyone else, but that seems unlikely. If you consider the Padres starters as a whole, their ERA is higher than their FIP and have individual starters on both sides of the divide. Additionally, it doesn’t appear as if any of this can be explained by the GB/FB ratio of each pitcher, which might have pointed to a particular aspect of the Padres defense.

Sometimes it’s just about the situation, but on the surface it doesn’t look like this is a good explanation either. Marquis allows a .318 wOBA with the bases empty to go with a .380 wOBA with men on and a .306 wOBA with men in scoring position. He’s more or less the same pitcher with men in scoring position as he is with no one on so pitching from the windup versus the stretch isn’t the answer. Let’s look at each base situation.

Split PA BA OBP SLG
294 0.225 0.320 0.395
1_ _ 78 0.422 0.500 0.656
_ 2 _ 32 0.269 0.406 0.385
_ _ 3 5 0.200 0.200 0.200
1 2 _ 39 0.188 0.316 0.344
1 _ 3 15 0.222 0.429 0.556
_ 2 3 10 0.000 0.500 0.000
123 18 0.143 0.222 0.214

Obviously, some of the samples are really small, but notice how much worse Marquis is when a runner is on first base, but not also on second base. Could this have something to do with holding the runner? A couple of possibilities spring to mind. One, Marquis is distracted by the baserunner. Two, having the first baseman holding the runner creates a hole where Marquis often allows hits. Three, the presence of the baserunner and location of the runner cause Marquis to pitch differently in order to avoid the hole on the right side, resulting in pitches that get smashed. I’m not sure if any or all of these are factors, but they are possible factors. If something like this is the case, it’s possible that Marquis isn’t actually as bad as his FIP tells us overall, but rather just really terrible in certain situations and reasonably average most of the time.

Some of this timing argument is dispelled if we consider that he’s actually allowing a higher percentage of his home runs with men on base (48%) than league average (40%) so his high walk rate and high home-run rate should be costing him dearly. But they are not. Marquis is pitching like he should allow close to 6 runs per 9 innings but he’s allowing fewer than 4.

His strikeout rate is 12th-worst in baseball at 14.7% and his walk rate is easily the worst at 13.2%. Only 1o pitchers have a higher HR/9. Yet he’s right around league average in ERA. Metrics like SIERA don’t rate him any better, as he comes in 2nd-worst at 5.11.

He shouldn’t be doing this well. He’s leaving runners on base like he’s Felix Hernandez, but walking guys like he’s Carlos Marmol, giving up home runs like Jose Valverde, and only striking guys out like he’s Bronson Arroyo. He’s getting a lot of ground balls, but he has a low BABIP against.

If you look at Lucas Harrell and Jason Marquis, most of the stat line is nearly identical.

Name IP K/9 BB/9 HR/9
Jason Marquis 112.1 5.77 5.21 1.44
Lucas Harrell 108.1 5.57 4.74 1.25


Name BABIP LOB% GB% HR/FB
Jason Marquis 0.256 79.70% 53.20% 19.60%
Lucas Harrell 0.304 70.40% 52.70% 16.00%


Name ERA FIP xFIP WAR
Jason Marquis 3.77 5.70 4.77 -1.4
Lucas Harrell 5.07 5.37 4.78 -0.3

If anything, based on K/9, BB/9, and HR/9, Harrell should be doing better. But somehow, Marquis is getting a much lower BABIP and a higher LOB% despite getting pretty much the same number of ground balls and having a worse HR/FB rate. They have essentially identical xFIP and Marquis has a worse FIP. The fact that Harrell has a 5.07 ERA and Marquis has a 3.77 ERA defies understanding (the story is the same with park-adjusted numbers).

This is likely just one of those small sample size mirage/miracles. Marquis has lost a tick on his fastball this year and his changeup is acting more like a splitter according to Pitch F/X, but nothing appears fundamentally different that would allow him to actually sustain this low BABIP (last year it was .311). Perhaps baseball fans who watch the Padres more regularly can offer some insight into what exactly is the driving force behind his low BABIP this season.

If you’re someone who likes to look at FIP, you’re looking at one of the worst seasons in baseball history. If you’re someone who cares more about overall run prevention, you’re looking at an average year. Granted, it’s not uncommon for a player to over or under perform their peripherals over 100 innings, but it is amazing how dramatically it is happening for Marquis.

It’s not unusual for BABIP to drive over- and under-performances by 20 or so points in on the ERA/FIP- scale, but what Marquis is doing is beyond the typical variation. For every qualifying season since 1901, the mean FIP-/ERA- differential is around 2.3 and the standard deviation is about 13.8. Marquis’ 2013 season is 3.6 standard deviations above the mean. (For just 2013 those numbers are a mean of 1.3, SD of 17.6, and Marquis is 2.8 SD above the mean)

The simple takeaway of this entire exercise is this. Jason Marquis is over-performing his peripherals this season and there isn’t a clear explanation for why this might be the case other than standard variation in BABIP. It’s a perfectly reasonably explanation. Marquis is getting some good fortune regarding where baseballs have been hit during key moments that have allowed his ERA to stay relatively low despite the fact that based on his other numbers it should be much higher. That happens. What is so amazing about this is the degree to which it is happening.

We’re all open to the idea that some players will over- and under-perform, but Marquis is over-performing at such a rare level. He’s in the top 0.25% of all over-performances when comparing ERA- and FIP-, which are statistics that control for league average and park effects. When you strip away the context, Jason Marquis’ 2013 season stands out as the third-biggest over-performance in the last 113 years, which includes more than 8,000 individual seasons.

Everything I know about baseball tells me Jason Marquis won’t maintain this ERA if he maintains these K, BB, and HR levels, but part of me is really hoping that he does. I like when things make sense and can be easily explained, but sometimes it’s a lot of fun to watch a player defy the odds for no other reason than that the Gods of probability have chosen that player to be the exception that proves the rule. Jason Marquis and Padres fans are  hoping he can keep it up. Anything can happen, but as we should note, it usually doesn’t.


Craig Biggio: Double Play Escape Artist

Craig Biggio came about 7% of the vote shy of spending late July of this year in Cooperstown giving a tearful speech about his playing career, but it’s likely he’ll get a chance to make that speech sometime in the next couple of years. Biggio was a very good major-league player over 20 seasons and ranks 83rd all time in WAR. He has 3,000 hits, which is generally a gold standard among voters, and ranks higher than a number of other current Hall of Famers in WAR such as Tony Gwynn and Roberto Alomar.

Certainly, some of Biggio’s value is based on longevity and the second half of his career was not nearly as productive as the first. Even if Biggio doesn’t make the Hall of Fame by your own personal standards, he’s likely to get in and is at least worthy of a conversation on the subject.

I’ve always been fond of players who play multiple positions like Ben Zobrist (who does it while being an excellent hitter) or Don Kelly (who does it while being something around replacement level). It’s a type of player I enjoy watching, and Biggio’s 428 games at catcher, 366 games in the outfield, and 1989 games at second base put him in that category. As I often do with players who peak my interest, I spent time exploring his career statistics and one particular season stands out as his best, but it also stands out for another reason entirely: Biggio grounded into exactly zero double plays that season.

The year was 1997 and Biggio’s Astros were heading toward an 84-78 record, a Central division title, and a brief appearance in the postseason before being swept at the hands of the Braves. Over the course of the campaign that would end with Biggio finishing fourth in the NL MVP race, he lead MLB with 9.3 WAR narrowly topping players named Griffey, Walker, Piazza, and Bonds. Biggio accumulated those wins with an extremely balanced attack.

In 744 PA, he hit .309/.415/.501 for a .401 wOBA and 148 wRC+. His Total Zone was 19 and his baserunning runs above average came in a 5.2. He stole 47 bases, hit 22 HR, scored 146 runs, and was hit by 34 pitches. Pretty much everything he did that season was his career best or very close to it. It was easily the best season he ever had and one of the most valuable seasons in recent memory, coming in 36th in WAR since 1961.

Biggio’s 1997 season is remarkable because it’s the biggest feather in the cap of a very good player and one of the more balanced and interesting stat lines you’ll see, but it’s also remarkable because Biggio did it without grounding into a single double play.

Baseball-Reference appears to have complete data on the matter going back to 1939 and since then only seven qualifying hitters have gone an entire season without grounding into a double play. This list itself is truly amazing.

Pete Reiser, 1942 (4.4 WAR)

Dick McAuliffe, 1968 (5.2 WAR)

Rob Deer, 1990 (1.2 WAR)

Ray Lankford, 1994 (2.4 WAR)

Otis Nixon, 1994 (0.3 WAR)

Rickey Henderson, 1994 (2.8 WAR)

Craig Biggio, 1997 (9.3 WAR)

First of all, you’ll notice that three of the seven seasons on this list came in 1994 when the season was cut short due to a strike, so while these seasons count they should be taken with a grain of salt because the guys on this list played 85-105 games each instead of 162. Aside from those three, this has only been done four times in major league history and one of the times was by Rob Deer. You can’t make that up.

Reiser and McAuliffe had very good seasons during the years they didn’t ground into any double plays, but they didn’t have the kind of year Biggio did. McAuliffe was four wins behind the leader in 1968 and Reiser was seven wins behind Ted Williams in 1942. Biggio accomplished this feat, which is exceedingly rare, while being one of the league’s very best players. From 1939-2012 there have been 8,636 qualifying seasons and just seven instances of a player avoiding a double play all season long.

Only .08% of all major league seasons have ended with a player not grounding into a double play. Three of them happened in the same strike-shortened season. One during a below-average season from Rob Deer. Two came during very good seasons more than 40 years ago. One came during Biggio’s amazing 1997 campaign in which he did just about everything you could ask a baseball player to do.

In 1997, Biggio came to the plate in 78 situations in which grounding into a double play was possible. In those situations he hit an impressive .403/.487/.677. Of the 40 times he didn’t get a hit, walk, or get hit by a pitch, he hit 13 ground balls. Two of those ground balls turned into errors and he got down the line fast enough the other 11 times to prevent the defense from converting the second out.  It is worth noting, however, that Biggio did line into a double play once during the season, but that hardly seems fair given that it isn’t considered a GIDP and is more the fault of the baserunner than the batter. Additionally, he was the strikeout half of one strike-em-out-throw-em out double play in 1997, so he wasn’t completely without his faults.

Craig Biggio is a likely Hall of Fame player with 3,000 hits who had one of the most impressively balanced seasons in recent memory in 1997. If I were the one responsible for writing the text on his Cooperstown plaque, I would be sure to find room for the phrase, “One of seven players in MLB history to go an entire season without grounding into a double play” because I’m not sure he’s ever done anything on a baseball field more noteworthy than that.