Archive for Player Analysis

The Cardinals Should Send the Angels A Very Large Check

Baseball’s compensation system ensures that teams have a long time before they need to pay their superstars in market value. The whole structure is broken, and I’m not just talking about “the Kris Bryant problem,” when a player’s debut is deliberately delayed in order for the team to gain an extra year of control. The issues go way beyond that.

This isn’t an article presenting a solution for this issue per se, mainly due to the fact that any restructuring requires flexibility and willingness to sacrifice some current profits for the long-term welfare of the game in what ultimately is a dispute about money. This change will come if and when it does primarily due to leverage that one side has over the other.

I want to talk about Albert Pujols specifically, the future first-ballot Hall of Famer who was recently released by the Los Angeles Angels. Looking back at his career, a glorious one at that, the difference between what he earned and produced with the Cardinals and with the Angels is quite staggering.

Instead of focusing on the negative and all that went wrong during his time in California, let’s look at it from a different perspective: how everything ultimately evened out for this all-time legend. Read the rest of this entry »


Clayton Kershaw Is Breaking Barriers in Breaking Ball Usage

Knuckleballer R.A. Dickey set record marks for a starting pitcher in the 21st century in terms of breaking ball percentage, usually hovering around 50%. The most prominent other examples are:

Which Starters Have Thrown the Most Breaking Stuff?
Pitcher Season Breaking% xERA
Patrick Corbin 2018 50.3 3.39
Jon Gray 2018 48.7 4.03
Madison Bumgarner 2015 48.7 2.92

But Clayton Kershaw could do something unprecedented this season. It may still be early, this goes beyond simply what happened during this first few weeks of baseball.

It’s well-documented that the future Hall of Famer doesn’t have the same zip on that fastball that he used to, which was most concerning during the 2019 season where the heater topped out at 90.3 mph. Giving up a lead to the Nats in Game 5 on back-to-back homers before being knocked out of the NLDS might have been the catalyst for a change in approach during the following offseason, but that’s just pure speculation on my part.

Kershaw went to Driveline, and through a meticulous study of his mechanics was able to make some minor adjustments and give himself a bit of velocity back. For a pitcher into his thirties, that’s especially huge.

One could look to that moment and mark it as a turning point, but to discuss Kershaw’s pitch selection, we must recognize that since the development of his slider way back when in a bullpen section in Wrigley Field (and even more so since his first Cy Young campaign in 2011), the left-hander has been steadily increasing the slider’s usage to the same rate he was decreasing the fastball selection. Just take a look at the graphic.

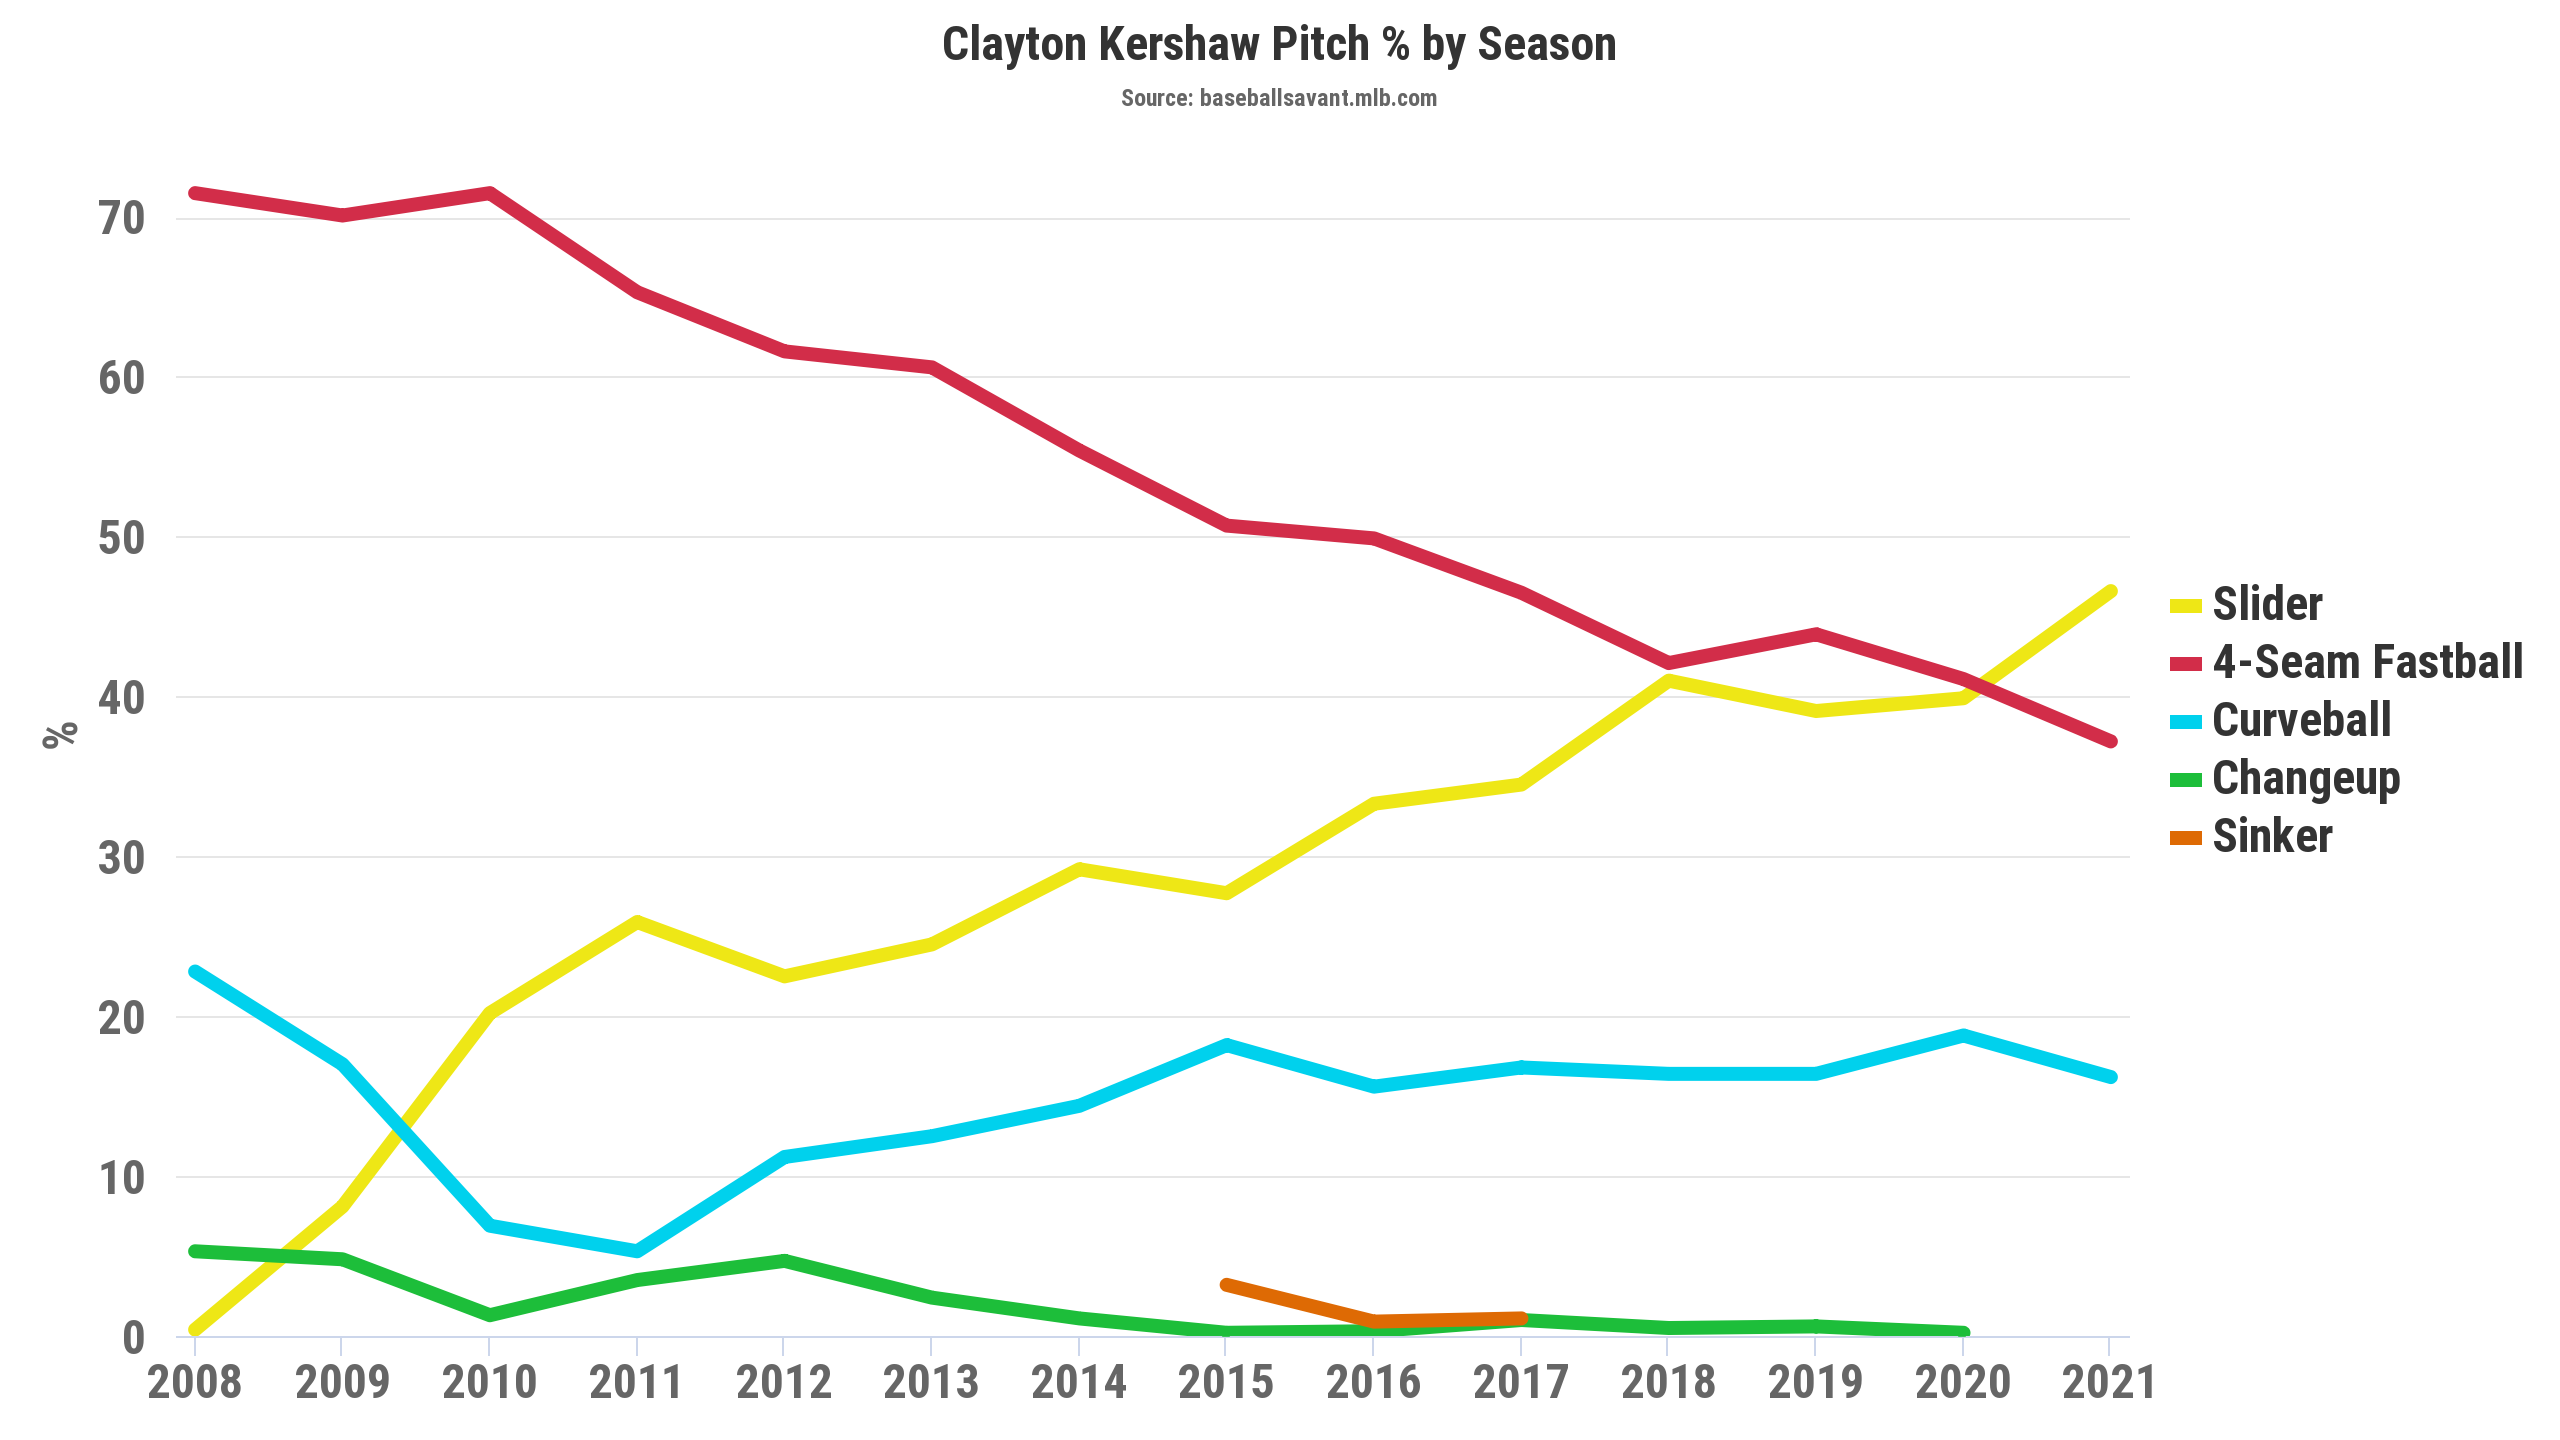
We are four starts into Kershaw’s 2021 season, and so far he’s maintained a steady pace towards the first season of a breaking ball rate of 60% or above.

The bulk of this change comes from Kershaw’s significant increase of sliders, specifically against right-handed hitters.

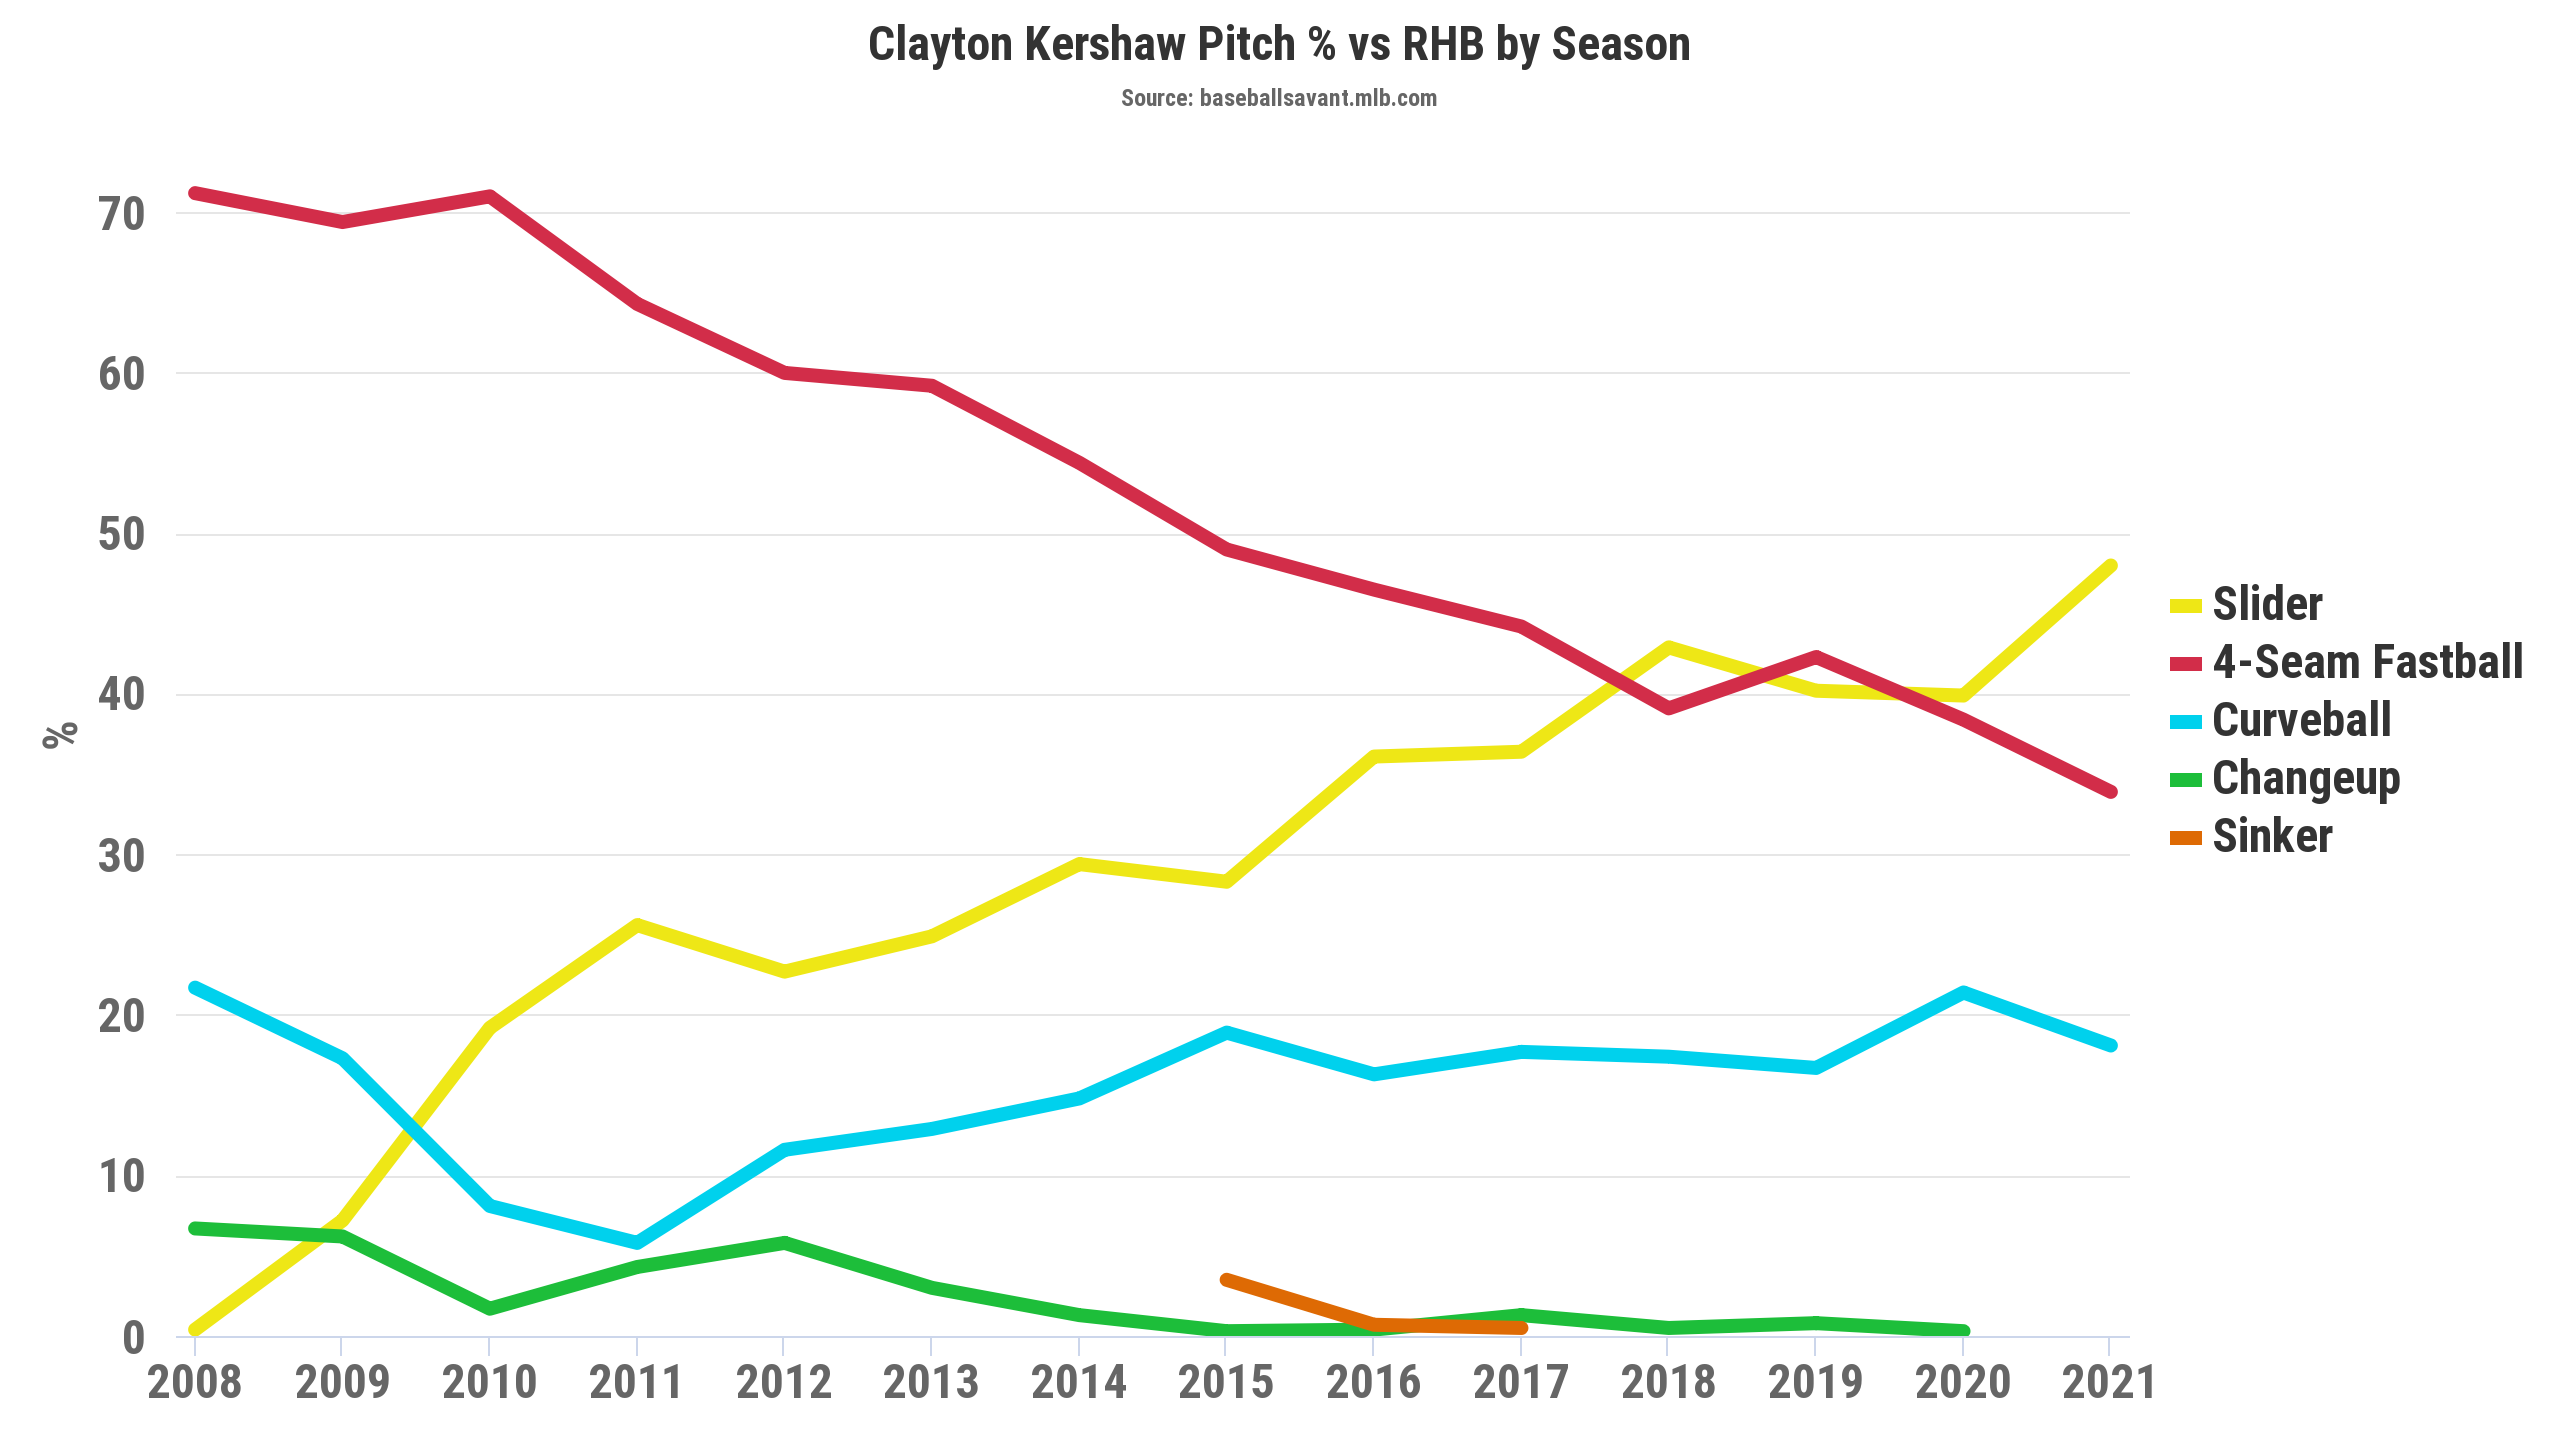
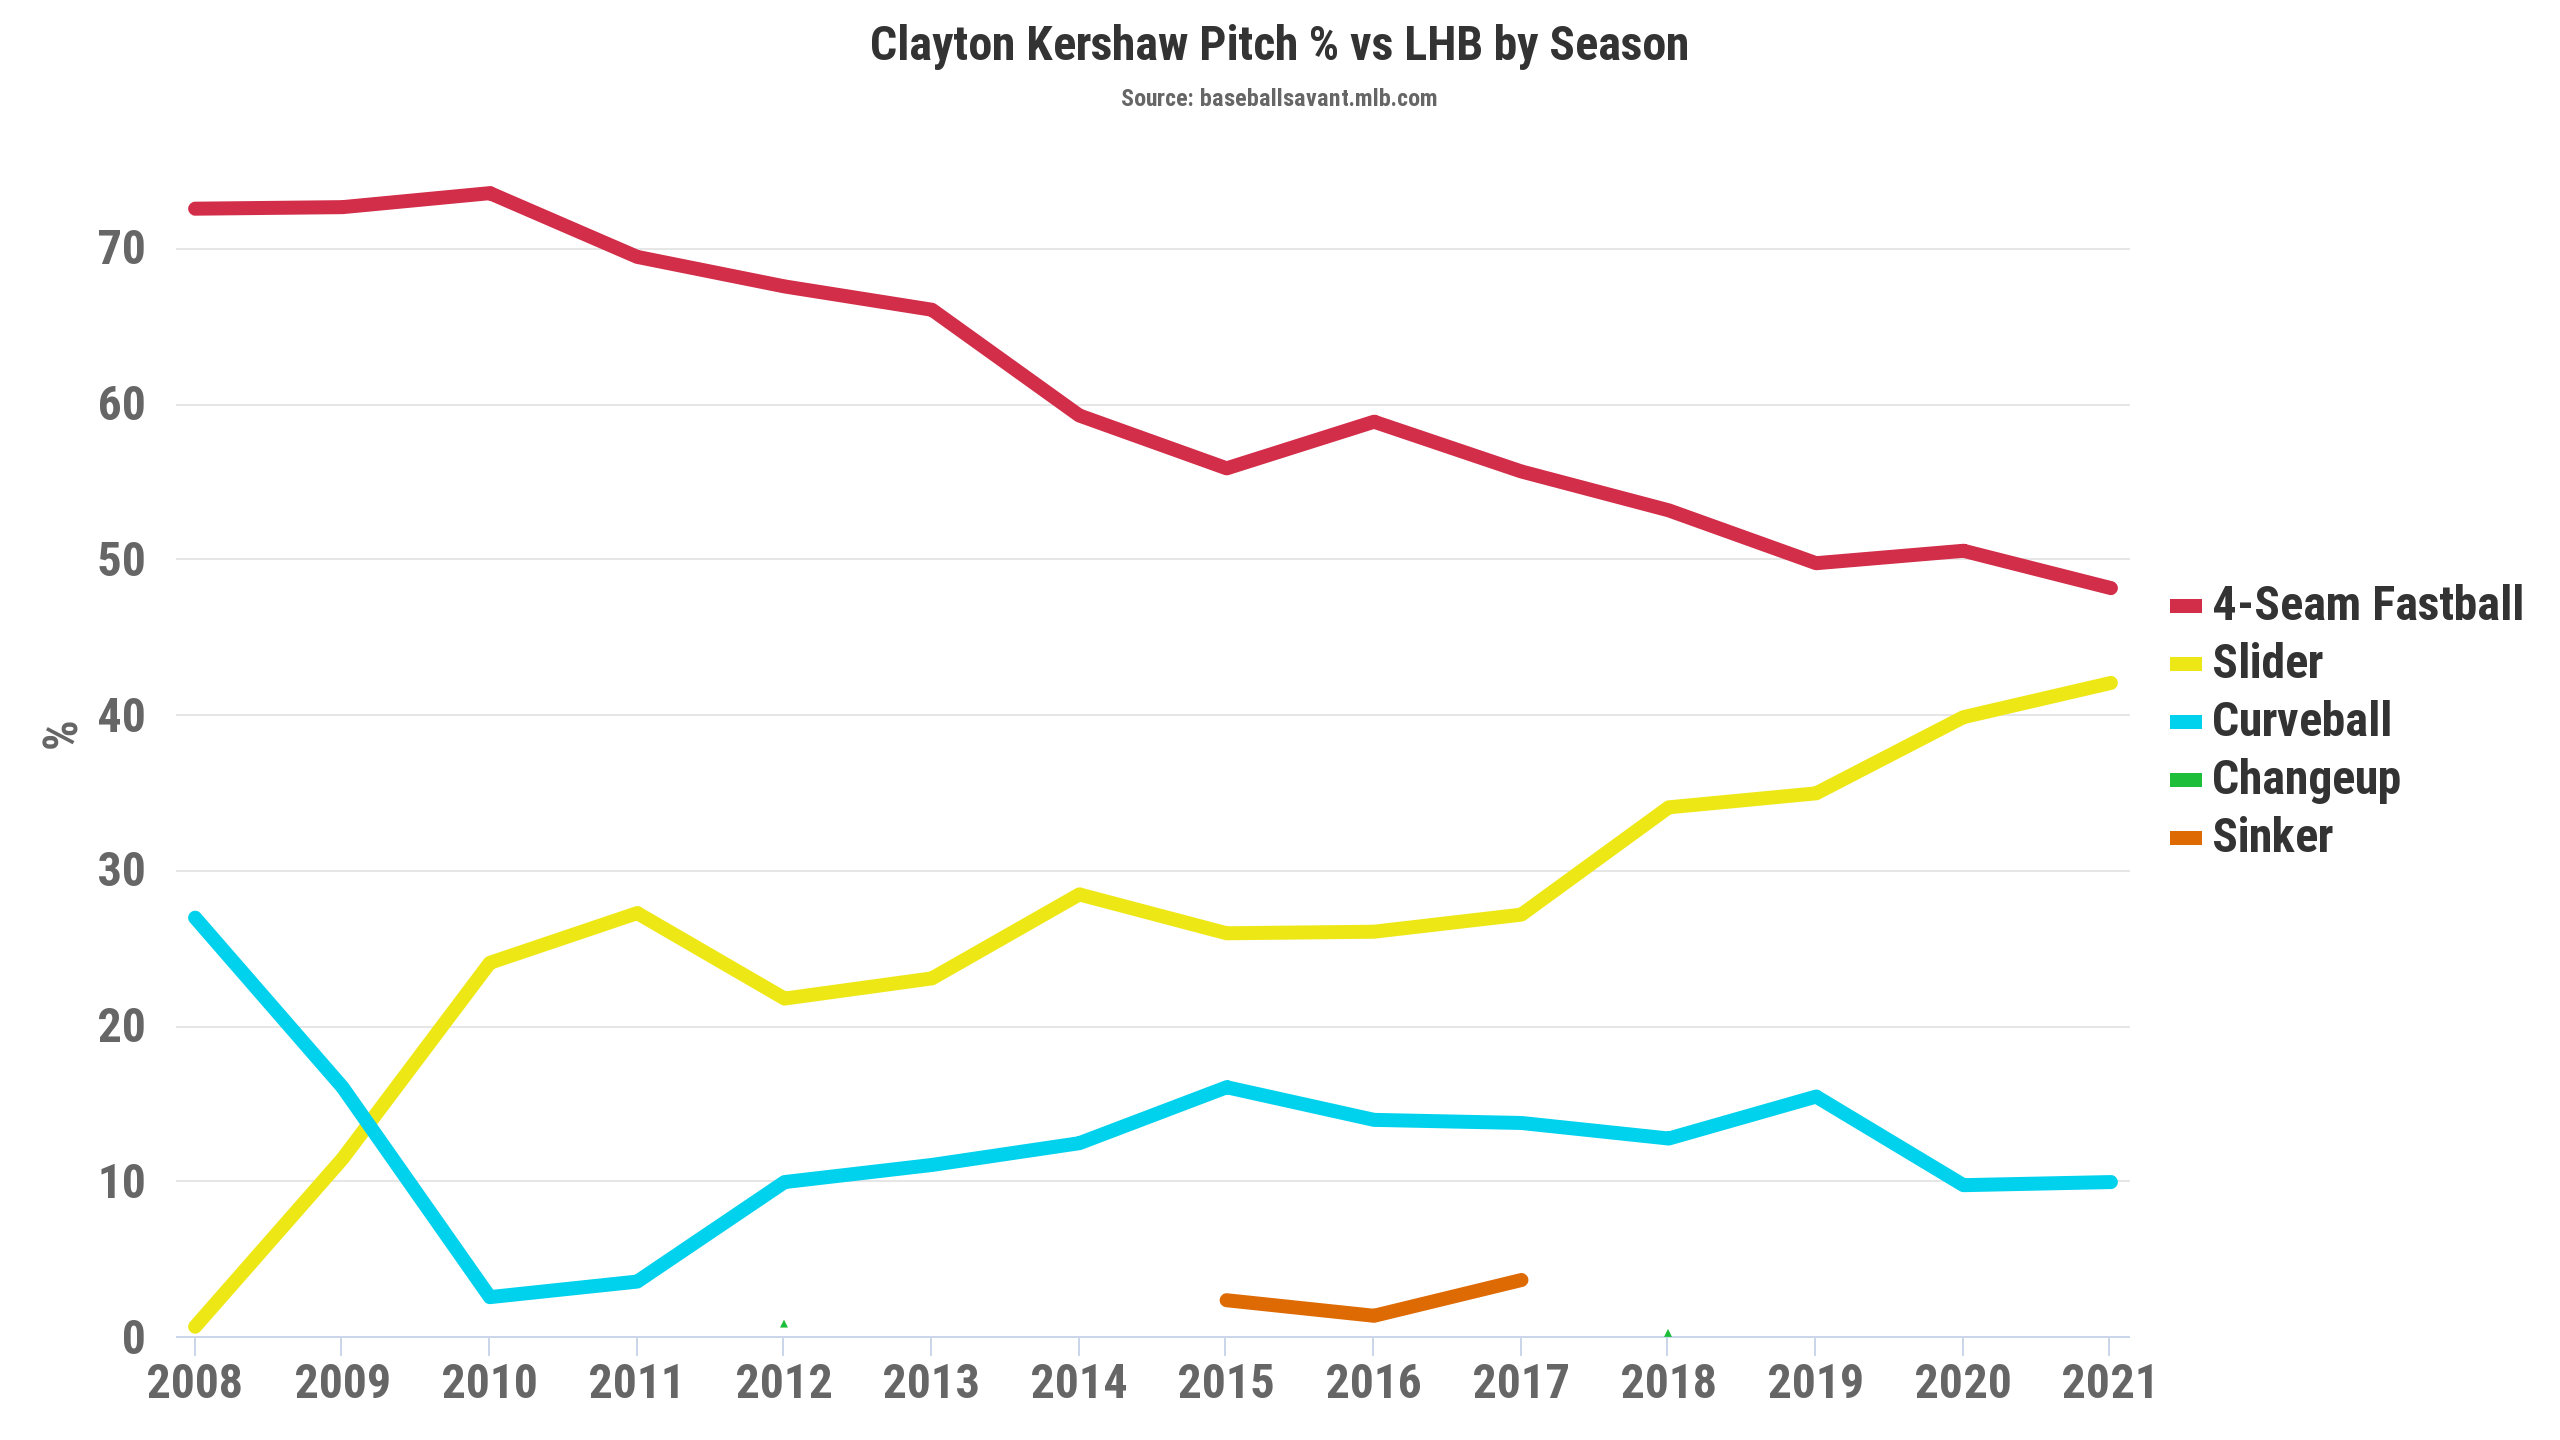
As you can see, he went from the low 40s in slider percentage (40.2 and 39.8 in 2019 and 2020, respectively) to 48 over his first four starts. I know it’s early, but if you are a right-handed batter against Kershaw in 2021, you’re basically getting three fastballs out of 10 pitches. The sample size against left-handed batters is small, just a total of 81 pitches, but it follows his career trend with a not-so-accentuated increase in breaking ball usage.

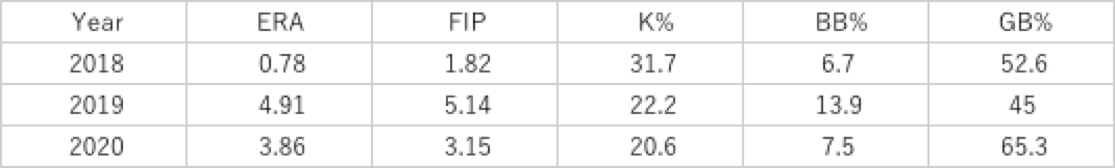
Here is a table of his pitch usage during each game this season:

Clayton Kershaw’s First Four 2021 Starts
Pitch Usage @ Rockies @ Athletics vs. Nationals @ Padres
Fastballs: 28 (36%) 34 (37%) 30 (35%) 39 (40%)
Sliders: 35 (45%) 44 (48%) 41 (48%) 44 (45%)
Curveballs: 14 (18%) 13 (14%) 15 (17%) 15 (15%)
Breaking%: 63% 62% 65% 60%

It’s about as close to the same approach as you can get in terms of pitch selection. As the first graphic showed, somewhere around the 2018 season Kershaw began throwing the slider just as much as he threw the fastball, and this could be the year he takes it one step forward. After all, he looked pretty good striking out Fernando Tatis Jr. three times with the same pitch just one night after Tatis hit a bomb against Walker Buehler in his return from the IL.

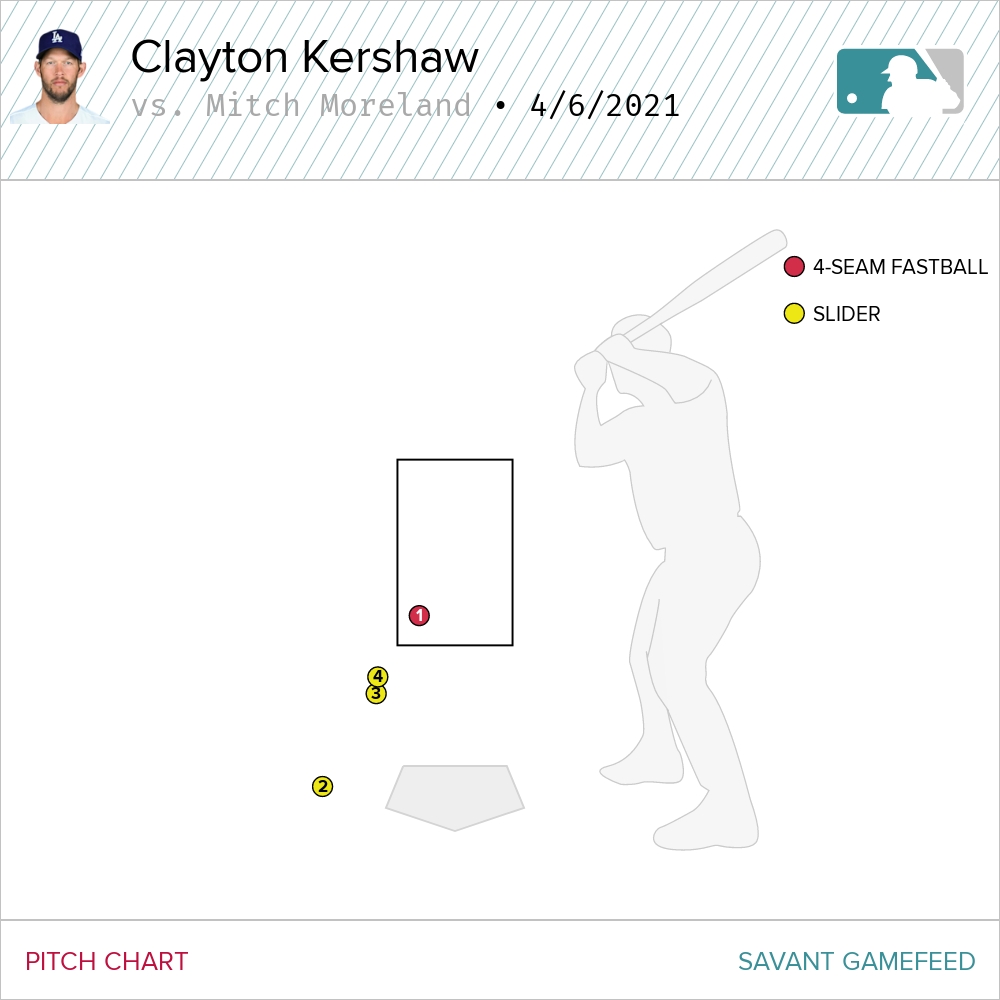
What also helps the left-hander throw that slider so often is the variations of it. Just ask Mitch Moreland.

The first slider Kershaw threw him here went for a ball with a horizontal break of three inches, but Moreland would strike out swinging (on a slider) as the next two broke eight and seven inches, respectively.

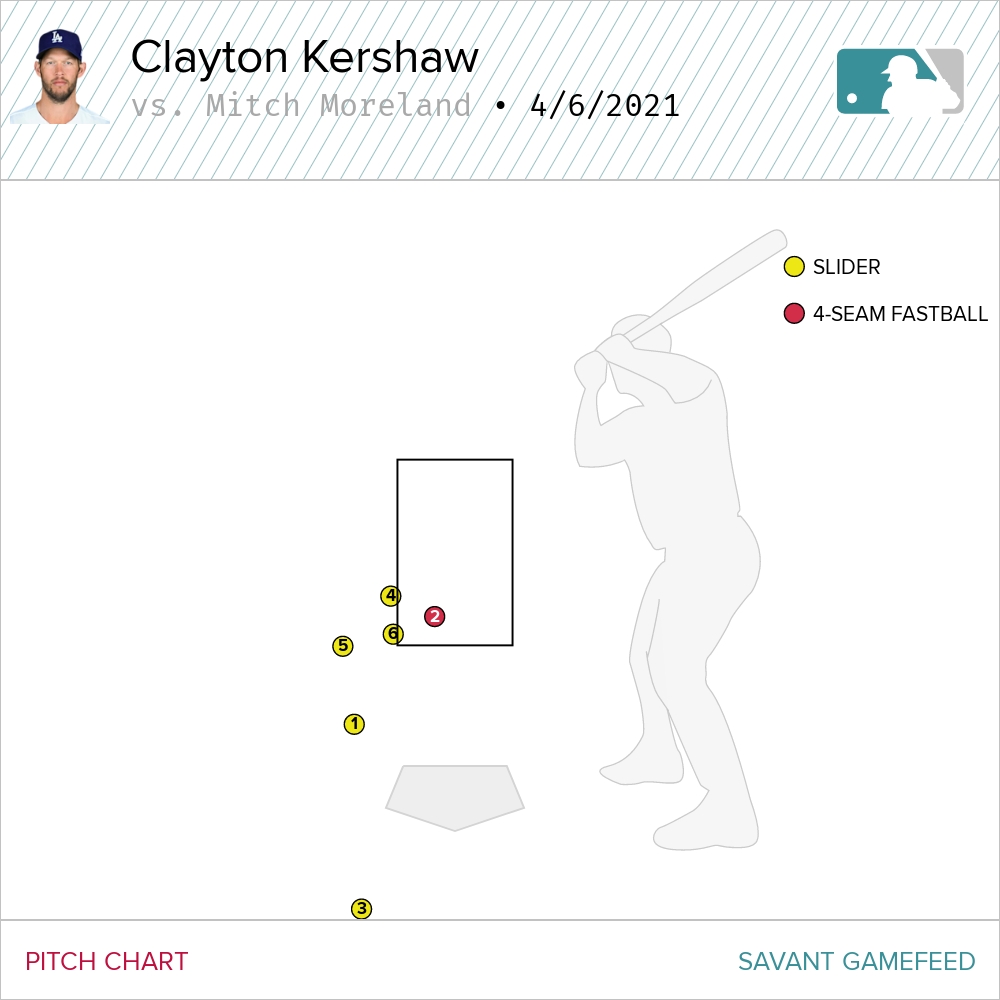
The second time up, Moreland saw six pitches and five were sliders, including the last one to punch him out, which had 30 inches of vertical break and five horizontal.

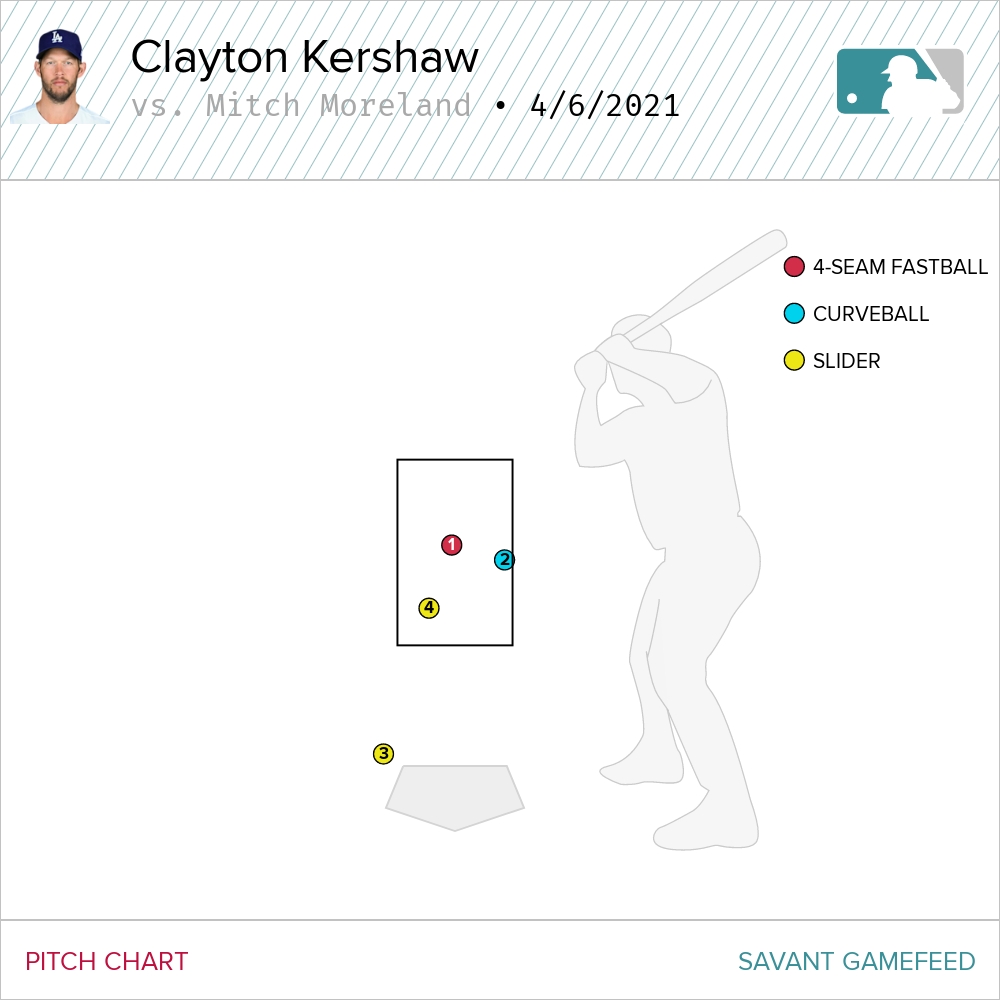
Third time’s the charm? Not so much. Kershaw threw another couple of sliders to finish Moreland off, the first for a ball with a vertical break of 24 inches, but the second one had 30, resulting in a weak grounder to the first baseman.

We’ll see what the season delivers, but so far Kershaw has looked really good following the career trend of pitching selection that’s been a constant since 2011. How far will he go in terms of breaking ball usage? My guess is we’ve seen the limit, or roughly that, for the foreseeable future. It remains to be seen if he can sustain it at that level moving forward, but whether that 60% mark is reached or not, it’s almost a given that he’ll set a career high and also perhaps the new record for non-knuckleballers, his only obstacle being this new “cutterless” Shane Bieber, although I’m betting he’ll bring it back at some point.

Note: No homers over the first four starts is an encouraging sign for Kershaw, and if he experiences a decrease in a trend that was working against him, let’s just say the rumors of his demise might’ve been a little exaggerated. He could may no longer be the overwhelming best pitcher in the game, but he can certainly still be a bona fide ace.

Estevão Maximo is an aspiring sportswriter from Brazil. You can find more of his writing here and here.


Jake McGee: The One-Pitch Pitcher

One of the newest members of the San Francisco Giants, lefty reliever Jake McGee, is coming off one of his best years in the major leagues throwing one pitch: a fastball. Seemingly by magic, McGee twirled a fastball 97% of the time he threw in 2020 on the way to a 2.66 ERA, 0.836 WHIP, and 11 strikeouts for every walk. I will be taking an in-depth look into McGee’s success and failure over his career, which might give better insight as to how he can continue to perform and how a major league reliever can succeed with only one pitch.

McGee was drafted in 2004 by the Tampa Bay Rays and made his major league debut with them in 2010. After his first full season in 2011, McGee posted extremely strong numbers in 2012, 2014, and 2015 with an ERA+ (it will become clear why I use ERA+) of 148 and a K/BB of 5.02 within those four seasons. After the 2015 campaign, McGee was traded along with Germán Márquez to the Colorado Rockies in exchange for Corey Dickerson and Kevin Padlo.

McGee immediately regressed in Colorado, as his ERA+ went from 163 to 103 (ERA+ adjusts for ballparks, which is particularly useful at Coors Field) and his K/BB sunk from 6 to 2.38 in the transition from the Rays to the Rockies (2015-2016). Of course, some of this decline is attributed to the difficult conditions of Colorado, but there is also additional evidence to show that McGee’s style of pitching contributed to his declined performance. Following 2016, McGee remained a strong-yet-aging reliever and was ultimately released by the Rockies in July of 2020.

Four days later, McGee signed with the Los Angeles Dodgers and proceeded to outperform even his 27-year-old self with an incredible season. McGee finished in the 99th percentile in K%, 96th in BB%, 95th in xERA, and 95th in xwOBA. So what exactly was the cause of this change and what did McGee do to get there? Read the rest of this entry »


Pound the Knees, Steven

After the Toronto Blue Jays traded for left-handed pitcher Steven Matz, he is projected to slide into the bottom of the starting rotation and pitch about 115 innings this year. Matz’s 2020 was a year to forget — join the club, Steven — but let’s take a look at who Matz is as a pitcher and why a change in fastball location is something the Jays coaching staff might consider.

Matz pitched only about 30 innings last year, so in the interest of sample size, I will also be using statistics from 2019 and 2018. Here is what those last three seasons looked like, courtesy of Baseball Savant: Read the rest of this entry »


Maybe It’s Better To Never Swing at Shane Bieber’s Pitches

You don’t need me to tell you how effective Shane Bieber was in 2020. He led the majors in ERA, FIP, K/9, overall strikeouts, and of course was the unanimous winner of the AL Cy Young Award. The underlying pitch-tracking data all back up the quality of his skillset. He’s very good. So you’re probably wondering how this all jibes with a title suggesting it may be better for hitters to not swing at Bieber’s pitches, right?

I’ll start with this: Bieber’s 34% zone rate ranks 316th out of 323 pitchers who threw a minimum of 20 innings in 2020. That’s dead last among qualified starters. How is this possible? The simple answer is that, once again, he’s very good. The slightly less simple answer is that batters swing at unhittable pitches and don’t swing at hittable pitches. Bieber throws almost twice as many pitches out of the zone as he throws in the zone, so what if hitters just stopped swinging at his offerings? Surely he would just change his approach if a batter didn’t swing at his pitches, right? Read the rest of this entry »


The Max Fried Change That Gave Way to a Stellar Season

After reading Alex Chamberlain’s piece on Kyle Hendricksability to suppress exit velocity, I was interested in attempting a similar investigation. Beginning with a linear mixed-effects model and Statcast batted ball data from the 2019 and 2020 seasons, I looked at which pitcher-pitch combinations were most effective at creating weaker contact and found similar results to Alex’s: Hendricks was still amazing. With a new toy in hand, I asked myself the next logical question — which pitcher-pitch combination improved the most from 2019 to 2020 (minimum 50 balls in play each season)?

The answer turned out to be Max Fried’s four-seam fastball.

When I consider Fried, the first thought that comes to mind is his breakout 2020 season. After establishing himself as a rotation mainstay the prior year with peripherals (3.72 FIP and 3.32 xFIP) that outpaced his results (4.02 ERA), Fried decided to stop giving up the long ball in 2020 (.32 HR/9). The reward for a season well-pitched was a fifth-place finish in Cy Young Award voting. The second thing that comes to mind about Fried is his devastating curveball. Since his first cup of coffee in 2017, Fried’s curveball spin rates have ranked between the 81st and 92nd percentiles, with hitters consistently struggling to square-up the pitch. For his career, Fried’s curveball xwOBA is just a hair above .200. It’s no surprise that FanGraphs’ 2018 prospects ratings gave Fried a 65/70 grade for the curve.

On the flip-side, Fried’s four-seam fastball may only be notable for being unconventional. In a period when four-seamers are supposed to be high-speed and high-spin, Fried’s does neither. Read the rest of this entry »


Aaron Nola Will Make You Question Yourself

In one of the later chapters of The MVP Machine, the authors describe a working relationship between a professional baseball player (an unnamed position player) and a writer at an “analytically inclined” baseball website. The player felt that his club’s advanced scouting data wasn’t granular enough and asked the writer to supplement the information with more detail. The writer summarized that the player was basically looking at three things: “Am I squaring up the ball? Am I swinging and missing? Am I swinging at strikes?”

That last question got me thinking. As a pitcher, it is rarely a bad idea to have batters look at called strikes and swing at balls. Which pitchers, in 2020, were particularly effective at doing just that? To make that determination, I looked at Statcast data for all pitchers who threw at least 60 innings in 2020. Specifically, I looked at their outside-zone swing rate and their zone take rate – calculated as just (1 – zone swing rate) – and took the average of the two. Note that this analysis completely omits what happens if contact is made with the ball; We’re merely interested in strikes that were taken and balls that were swung at. (If you’re interested in the Statcast query and the few lines of code for this, click here.) The top 10 was as follows: Read the rest of this entry »


How Blake Treinen Reinvented Himself

Earlier this month, Blake Treinen returned to the Dodgers on a two-year, $17.5 million deal. Treinen was non-tendered by the Athletics after a down season in 2019 before signing a one-year, $10 million deal with Los Angeles that led to a decent bounceback in 2020.

While the Dodgers were also reportedly interested in adding Liam Hendriks, now a White Sox, the fact that they eventually signed Treinen to a multi-year deal suggests that they were looking closely at his performance in 2020. However, from looking at various data and video, Treinen in 2020 appears to be a particularly different pitcher than Treinen in 2018.

I’d like to take a closer look at how Treinen has changed since his time with the A’s. The first thing to note about his performance after joining the Dodgers is that his groundball rate was 65.3%, up more than 20 points from 45.0% the year before. This is more than 10% higher than in 2018, when he had the best performance of his career. Meanwhile, his strikeout rate was 20.6%, the lowest since his debut in 2015 and well under his career high of 31.7% in 2018. These numbers lead me to believe that Treinen’s change in pitching style is intentional. Read the rest of this entry »


The Best Catcher in Free Agency (Not Named Realmuto)

There are few things in baseball worth more than a star-level catcher. Playing a position that requires you to squat each day for a 162-game season makes for a lot of injuries and shortened careers, and the role of a catcher is so crucial between game-calling, baserunning control, framing, and blocking, that just playing your good defense and being pitcher-friendly will get you a long career no matter how horrible you are with the bat.

Fortunately for all teams in need of a receiver, the 2020 free agent market offers one of the rarest cases among the sport, a true five-tool catcher: J.T. Realmuto, the former Marlins and Phillies backstop, is available for his mere salary.

You want a steady bat, maybe with some thump? Realmuto walks in sporting a career .278 AVG, .455 SLG, and double-digit homers in each of his six “full” seasons in the league.

You need a reliable asset, one that punches the ticket and goes to work? He averaged over 130 games from 2015-19.

You need a rock-solid defender that can also help your guy on the mound? J.T. is there for you with a rocket arm (over 88 mph on his average throw) and a spotless fielding percentage, and while he’s behind the plate, he’ll steal strikes for your pitchers as a 95th-percentile framer does.

Heck, he’ll even run if you ask him to, dashing at over 28 mph, making him an 84th-percentile runner, an absurdity given his role on the field. Read the rest of this entry »


How Much Value Is Really in the Farm System?

Everyone knows that a strong farm system is key to the long-term success of a major league organization. They make it possible for clubs to field competitive teams at affordable salaries and stay beneath the luxury tax threshold, but how much value can an organization truly expect from their farm system? How much more value do the best farm systems generate compared to the worst ones? I decided to take a closer look.

Methodology

The first thing I did was gather the player information and rankings from the Baseball America’s Prospect Handbooks from 2001-14 and entered them into a database. I then found players’ total fWAR produced over the next six seasons, and I added them together to find the values that each farm system produced. I chose six seasons to ensure that teams wouldn’t get credit for a player’s non-team-controlled years, since the value produced would not be guaranteed for the player’s current organization. This method will reduce the total value produced by players that are further away from the majors, but the purpose of this analysis is to focus on the value of the entire farm system and not an individual player’s value over the course of their career.

Let’s look at the 2014 Minnesota Twins as an example. Below is a list of the thirty players that were ranked and the amount of WAR that each player has produced by season. Read the rest of this entry »