Having presented the concept of BOOG Score in my previous article, we can now use it to discuss Hall of Fame candidacies for specific players. If you don’t have time to review the introductory piece, the CliffsNotes version is this: BOOG Score is an accumulating stat measuring overall player value, intended for comparisons between elite players. It’s a player’s career Wins Above Average (WAA) total, but with all negative seasons zeroed out and ignored. This rewards longevity, but only for players who continue to contribute at an above-average level; for example, George Brett’s final three seasons, when he was a below-average hitter as a full time DH, add nothing to his career total.
The rest of this article will be devoted to reviewing the state of the Hall of Fame as it relates to BOOG Scores, broken down by primary position. Each table that appears below will detail career BOOG totals for one position. I’m going to focus on infielders who have already had a chance to appear on a Hall of Fame ballot; outfielders, catchers, pitchers, and active or recently retired players will be discussed in future articles.
Readers who are familiar with Jay Jaffe’s work on the JAWS metric will understand the concept of the positional average — the average total for all currently inducted Hall of Famers at this position. Being above the positional average is often cited as a point in favor of a player’s election to Cooperstown. I’ve chosen to use median instead of mean, but the concept is the same. I’ll also list what I’m calling the marginal threshold, which can be thought of as a lower threshold of excellence that still conveys something meaningful about a player’s candidacy. To explain by way of illustration, using the shortstop position as an example: There are 25 shortstops currently enshrined in the Hall. That suggests that the 25th-best shortstop in major league history should be considered a reasonable candidate – not necessarily a strong candidate, but at least worthy of review. I define the marginal BOOG threshold at each position to be the Nth best BOOG score of any (retired) player who primarily played there (regardless of whether that Nth player is actually in the Hall), taking N as the current number of inductees. For the shortstop example, that 25th-best shortstop is Nomar Garciaparra with a BOOG score of 26.9. Along with Garciaparra, two other shortstops are outside the Hall with career totals at or above the marginal threshold, but below the Hall of Fame median of 37.9. For that reason, they probably still merit some discussion even if they are not slam dunk inductees. Read the rest of this entry »
In 1889, Hall of Famer John Clarkson had one of the best pitching seasons ever by WAR. He won the Triple Crown with a 2.73 ERA, 284 strikeouts, and a win-loss record of 49-19. He also threw 620 innings, the most in the league and a total that represented more than half the combined workload of his team’s entire pitching staff. Although no one knew it at the time, his retroactively calculated ERA- was 64 and his FIP- was 82; both of those rates led the league among qualified pitchers. If the Cy Young award had existed in the National League at that time, he almost certainly would have been the recipient.
In 2025, Tarik Skubal had a dominant season. He didn’t repeat his Triple Crown achievement from 2024, but his ERA and strikeout numbers both improved from the prior year. His 195 1/3 innings were tied for fourth in the majors, and his 54 ERA- and 58 FIP- not only led among all qualified AL pitchers, but also significantly exceeded Clarkson’s 1889 performance. Skubal’s performance was more than good enough for him to win his second consecutive Cy Young award.
Clarkson’s pitching WAR was 10.9; Skubal’s was 6.6. Whose season did more to bolster his Hall of Fame case? Read the rest of this entry »
Last year, I finished Shape+ v1.0, my attempt at a novel approach to pitch modeling, and submitted it to the FanGraphs Community Blog. However, I have since identified several issues with the original framework. In short, v1.0 included a random effect for “PitcherID” — it allowed the model to implicitly learn pitcher identity and use it as a crutch when generating predictions.
Instead of evaluating a pitch in a vacuum as I intended, the model would defer to the random effect, which has soaked up all information not explicitly coded into the models mixed effects. What’s more, the random effect also prevented the model from generalizing. If a pitcher was not included in the training data, it would not be assigned an intercept by the random effect, and therefore would not be scored. In an attempt to rectify this, I decided to try a different approach. Shape+ v2.0 is normally distributed, with 100 representing league-average pitch shape, and each 10-point increase representing one standard deviation. The new Shape+ remains a stable and sticky metric, exhibiting an R2 of 0.881 between 2024 and 2025 scores, and stabilizing after 50–80 pitches depending on the pitch type. Read the rest of this entry »
Would you rather have a guaranteed $140 million today or a chance at $1 billion six years from now? That very well may have been the decision facing Konnor Griffin earlier this month, and we know which path he chose.
The vast majority of us probably would have made the same decision as Griffin, who signed a nine-year, $140 million deal with the Pirates less than a week into his major league career. Lots of things can go wrong in six years that could eliminate that potential billion-dollar payout, let alone the many millions of dollars currently on the table. Griffin is far from the only young star in recent years to take the money. Bobby Witt Jr., Corbin Carroll, Julio Rodríguez, and fellow 2026 rookie Kevin McGonigle, among others, have made the same choice.
Still, Griffin’s combination of youth and ability set him up to be an even more attractive free agent target than any of the players who’ve signed early extensions in recent years. And had he not been so risk averse, he might have been worthy of baseball’s first 10-figure contract. How? It’s pretty simple, but far from easy. Just become the next Juan Soto.
Sure, comparing these two ballplayers makes little sense in some ways. Despite leading the National League in stolen bases in 2025, Soto is relatively slow. He also walks more than he strikes out, and is a defensively limited outfielder who is likely to shift to first base or designated hitter not too many years from now.
Griffin, on the other hand, is a top-tier speedster built like a football safety. He strikes out roughly twice as often as he walks, and is a reasonable bet to play shortstop for at least the first half of his career before perhaps sliding over to third base at some point in his 30s, not unlike Cal Ripken Jr. or Alex Rodriguez. (Hey, if we’re going to cite Soto, why not also invite comparisons to a first-ballot Hall of Famer and a guy with 696 home runs?)
Soto broke into the big leagues in 2018 at age 19, playing over two-thirds of the Washington Nationals’ game that season, reaching 494 plate appearances with a stellar .292/.406/.517 triple-slash line that overcame already weak defense to lead to 3.7 WAR.
He continued to pile up fantastic batting lines (and display poor glovework) during the next six seasons, spending three and a half more with the Nationals, then bouncing to the Padres for a year and a half and the Yankees in his walk year before becoming a free agent ahead of his age-26 season. If you consider his 116-game rookie campaign and the COVID-shortened 2020 as the equivalent of one season, Soto posted 36.6 WAR during what were essentially six full seasons prior to his pre-free agency tenure.
Betting on himself year after year (famously turning down a 15-year, $440 million offer from the Nats) allowed Soto to reach new benchmarks in arbitration, as he eventually hauled in over $80 million total before hitting the open market. And then Soto obliterated every prior free agent sports contract, signing with the New York Mets for the same 15-year term offered by Washington, but this time for $765 million. That was a $315 million winning bet, an incredibly savvy move by the precocious superstar.
That’s the rather straightforward benchmark for which Griffin needed to shoot. Stay healthy, compile a half-dozen 6-WAR seasons, and then sit back and wait for the gargantuan offers to come his way. So, how could he accumulate all of those 6-WAR seasons? Clearly, it’s a lofty expectation, but Griffin has a couple of immediate advantages that Soto lacked.
First, he’s a shortstop, while Soto is a corner outfielder, so the positional adjustment alone gains Griffin 15 runs, or roughly 1.5 WAR. On top of that inherent advantage, the fact is, Soto has never been a good fielder, averaging roughly -10 runs per year. Conversely, Griffin is viewed as an above-average defender, so +5 runs per season seems reasonable, doubling the defensive separation between the two players to 3.0 WAR.
Second, Soto has been a below-average baserunner in his career, averaging about -1.0 run per season. Meanwhile, Griffin has 70-grade speed and has achieved 98th-percentile sprint speed in early 2026 action. An average of 4.0 runs per year seems reasonable — conservative, even — and gives Griffin another 0.5 WAR edge on Soto. Given the significant variability of defensive and baserunning values, let’s tame our wild expectations somewhat by blending and smoothing those two advantages and yielding a 2.5-WAR edge for Griffin from those factors.
Building on that sizable head start achieved before stepping into the batter’s box, all Griffin would have to do is produce another 3.5 WAR per season with his bat. Shouldn’t be a problem, right? There are myriad of ways for hitters to be successful, but based on the type of player Griffin was in the minors, we can patch together an estimated batting line. We won’t use the projection systems stored at FanGraphs, which are designed to be conservative, and instead go with an approximation of what his ceiling could reasonably be over his first six seasons.
Griffin’s approach is unlikely to lead to the .400-plus on-base percentages that Soto posts, but his speed should allow him to get to first base often when he puts the ball in play. And at 6-foot-3 and 222 pounds, Griffin should also display significant power as he gains more big league experience. Indeed, the FanGraphs prospect analyst team of Eric Longenhagen, Brendan Gawlowski, and James Fegan gave Griffin future values of 70 for both his raw power and his game power when ranking him no. 1 on their preseason Top 100 Prospects list. (For what it’s worth, Eric Longenhagen and Kiley McDaniel assigned Soto a 60 FV for raw power and a 55 for game power when they evaluated him ahead of the 2018 season.) Again, we’re making a case for a massive payout, so let’s skew toward generosity and give Griffin a .280/.360/.490 triple-slash line on average for the six seasons, something akin to a Soto-Carroll mash-up, just on the infield dirt instead of the outfield grass. Offensive environment certainly matters, and in the reduced hitting environment of the last several seasons, those standout numbers should easily be worth at least 3.5 WAR per season.
Voila, we’ve done it! Somebody give Griffin one of those giant checks that lottery winners receive, because we’ve morphed him into the modern-day equivalent of turn-of-the-millennium A-Rod, another young superstar shortstop who obliterated the prior record for largest contract. But wait, $765 million is a far cry from $1 billion, right? It certainly is, but inflation is an inevitability for all of us, and a few years of compounding adds up quickly.
Soto signed his megadeal prior to the 2025 season, while Griffin would have been a free agent heading into 2032, assuming he receives a full year of service credit this season by finishing in the top two in the NL Rookie of the Year voting. If baseball salaries experience just a 4% average annual increase during that seven-year time period, the result is a 31.6% gain. Multiply $765 million by 1.316, and you get a bit more than $1.006 billion.
If you’re Griffin, and you’ve just achieved an equivalent performance to one of the best young players the game has ever seen, stayed healthy over the last six years, and are in line to continue playing a more premium defensive position than Soto, a contract of that magnitude would be justifiable, though maybe you’d be magnanimous and round it down to an even $1 billion.
Of course, now that he’s locked up through his age-28 season, Griffin’s situation mirrors that of so many of his contemporaries. Having just turned 20 years old, he’s set for life — and well beyond — while Pittsburgh fans have assurance that he’ll be playing in a Pirates uniform at least into the mid-2030s. In return, Griffin’s free agency has been postponed three seasons — three prime performance (and earning) seasons. Unless he significantly outperforms what we’ve estimated above and baseball inflation sours, we’ll have to continue waiting for MLB’s first billion-dollar superstar. And who knows how long that wait will be?
“One for the Money. Two for the Show.” That’s how the saying goes anyways. And that’s how Cristopher Sánchez’s career has gone thus far.
After a stretch of 33 starts from 2023 through mid-June 2024, in which the lanky lefty compiled 183 2/3 innings of a 3.09 ERA, he was really into the money, to the tune of a four-year, $22.5 million extension – with room to grow to six years and $56.5 million with incentives and club options.
He followed up this showing with 15 more strong starts, along with a five-inning performance in Game 2 of the NLDS, the Phillies’ only win against the Mets, to put a bow on his second year as a rising star in the majors.
But why isn’t he treated as such? You won’t often find the 28-year-old gracing MLB’s Instagram account, or even Pitching Ninja’s for that matter. He is not marketed as an ace despite his relative youth, place in a big-market postseason rotation, and proclivity to go deep into games.
Maybe the better question is, why should he be? I’ve decided to take up that mantle, at least within the friendly confines of the FanGraphs Community Blog.
For starters (pun definitely not intended), Sánchez carries a modern ace workload. Across 31 starts in 2024, Sánchez reached 181 2/3 innings. Like a true ace, he faced 24.32 batters per start – for context, this lines up with the volume of notable innings eaters Corbin Burnes and Tarik Skubal, and was certainly in the upper echelon of 2024 starting pitchers.
So, he faced a lot of batters. He also eclipsed 90 pitches per start. Both of these statistics matter because, to an extent, the best ability is availability. Cliché, sure, but true for postseason hopefuls like the Phillies, and true when it comes to staying at the top of fans’ minds. Put differently, Sánchez’s 3.32 ERA was stretched over more innings than most starters in the league threw last season. That is valuable.
Under the hood, the most notable pieces of Sánchez’s profile are his sky-high 39.3% O-Swing% (Sports Info Solutions) and solid 65.8% first pitch strike rate. That 39.3% O-Swing% was good for first in baseball last season. That’s right: Cristopher Sánchez – League Leader. Let that sink in.
As I mentioned earlier, Sánchez is not thought of as a particularly nasty pitcher. His stuff is not commonly GIF’d. He is relatively obscure, as far as sub-3.50 ERA starters on playoff teams go. Yet, he clearly stands out, especially when it comes to generating swings on pitches outside of the zone.
So how does he generate all of this chase? And why aren’t we calling him Chasetopher Sánchez (that may be more obvious)?
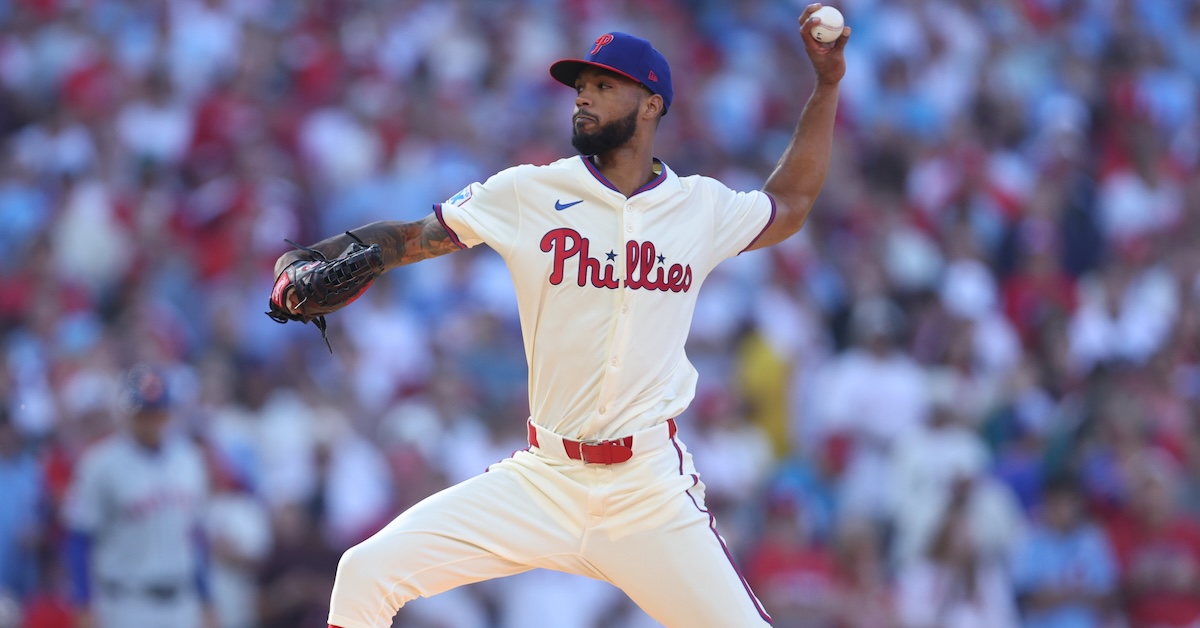
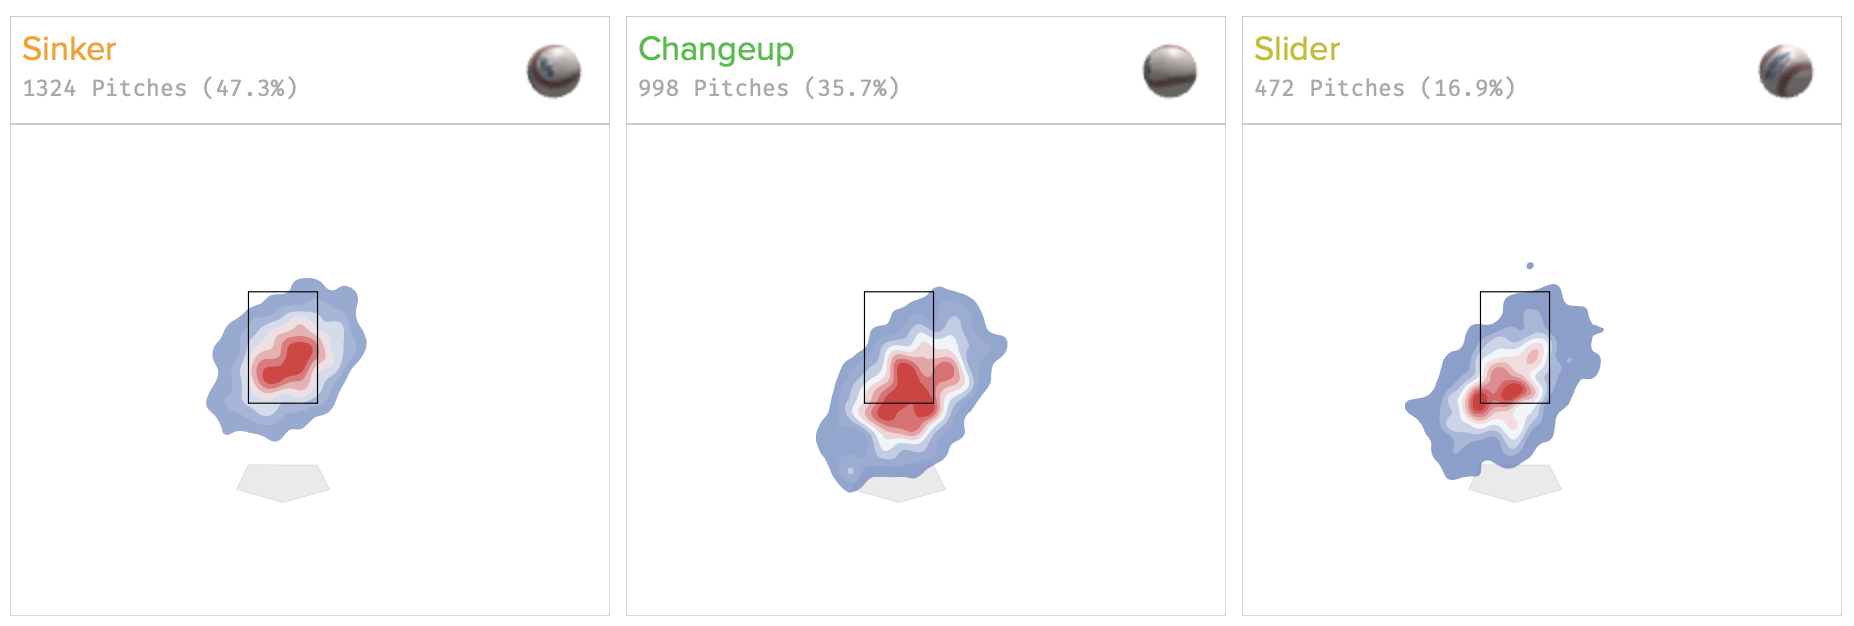
Sánchez throws three pitches according to Baseball Savant: sinker (47.3%), changeup (35.7%), and slider (16.9%). And he generally throws them all low in the zone.
This makes sense. He is a groundball specialist, generating a 58.3% groundball rate last season, good for a 95th percentile finish and the consequent bright red bar on his Savant page. And if we all are trained to do one thing, it’s to love when a player has bright red on his Savant page. It’s akin to a “Happy Hour” sign in a bar window or “BOGO” sign at the deli. It’s the modern day siren song. How could you not follow it?
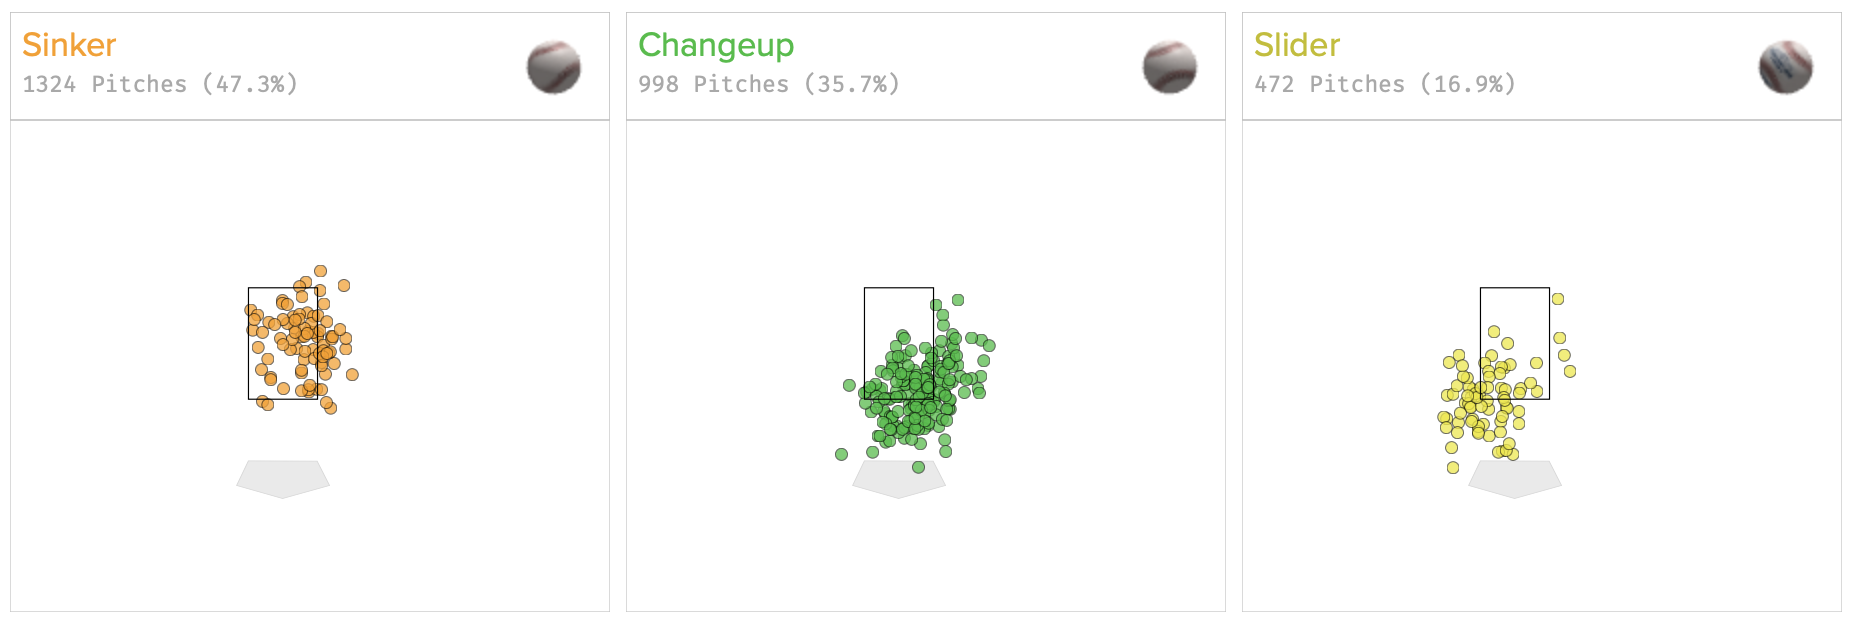
The graphic above shows Sánchez’s three primary pitches and plots only those that generated swings and misses. Clearly, changeups below the zone make up the vast majority of his impressive O-Swing%, followed by sliders below the zone.
Sánchez threw his changeup outside the zone 71.8% of the time last season when ahead in the count (compared to 51.1% of the time when behind) and threw sliders outside the zone 60.4% of the time when ahead. Another note – the changeups in these situations skew glove side, while the sliders skew arm side.
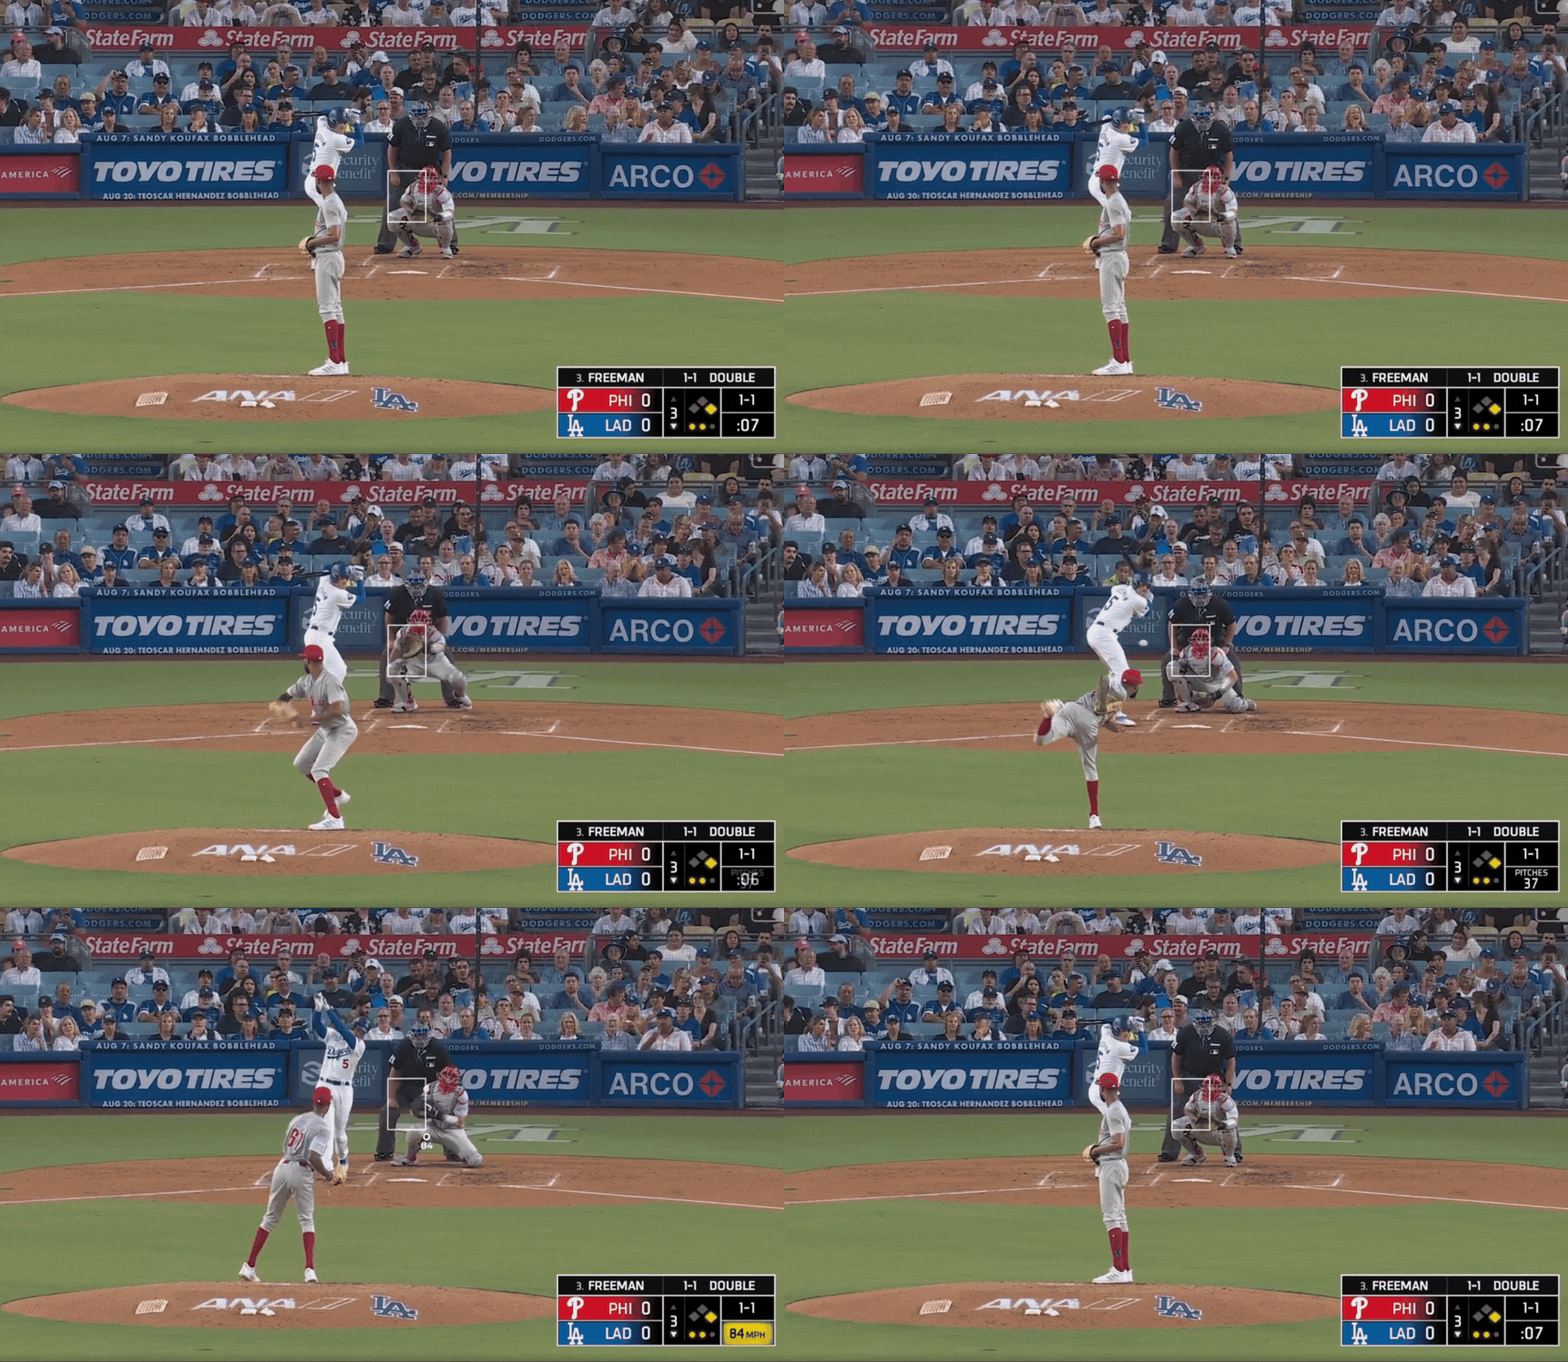
Here was a particularly nice changeup thrown to Freddie Freeman in a 1-1 count.
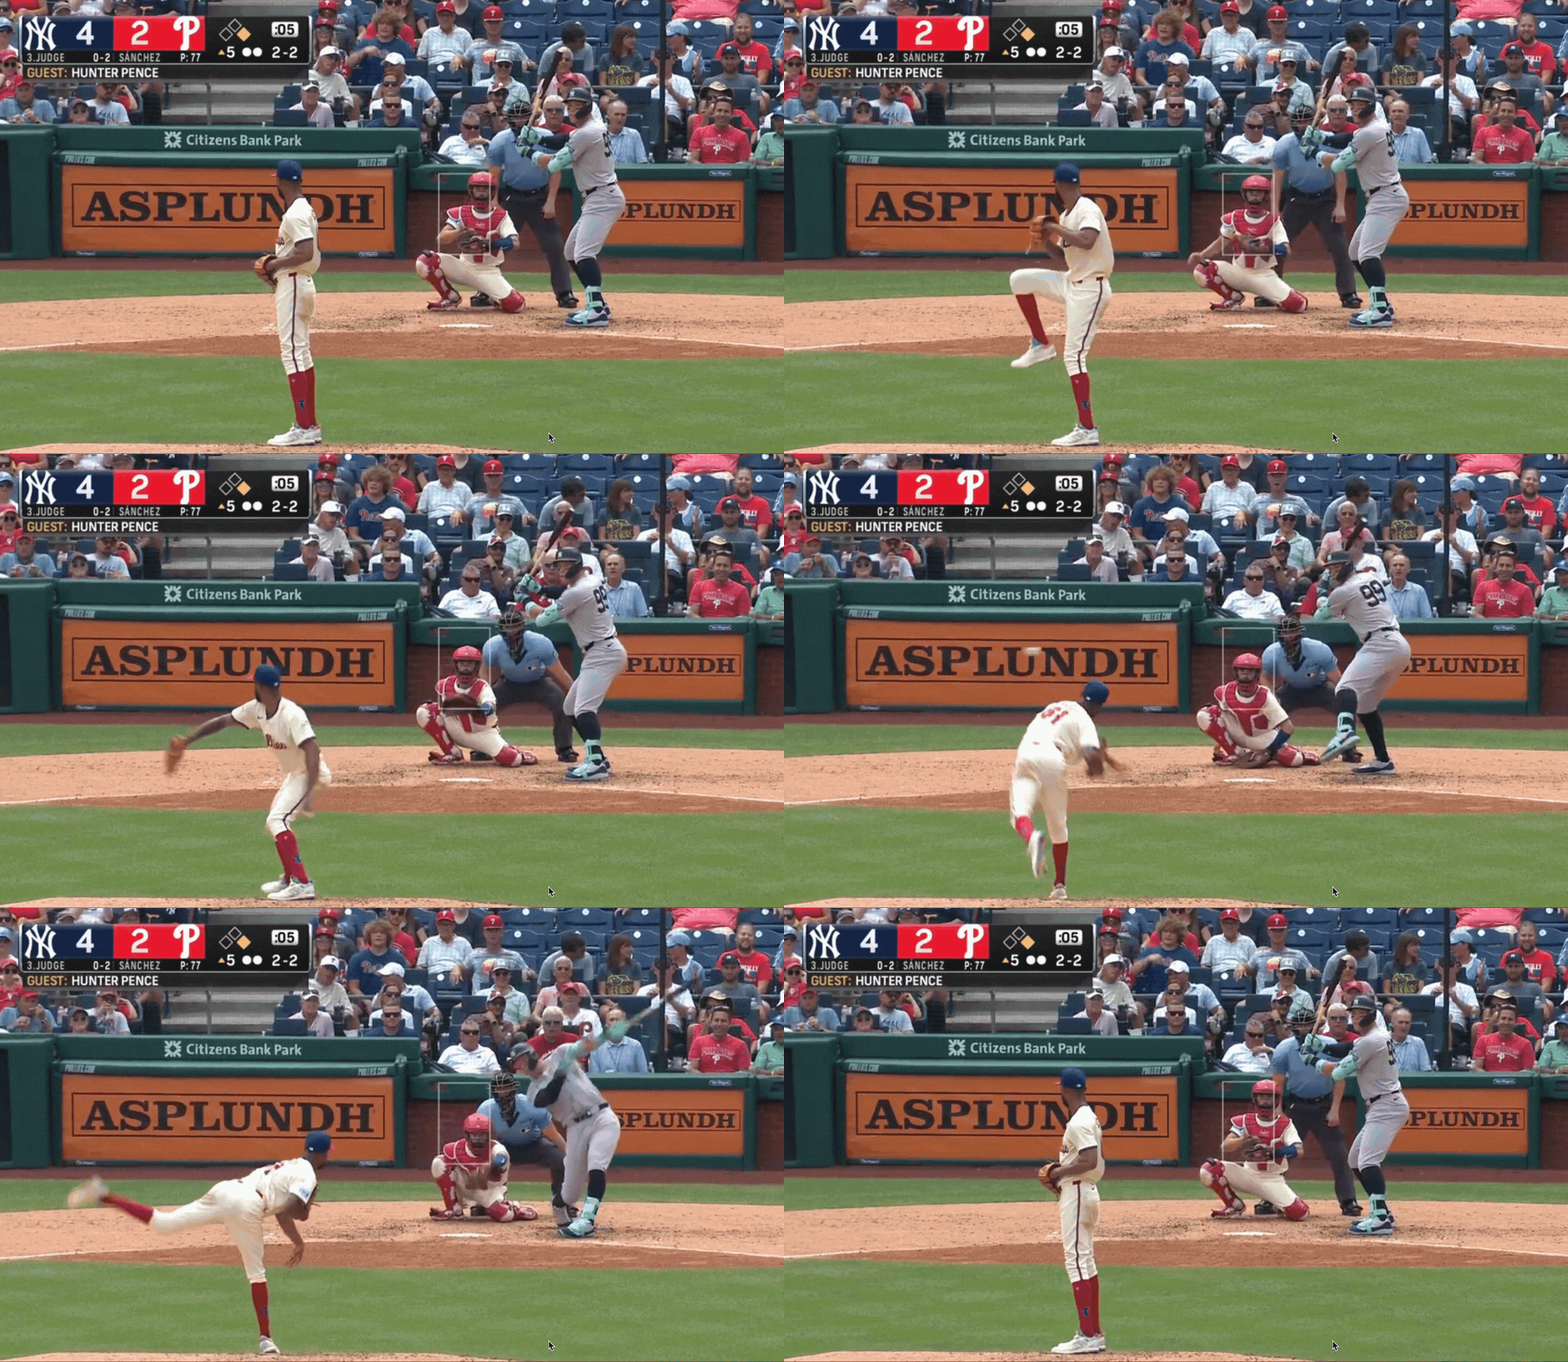
This same pitch and location worked against lefties and righties. See the following string-pull presented to Aaron Judge.
The changeup plays well off of the sinker, his most commonly thrown pitch. There is a nearly 10-mph velocity gap between the two offerings, and both come from the same arm angle and have nearly identical arm-side tail. In other words, this is a nasty pitch, which is borne out in the 18 run value that the pitch generated in 2024, according to Baseball Savant.
Sánchez is elite at generating chase swings, likely because his best pitch is spotted to do just that. But part of why he may not get the consequent publicity his ERA would suggest he deserves is because, even as he gets all those swings on pitches outside the zone, he doesn’t miss as many bats as other high-chase hurlers.
Cubs lefty Shota Imanaga and Twins righty Bailey Ober finished second and third in O-Swing% last season, respectively. Both also allowed less contact on pitches in the zone and generated more swinging strikes than Sánchez. Not surprisingly, thanks to these whiffs, both struck out more batters than Sánchez as well.
Top Chase Starters, 2024
Name
Team
O-Swing%
O-Contact%
Z-Contact%
SwStr%
K%
Cristopher Sánchez
PHI
39.3%
67.2%
86.5%
11.3%
20.3%
Shota Imanaga
CHC
38.9%
60.0%
83.0%
14.5%
25.1%
Bailey Ober
MIN
37.1%
63.2%
79.7%
14.2%
26.9%
SOURCE: Baseball Info Solutions
I think this is, in part, because Imanaga and Ober are fly ball pitchers whereas Sánchez is a ground-and-pound specialist. Famously, balls hit in the air come with a greater risk of going over the fence than grounders, so the best way for Imanaga and Ober to avoid damage is to miss bats. Sánchez, though, can get away with pitching to contact, which can help to keep his pitch count down and allow him to go deeper in games.
Top Chase Starters, 2024 Batted Ball Data
Name
GB%
FB%
HR/9
K/9
Cristopher Sánchez
57.4%
21.5%
0.54
7.58
Shota Imanaga
37.2%
45.5%
1.40
9.03
Bailey Ober
33.5%
50.3%
1.36
9.62
Considering this, the better comparison for Sánchez is another Dominican lefty with an affinity for the sinker: Framber Valdez. Sánchez doesn’t have the pedigree of the Astros ace, but their arsenals and pitching approaches are similar.
Last season, Valdez threw the changeup in two-strike counts nearly 20% of the time, compared to 13.9% in 2023 and less than 10% of the time in all other prior seasons. Sánchez, meanwhile, threw changeups 51.4% of the time with two strikes last season. This makes plenty of sense, as the pitch generated a healthy 17.8% swinging strike rate.
So perhaps both have something to learn from each other, with Valdez leaning more into the changeup and Sánchez learning from new teammate Jesús Luzardo on his breaking stuff – wouldn’t that be fun? Even more likely, perhaps both are poised to continue frustrating opposing hitters with their bowling ball sinker/change combinations.
Ultimately, for as much love and attention as Valdez has earned at the top of Houston’s rotation, I think it is about time “Chasetopher” catches on and Sánchez gains a bit of respect as an emerging ace.
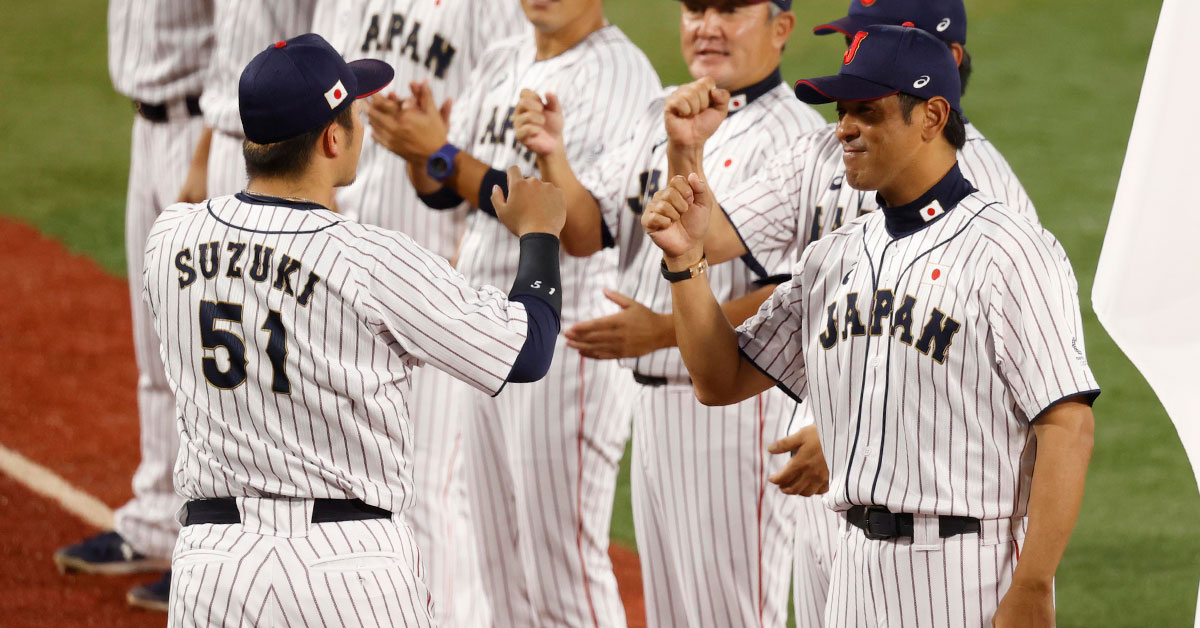
With Japanese outfielder Seiya Suzuki signing with the Chicago Cubs (written about by Kevin Goldsteinhere while Dan Szymborski ran projections on him here), I wanted to compare him to other Japanese position players who have moved to MLB in recent years. The comparisons I made were to the final NPB years of Shohei Ohtani, Yoshitomo Tsutsugo, and Shogo Akiyama. But considering Ohtani was injured in 2017, his stats will be from both the 2016 and 2017 seasons. Data is based on 1.02 – Essence of Baseball public data managed by DELTAGRAPHS.
Comparing Recent Japanese Position Players’ WAR
Player
Year
PA
Batting
Base Running
Fielding
Pos
WAR
Shohei Ohtani
’16
382
33.2
3.4
-0.2
-5.9
4.4
Shohei Ohtani
’17
231
15.9
0.3
0.2
-5.2
1.9
Tsutsugo Yoshitomo
’19
557
23.3
-1.5
-16.7
-9.8
1.3
Shogo Akiyama
’19
678
31.0
2.3
-4.3
4.7
5.6
Seiya Suzuki
’21
533
57.6
-0.4
11.2
-4.4
8.6
Suzuki posted 8.6 WAR in 2021, the best for position player last year. His high WAR is based on great batting value (+57.6 per 500 PA), higher than Ohtani (+43) and twice that of Tsutsugo (+21) and Akiyama (+23). His baserunning value of -0.4 is average in NPB, and his total baserunning value of +1.4 from 2019-2021 is neither good nor bad. Meanwhile, he is a good right fielder, putting up a fielding value of +11.2 (equal UZR). Tsutsugo (-16.7) is a left fielder and Akiyama(-4.3) is a center fielder, so we cannot simply compare them, but I think we can expect better fielding stats than Tsutsugo in MLB. Read the rest of this entry »
Joc Pederson is selling pearls, but is anyone buying? After earning his second World Series ring, your favorite bedazzled outfielder is on the market and could be coming to a city near you.
This past year, Pederson slashed .238/.310/.732 OPS between his stints with the Cubs and Braves, finishing the season with 18 home runs, 61 RBIs, two stolen bases, and an OPS+ of 93. If we dive a bit deeper we can see that despite modest traditional numbers, Baseball Savant has him ranked in the 80th percentile for average exit velocity and the 90th percentile for max exit velocity. His ability to hit the ball hard is nearing an elite level, and though a subpar batting average is certainly not helping his case, his skill at driving the ball may entice a team in need of some lefty power.
Although many fans consider Pederson a clutch postseason hitter, primarily because of his self-proclaimed “Joctober,” his stats looked grim as this postseason winded down. Pederson went 5-for-22 with one bomb in the NLCS, which is not especially great for a postseason power hitter of his caliber. He was worse in the World Series, going 1-for-15 with no homers. Despite having won a pair of championships, “Joctober” seems to have been a classic case of small sample size. His recent performance, or lack thereof, will weigh heavy on the mind of executives and undoubtedly bring down his value. Read the rest of this entry »
Every franchise is looking for that player who seems to come out of nowhere to be a major contributor in their lineup. Players like José Bautista, who went from 1.8 WAR in 2009 to 6.5 WAR in 2010, or Justin Turner, who jumped from 0.5 WAR in 2013 to 3.4 WAR in 2014. The cost for acquiring these players was affordable because they were no longer prospects and most of the league had written them off as potential everyday players.
If a team had the ability to identify which players are most likely to exceed industry expectations, they would have a significant advantage over their competition. That is why I decided to create a model that tries to identify potential breakout performers.
Methodology
The first thing I needed to do was to define what constitutes a breakout performance. I thought of several different definitions, but I decided to define a breakout performance as any player that exceeded their career high WAR in a single season by at least 2.0 WAR. So if a player had recorded a season of 0.0 WAR, they would need to have at least a 2.0 WAR season. If a player had recorded a season of 1.0 WAR, they would need to have at least a 3.0 WAR season and so on and so forth. Read the rest of this entry »
Baseball Savant knows, but they also know it’s useless information. This is precisely why they do not display it. And it’s a shame that they don’t display it.
If they did, it would show that David Fletcher is in the zeroth Percentile for Barrels.
For a quick refresher, Barrels are “a batted ball with the perfect combination of exit velocity and launch angle.” To qualify, a ball must be hit at least 98 mph. For that exit velocity, a launch angle of between 26-30 degrees is required. For every single mph increase, the range of acceptable launch angle degrees increases by two or three, up until 116 mph. At that level, any ball hit between 8-50 launch degrees is considered Barreled.
Fletcher didn’t do that once in 2021. Instead, he mustered eight “close calls” among his 573 batted ball events. Read the rest of this entry »
As the Red Sox move on to the American League Championship Series, the team may not have the talent to contend with teams like the Astros. Some could say the same thing about the Rays, but the Red Sox were fortunate Tampa Bay’s staff was shot after injuries plagued them throughout the season. The Red Sox have All-Stars talents like Rafael Devers, Xander Bogarts, and J.D. Martinez, but they need better role players who provide depth in October if they are truly going to contend each year. Successful teams don’t often undergo a complete rebuild, instead choosing to go through mini-rebuilds and focus on positions of need. This avoids 70-win seasons, something Boston sports fans have not been accustomed to in the last two decades. It is no mystery that they need pitching help, but a more overlooked position of need is at catcher, which could help improve the staff as well.
Boston’s primary catcher and recent hero, Christian Vázquez, has had many memorable moments, none more important than his walk-off home run on Sunday. Despite this, it may be time for the Red Sox to part ways with their veteran. At age 31, Vázquez has shown signs of aging this season, and the Red Sox know this too. In the Wild Card game against the Yankees, the biggest game of the year, the Red Sox turned to backup Kevin Plawecki to get the job done behind the dish. Similarly on Sunday, Plawecki got the start while Vazquez came in to pinch-hit. The Red Sox need to start planning for their long-term future, which means seriously considering their better and younger options at catcher. Read the rest of this entry »