Author Archive

MLB Franchise Four: AL West

Major League Baseball has a campaign asking fans to vote for the four “most impactful” players in their team’s history, with the winners being announced at the 2015 All-Star Game in Cincinnati. A panel of experts created an eight-man ballot for each team. This panel consists of MLB’s Official Historian John Thorn and representatives from MLB’s official statistician (the Elias Sports Bureau), MLB.com, MLB Network, and the Baseball Writers’ Association of America.

“Most impactful” is open to interpretation, which makes this an interesting exercise. It isn’t “best” or “most famous” or “most popular”, but “most impactful.” I decided to look at the eight players on the ballot for each franchise and where they rank in FanGraphs WAR during their time with that franchise.

For each franchise, I’ve listed their top 10 in FanGraphs WAR along with any players who are on the ballot who are below the top 10. The players in BOLD are those who are on the ballot and the years listed are the years in which they played for that team.


Los Angeles Angels (1961-2015)

(1) Nolan Ryan, 47.7 WAR (1972-1979)

(2) Chuck Finley, 44.7 WAR (1986-1999)

(3) Jim Fregosi, 42.6 WAR (1961-1971)

(4) Brian Downing, 36.5 WAR (1978-1990)

(5) Bobby Grich, 35.6 WAR

(6) Tim Salmon, 35.5 WAR (1992-2004, 2006)

(7) Mike Witt, 33.4 WAR

(8) Frank Tanana, 33.2 WAR

(9) Jered Weaver, 32.5 WAR

(10) Mike Trout, 30.3 WAR (2011-2015)

(13) Garret Anderson, 26.2 WAR (1994-2008)

(19) Vladimir Guerrero, 20.2 WAR (2004-2009)


On the ballot: Nolan Ryan played 27 years in the major leagues and eight of those years were with the Angels, during which he averaged almost six WAR per season and over 300 strikeouts per season. He was an All-Star five times with the Angels and is their team leader in career WAR. Ryan is also on the ballot for the Houston Astros and Texas Rangers, for whom he ranks 8th and 17th in WAR, respectively. He seems like a no-doubter for the Angels.

The number two player in career WAR for the Angels is Chuck Finley. While Ryan’s 47.7 WAR for the Angels came in just eight years with the team, it took Finley 14 years to accumulate 44.7 WAR, an average of 3.2 WAR per season. Finley’s best year was in 1993 when he was worth 5 WAR. Along with Ryan and Finley, Jim Fregosi is the only other Angels player with more than 40 WAR with the team, but his career was so long ago that he may not resonate with the voting fans like more recent players such as Tim Salmon, or Garret Anderson, who were teammates on the Angels in the late 1990s and early 2000s. They were both part of the Angels’ 2002 World Series championship team.

Brian Downing is the ultimate hipster—he was down with OBP before it became popular. He was also one of the first players to seriously embrace weight training and one of very few players who wore glasses while playing in the major leagues. He even had those tinted lenses that only the coolest dudes can pull off.

Even though he’s just in his fifth year in the big leagues, Mike Trout should get strong consideration for a spot on the Angels Franchise Four. In his three full seasons he averaged 9.6 WAR per season and had a good case to be AL MVP all three years (he won it last year and finished second the previous two years). He’s signed through 2020 and could replace Nolan Ryan at the top of the Angels’ WAR leaderboard within two or three years.

Finally, Vladimir Guerrero is the least-deserving player on the ballot based on career WAR with the Angels, as he only played six seasons with the team and had his three best seasons with the Expos earlier in his career. In his favor, he did win the 2004 AL MVP Award with the Angels and was a four-time All-Star with the team.

Notable snubs: Poor Bobby Grich. He got no love from Hall of Fame voters (just 2.6% of the vote in his only year on the ballot in 1992) despite being eighth all-time in WAR among second baseman (ahead of Hall of Famers Craig Biggio, Roberto Alomar, Ryne Sandberg, and others). Here, once again, he gets no love in this Franchise Four activity, not even a place on the ballot. Troy Glaus is pretty far down on the Angels’ all-time WAR list (18th place, with 20.7 WAR), but I associate him more strongly with the Angels than I do Vladimir Guerrero.

My Franchise Four: Nolan Ryan, Mike Trout, Tim Salmon, Brian Downing


Houston Astros (1962-2015)

(1) Jeff Bagwell, 80.2 WAR (1991-2005)

(2) Craig Biggio, 65.8 WAR (1988-2007)

(3) Lance Berkman, 51.5 WAR (1999-2010)

(4) Jose Cruz, 47.8 WAR (1975-1987)

(5) Cesar Cedeno, 46.6 WAR

(6) Roy Oswalt, 46.3 WAR

(7) Jimmy Wynn, 38.7 WAR (1963-1973)

(8) Nolan Ryan, 36.4 WAR (1980-1988)

(9) J.R. Richard, 32.2 WAR (1971-1980)

(10) Larry Dierker, 31.8 WAR

(16) Mike Scott, 26.1 WAR (1983-1991) 


On the ballot: Jeff Bagwell and Craig Biggio are easy picks here and it’s hard to think of the two “Killer Bs” without the third “B”, Lance Berkman.

Bagwell played his entire 15 year career with the Astros and finished with 449 career homers and a .297/.408/.540 batting line. He was the 1991 NL Rookie of the Year and the NL MVP for the strike-shortened 1994 season in which he had 104 runs scored, 39 homers, and 116 RBI in just 110 games. He hit .368 that year and had a chance at 50 homers and 150 RBI if not for the labor dispute.

Craig Biggio was also an Astros’ lifer. He had a tremendous 1997 season worth 9.3 WAR when he hit .309/.415/.501 with good defense at second base. He had over 3000 hits in his career and led the league in getting hit by pitches five times.

Lance Berkman played the first 12 years of his career in Houston, then played for three other teams at the end of his career. His best days were with the Astros, though. He had six seasons with 6 or more WAR, including a 7.7 WAR season in 2008 when he hit .312/.420/.567 with 29 homers, 114 runs, 106 RBI, and 18 steals.

For a generation of fans in Houston, Jose Cruz WAS the Houston Astros. I don’t think you can have a Franchise Four without Jose Cruz on the Astros. His signature high front leg lift and those colorful uniforms of the 1970s just can’t be forgotten.

A player from the early years in Houston, “They Toy Cannon” Jimmy Winn, was able to hit for great power in the old Astrodome, a very tough park for hitters. He also posted very good on-base percentages when getting on base wasn’t as valued as it is today. He had six seasons with more than 100 walks.

Nolan Ryan spent more years with the Astros than he did with any other team during his long career and was on three Astros playoff teams in the 1980s. His 1987 season was very bizarre. He led the league in ERA at 2.76 and strikeouts with 270 but had a win-loss record of 8-16.

Sadly, J.R. Richard’s career was cut short when he suffered a stroke before a game in 1980. Richard was 30 years old at the time and was coming off a 1979 season during which he struck out 313 batters and finished third in the NL Cy Young voting. When he suffered the stroke in 1980, he was 10-4 with 1.90 ERA. He never again pitched in the major leagues.

The lowest ranking guy on the ballot is Mike Scott, who was the NL Cy Young winner in 1986, then was 2-0 with 2 complete games and a 0.50 ERA against the New York Mets in the NLCS. He was very good that year (8.6 WAR) and good again in 1987 (5.3 WAR), but his overall body of work with the Astros doesn’t compare to the others on the ballot.

Notable snubs: As good as Mike Scott was in 1986, his career contributions to the Houston Astros don’t stand up to what Roy Oswalt did during his career and I’m surprised that Oswalt didn’t make the ballot. Also, Cesar Cedeno was an All-Star four times in a five-year stretch for the Astros from 1972 to 1976.

My Franchise Four: Jeff Bagwell, Craig Biggio, Jose Cruz, Lance Berkman


Oakland Athletics (1901-2015)

(1) Rickey Henderson, 68.6 WAR (1979-1984, 1989-1995, 1998)

(2) Jimmie Foxx, 64.6 WAR (1925-1935)

(3) Eddie Plank, 57.8 WAR

(4) Eddie Collins, 55.9 WAR

(5) Lefty Grove, 54.3 WAR (1925-1933)

(6) Al Simmons, 51.6 WAR (1924-1932, 1940-1941, 1944)

(7) Sal Bando, 47.5 WAR

(8) Reggie Jackson, 45.2 WAR (1967-1975, 1987)

(9) Mark McGwire, 44.4 WAR

(10) Bob Johnson, 44.3 WAR

(26) Catfish Hunter, 27.2 WAR (1965-1974)

(45) Dennis Eckersley, 19.5 WAR (1987-1995)

(57) Rollie Fingers, 15.8 WAR (1968-1976)


On the ballot: The players on the ballot for the Athletics go as far back as Al Simmons to as recent as Rickey Henderson and Dennis Eckersley. Henderson last played for the A’s in 1998, so there’s a lack of very recent players for Athletics’ fans to choose from. This makes for a difficult ballot. Also, all eight players on the ballot had success with other teams along with their stints with the A’s.

I think Rickey Henderson is obvious. He’s the greatest leadoff hitter of all-time and had his most famous seasons with the A’s, like in 1982 when he stole a single-season record 130 bases. Henderson played 14 seasons for Oakland and led the league in steals eight times while with the team. He was also very good at getting on base and hit for surprising power for a leadoff hitter. He came up with the A’s at the young age of 20 in 1979 and played a little more than a half season, then averaged 6.6 WAR per season over the next five years. After spending 4 ½ seasons with the Yankees, Henderson rejoined the A’s in 1989 and had his best season in 1990 when he hit .325/.439/.577 with 119 runs, 28 homers, and 65 steals, good for 10.2 WAR. In his career, Henderson had over 3000 career hits, 2000 career walks, and a .401 lifetime on-base percentage.

Jimmie Foxx and Lefty Grove were both very good with the Athletics but also had good years with the Red Sox. They were teammates on the great A’s teams from 1929 to 1931 that went to three straight World Series and won two of them. Al Simmons was also part of those great A’s teams and had his best years with the Philadelphia Athletics but also played eight years with other teams.

Reggie Jackson was the “straw that stirs the drink” with the New York Yankees, after being part of three straight championship teams in Oakland in the early 1970s. He played more than twice as many games with the A’s as he did with the Yankees but it was his time in New York that earned him the nickname “Mr. October.” Still, it shouldn’t be forgotten that Reggie had five seasons with the A’s that were worth 5.7 or more WAR.

Catfish Hunter was also well-known for his play with the Yankees after being one of the first big free agent signings before the 1975 season, but he was much more successful (and healthy) with the A’s.

The two Athletics’ relievers on the ballot, Dennis Eckersley and Rollie Fingers, both had strong seasons with other teams. Eckersley pitched more years in Oakland but many more innings with the Red Sox because he was a starter early in his career and became a closer with the A’s. In 1992, Eck won the AL Cy Young Award and was the AL MVP. Over the three years from 1989 to 1991, Eckersley amazingly struck out 215 batters and walked just 16 in 207 innings (13.4 K/BB).

Notable snubs: Eddie Collins is fourth on the A’s all-time WAR leaderboard and third on the White Sox’ list. He made the White Sox ballot, but not the A’s. Collins played in four World Series for the A’s and they won three of them. Another old-timer, Eddie Plank, was also part of those four World Series squads and ranks third all-time in WAR for the franchise but is also absent from the ballot.

My Franchise Four: Rickey Henderson, Jimmie Foxx, Lefty Grove, Reggie Jackson


Seattle Mariners (1977-2015) 


(1) Ken Griffey, Jr., 67.6 WAR (1989-1999, 2009-2010)

(2) Edgar Martinez, 65.5 WAR (1987-2004)

(3) Ichiro!, 54.9 WAR (2001-2012)

(4) Felix Hernandez, 47.9 WAR (2005-2015)

(5) Randy Johnson, 45.5 WAR (1989-1998)

(6) Alex Rodriguez, 35.0 WAR

(7) Jamie Moyer, 30.2 WAR (1996-2006)

(8) Mike Moore, 23.5 WAR

(9) Jay Buhner, 22.4 WAR (1988-2001)

(10) Erik Hanson, 22.0 WAR

(11) Alvin Davis, 21.2 WAR (1984-1991)


On the ballot: You can’t argue with any of the eight players on the ballot for the Mariners. The top five should definitely be on the ballot and Jamie Moyer and Jay Buhner were on the first three teams in Mariners history to make the playoffs. Alvin Davis, even though he’s 11th on the Mariners’ all-time WAR list, was “Mr. Mariner” in the 1980s. Those were bleak years and he was the one bright spot on the team at the time, even winning the Rookie of the Year award in 1984.

Ken Griffey, Jr. is automatic and I believe Edgar Martinez is also an easy pick for the Mariners Franchise Four. Griffeyput Seattle baseball on the map. Before he joined the Mariners, the team might as well have been in Siberia. Griffey started with the Mariners as a 19-year-old in 1989, then began a stretch of 10 straight season as an American League All-Star, along with 10 straight Gold Gloves and the 1997 AL MVP Award. He led the AL in home runs in each of his final three seasons with the team and averaged 52 homers and 142 RBI per year in his final four years with the M’s.

Edgar Martinez got a late start to his Major League career because the Mariners foolishly kept him in AAA in 1988 and 1989 while Jim Presley manned third base in Seattle. Edgar hit .363/.467/.517 in 1988 and .345/.457/.522 in 1989 in the Pacific Coast League. Meanwhile, Jim Presley combined to hit .232/.278/.367 with the Mariners over those two seasons. Looking back, it was quite ridiculous. Edgar became a full-time player in 1990 and hit .321/.429/.537 over the next twelve years, which included batting titles in 1992 and 1995. That 1995 season was his best in the bigs. He hit .356/.479/.628 and was worth 7 WAR. He then hit .571/.667/1.000 in the five game American League Divisional Series against the Yankees, which ended with Edgar’s game-winning double in the bottom of the 11th that scored two runs and put the Mariners in the ALCS. It’s perhaps the signature moment in the history of the Seattle Mariners.

Griffey and Edgar may be automatic picks but choosing two out of Ichiro, King Felix, and Randy Johnson will be difficult for Mariners’ fans. Ichiro joined the M’s in 2001 and was the AL Rookie of the Year and AL MVP on a team that won 116 games. This was after the Mariners had lost Ken Griffey, Jr., Alex Rodriguez, and Randy Johnson. Also, Ichiro was an All-Star during his first ten seasons with the team with a .331 average and 224 hits per season from 2001 to 2010.

Randy Johnson (“The Big Unit”) was integral to the first two playoff teams in Mariners’ history when he went 18-2 in 1995 and 20-4 in 1997. In that 1995 season, the Big Unit won the one-game playoff against the Angels to put the Mariners in the post-season, then won two games against the Yankees in the ALDS, including one in relief while pitching on one day’s rest. He has the post-season narrative to promote his case for the Mariners Franchise Four.

King Felix, of course, has been the face of the Mariners for the better part of the last decade and is signed through the 2019 season. He won the AL Cy Young Award in 2010 and was second last year. It will be interesting to see what the fans do here with five very good players competing for four spots.

Most likely, Jamie Moyer, Jay Buhner, and Alvin Davis will be left out in the cold, as they just don’t compare to the top five. They all had great moments with the Mariners and are well remembered by the fans.

Notable snubs: He doesn’t really compare to the top five on this list and Mariner fans have no love for him, but A-Rod had five seasons with five or more WAR with the Mariners early in his career, so he was worth more to the team than Moyer, Buhner, or Davis.

My Franchise Four: Ken Griffey, Jr., Edgar Martinez, Ichiro Suzuki, Randy Johnson


Texas Rangers (1961-2015)

(1) Ivan Rodriguez, 49.4 WAR (1991-2002, 2009)

(2) Rafael Palmeiro, 42.3 WAR (1989-1993, 1999-2003)

(3) Buddy Bell, 34.6 WAR

(4) Jim Sundberg, 31.4 WAR

(5) Juan Gonzalez, 30.2 WAR (1989-1999, 2002-2003)

(6) Toby Harrah, 29.5 WAR

(7) Ian Kinsler, 29.1 WAR

(8) Frank Howard, 27.9 WAR (1965-1972)

(9) Alex Rodriguez, 27.0 WAR

(10) KennyRogers, 25.6 WAR

(11) Michael Young, 24.4 WAR (2000-2012)

(13) Adrian Beltre, 22.4 WAR (2011-2015)

(14) Josh Hamilton, 22.2 WAR (2008-2012)

(17) Nolan Ryan, 21.1 WAR (1989-1993)


On the ballot: Ivan Rodriguez looks like an easy pick for the Rangers Franchise Four. He spent 12 years with the Rangers at the beginning of his career and averaged over 4.0 WAR per season, including five seasons with 5.0 or more WAR. He was the face of the Rangers throughout the 1990s. Not only was he a very good-hitting catcher, he was terrific behind the plate with a rifle for an arm. With the Rangers, he was a 10-time All-Star, 10-time Gold Glove winner, and won the 1999 AL MVP Award when he hit .332/.356/.558 with 35 homers and 113 RBI.

Rafael Palmeiro is second all-time in WAR for the Rangers, but his case will be difficult for the voters. Some will choose him as one of the Rangers Franchise Four based solely on his numbers during two stints with the team, while others will consider other factors and not give him a vote. In 10 years with the Rangers, Palmeiro hit .290/.378/.519 with an average of 32 homers and 104 RBI per season.

Whether they were deserved or not, Juan Gonzalez won two MVP awards with the team. His first came in the 1996 season. He hit 47 home runs and had 144 RBI that year, but FanGraphs has him worth just 3.5 WAR. He won the AL MVP Award again in 1998 when he led the AL with 50 homers and 157 RBI, but even that year he was worth just 4.9 WAR, which was much less than many other players, including Alex Rodriguez, who was worth 7.9 WAR.

When Frank Howard was on the team that would become the Texas Rangers they were called the Washington Nationals. I don’t think he’ll resonate with fans as a Franchise Four candidate of a team whose uniform he barely wore (35 games as a Ranger in 1972).

Other than Nolan Ryan, the other players on the eight-man ballot are more recent. Josh Hamilton is unlikely to get much traction from fans but Michael Young and Adrian Beltre could get significant support, as could Nolan Ryan thanks to his post-playing-career role as team president. Young played 13 years with the Rangers, while Ryan played just five years with the team and Beltre is in the midst of his fifth season with Texas.

Notable snubs: For a generation of Ranger’s fans in the early 1980s, Buddy Bell was the team’s best player and regular All-Star representative. He only played six-and-a-half seasons with the team but had more than 4 WAR in all six full seasons and had three seasons with greater than 6 WAR, in large part due to terrific defense at third base.

My Franchise Four: Ivan Rodriguez, Rafael Palmeiro, Michael Young, Nolan Ryan


Here’s to the Grinders–Week 1

There were a number of great moments for some of baseball’s biggest stars during the first week of the MLB season. Albert Pujols hit his 521st career home run, which tied him for 18th place on the career list with Hall of Famers Ted Williams, Willie McCovey, and Frank Thomas. Mark Buehrle won his 200th career game and is now tied for 113th on the all-time list with Chuck Finley, George Uhle, and Tim Wakefield (wow, Tim Wakefield won 200 games). Alex Rodriguez hit home run #655 and is just five away from the legendary Willie Mays.

But this isn’t about those guys. Those guys get plenty of notice. This is about the lesser-knowns, the guys you’ve never heard of or had forgotten about. These are my guys. They are the scrubs, the journeymen, the players who refuse to hang up their spikes . . . the grinders.

  • San Francisco Giants pitcher Matt Cain’s arm injury opened the door for Chris Heston to get the second start of his major league career. Heston is 27 and debuted with the Giants just last season, so he’s not really a prospect, if he ever was one. He played college baseball at Seminole Community College in Florida and was drafted in the 47th round of the 2007 Major League Draft. He did not sign. When you’re drafted in the 47th round, it’s like the team is telling you, “Hey, we need someone to carry the bats from the clubhouse to the dugout for one of our minor league teams and you look like you might be able to handle that job.” Heston went back to school for another year, then was drafted in the 29th round by the Washington Nationals the following year. When you’re drafted in the 29th round, it’s like the team is telling you, “Hey, we need someone to take up space on one of our minor league rosters so the real prospects can have someone to play against.” Heston chose to go back to school, this time to East Carolina University, and ended up being drafted again, this time in the 12th round. He signed with the Giants and pitched in their minor league system for five years before getting into three games during last year’s Championship run. He pitched a grand total of 5 1/3 innings as part of the team that won the World Series so he has a ring on his finger. No matter what he does for the rest of his major league career, Chris Heston has a World Series ring. In his start on Wednesday, Heston pitched six scoreless innings for his first major league victory.
  • A guy I hadn’t thought of in a few years, and didn’t know was still playing baseball, had a big hit on Wednesday. This player got off to a great start to his major league career, hitting .300/.336/.549 in 70 games in his rookie year of 2005 and was featured on the cover of Sports Illustrated with the caption: “The Natural”. “The Natural” tanked the following year (.260/.293/.449) but rebounded for a 3.3 WAR season in 2007 (.293/.338/.444). Since 2008, he’s had one above average season, two seasons close to replacement level, and four seasons below replacement level. If you haven’t guessed by now, this player is Jeff Francoeur. Jeff Francoeur is a survivor. Just when you think you’ll never hear another thing about Jeff Francoeur, he shows up once again. After hitting .235/.287/.378 in 2012, you might have thought his career would be over. Then when he hit .204/.238/.298 in 2013, it wouldn’t have been a stretch to say a fork was sticking out of his back because surely he was done. And certainly after he had 2 hits in 24 at-bats last year, you would think it was time for him to ride off into the sunset. But he didn’t ride off into the sunset. He signed with baseball’s most pathetic team, the Philadelphia Phillies. On Wednesday, he came to the dish in a scoreless game in the bottom of the sixth and hit a 3-run jack to help the Phillies beat the Red Sox. The only possible conclusion is that Jeff Francoeur is a zombie.
  • In Cincinnati, the Pittsburgh Pirates and Cincinnati Reds played a closely fought ballgame that went to extra innings. The Pirates brought in Radhames Liz to pitch the bottom of the 11th. Liz had been signed as an amateur free agent by the Orioles in 2003 and played three seasons with the O’s from 2007 to 2009 but had major control problems as he walked 6.2 batters per nine innings. He spent the 2009 season in the Padres’ minor league system then pitched in Korea for three years before returning to the states and signed a minor league contract with the Blue Jays before the 2014 season. He pitched at two levels in 2014, then signed a one-year deal with the Pirates. His appearance in the bottom of the 11th inning on Wednesday was his first major league action since 2009. Unfortunately, it did not go well. He started off the inning by getting Brandon Phillips to pop out. He then plunked Zack Cozart. In 2014, Zack Cozart was the worst hitter in all of baseball who had enough plate appearances to qualify for the batting title when he hit .221/.268/.300 (56 wRC+). The last person you’d ever want to hit with a pitch is Zack Cozart, but that’s just what Radhames Liz did. He regained his composure to strike out Matt Dominguez. Of course, Matt Dominguez was the second-worst hitter in all of baseball last year (63 wRC+). It’s kind of amazing that the two worst hitters in baseball last year were batting back-to-back in this situation, but life has those little amazing things happen every now and then. Still, there were two outs and a runner on first and Billy Hamilton was coming to the plate. Billy Hamilton, by the way, was the 13th-worst hitter in all of baseball last year out of the 146 hitters who qualified for the batting title (79 wRC+). Surely, Radhames Liz could get Billy Hamilton out and send this game to the 12th inning, right? No, not right. Not right at all. Radhames Liz walked Billy Hamilton. This is not a particularly easy thing to do because Billy Hamilton does not walk very often (5.7% of the time in his career). Walking Billy Hamilton meant there were now runners on first-and-second and Radhames Liz would have to face Joey Votto, the best hitter on the Reds. Joey Votto singled to right, Zack Cozart scored, and Radhames Liz had single-armedly lost the game for the Pittsburgh Pirates in his first major league action in six years.
  • On Friday, Jerome Williams started for the Philadelphia Phillies against the Washington Nationals. Williams is on the seventh major league team of his career, including three just last season. His best year was his rookie year back in 2003 with the San Francisco Giants when he was worth 2.0 WAR. He hasn’t come close to that performance since. In 2008, he played for the Long Beach Armada of the independent Golden Baseball League (other GBL alums include Mark Prior, Jose Canseco, and Rickey Henderson). In 2010, he played for the Uni-President Lions of Taiwan in the Chinese Professional Baseball League. He was with the Los Angeles Angels from 2011 to 2013 and spent the 2014 season with the Astros, Rangers, and Phillies. In his nine major league seasons, he’s had an ERA under 4.00 just two times. He’s still kicking around, though, and pitched 6 innings while allowing just a single run on five hits in his first start this year.
  • The Tampa Bay Rays are without three-fifths of their projected starting rotation, so they got creative on Friday and started Steven Geltz. Geltz signed with the Los Angeles Angels as an undrafted free agent in 2008 out of the University of Buffalo. It’s highly unlikely for an undrafted free agent to ever making the major leagues. In addition, Geltz is listed as 5’10”, 170 pounds and he’s a right-handed pitcher. Short, right-handed pitchers are a rare breed in major league baseball. Scouts are generally looking for size and projectability when scouting pitchers and this is even more true for right-handed pitchers. It’s easier to be short and slight if you’re a left-handed pitcher slinging breaking balls than if you’re a righty. Geltz doesn’t have a great fastball (averages around 92 mph) but he’s been quite good in 7 seasons in the minor leagues, with a career 3.38 ERA and 1.10 WHIP in 362 minor league innings, while striking out 12 batters per nine innings. He got a cup of coffee with the Angels in 2012 and a Mocha Grande with the Rays last year and has pitched in 15 major league games with a 2.84 ERA, 1.34 WHIP, and 13.5 K/9. All of his previous professional appearances have been as a reliever and he has never faced more than 10 batters in an outing before. So, there he was on the mound to start Friday night’s game against the Marlins. He went two innings, throwing 35 pitches, 25 for strikes, and allowed one run. Not bad. There’s a pretty good chance that this will be the only start of his major league career.

Finally, we have the journiest-journeyman of all the journeymen, Buddy Carlyle:

New York Mets’ reliever Buddy Carlyle was originally drafted by the Cincinnati Reds out of a Nebraska high school in the second round of the 1996 MLB Draft. Then this happened:

  • 1996: Pitched for the Princeton Reds in the Appalachian League
  • 1997: Pitched for the Charleston AlleyCats in the South Atlantic League
  • April 8, 1998: Traded to the San Diego Padres for Marc Kroon.
  • 1998: Pitched for the Chattanooga Lookouts and the Mobile BayBears in the Southern League
  • 1999: Pitched for the Las Vegas Stars in the Pacific Coast League
  • Made his major league debut on August 29, 1999 with the San Diego Padres.
  • 2000: Pitched for the Las Vegas Stars and the San Diego Padres
  • November 3, 2000: Contract was sold to the Hanshin Tigers of Japan’s Nippon Professional Baseball League.
  • 2001 and 2002: Pitched for the Hanshin Tigers
  • December 18, 2002: Signed as a free agent by the Kansas City Royals
  • 2003: Pitched for the Wichita Wranglers of the Texas League and the Omaha Royals of the Pacific Coast League
  • October 15, 2003: Granted free agency
  • December 23, 2003: Signed as a free agent with the New York Yankees
  • 2004: Pitched for the Trenton Thunder of the Eastern League and the Columbus Clippers of the International League
  • October 14, 2004: Granted free agency
  • November 18, 2004: Signed as a free agent by the Los Angeles Dodgers.
  • 2005: Pitched for the Los Angeles Dodgers and the Las Vegas 51s of the Pacific Coast League.
  • December 15, 2005: Signed by the Florida Marlins.
  • 2006: Pitched for the Albuquerque Isotopes of the Pacific Coast League
  • May 18, 2006: Sold to the LG Twins of the Korean Baseball Association
  • December 4, 2006: Invited to spring training by the Atlanta Braves
  • 2007: Pitched for the Richmond Braves of the International League and the Atlanta Braves
  • 2008: Pitched for the Richmond Braves and Atlanta Braves
  • 2009: Pitched for the Atlanta Braves, the Rome Braves of the South Atlantic League, and Gwinnett Braves of the International League
  • October 9, 2009: Granted free agency
  • 2010: Returned to Japan to pitch for the Hokkaido Nippon-Ham Fighters of the Nippon Professional Baseball League.
  • December 2, 2010: Signed a minor league contract with an invitation to spring training with the New York Yankees.
  • 2011: Pitched for the New York Yankees, the Scranton/Wilkes-Barre Yankees of the International League, and the Toros del Este of the Dominican Winter League
  • January 30, 2012: Signed a minor league contract with the Atlanta Braves
  • 2012: Pitched for the Gwinnett Braves of the International League
  • November 3, 2012: Granted free agency
  • December 11, 2012: Signed a minor league contract with the Toronto Blue Jays.
  • 2013: Pitched for the Buffalo Bison of the International League
  • November 5, 2013: Granted free agency
  • February 18, 2014: Signed a minor league contract with the New York Mets
  • 2014: Pitched for the Las Vegas 51s of the Pacific Coast League and the New York Mets
  • November 4, 2014: Granted free agency
  • January 5, 2015: Signed as a free agent with the New York Mets

By my count, this is Buddy Carlyle’s 20th year in professional baseball but only the eighth year in which he pitched in the major leagues. He’s played on 26 teams for 14 different organizations in four different countries. He’s been a Red, an AlleyCat, a Lookout, a BayBear, a Star, a Padre, a Tiger, a Wrangler, a Royal, a Thunder, a Clipper, a Dodger, a 51, an Isotope, a Twin, a Brave, a Ham Fighter, a Yankee, a Toro, a Bison, and a Met.

Before last season, Carlyle had pitched 284.3 major league innings with a 5.13 ERA and 1.39 WHIP, while striking out 7.2 batters per nine and walking 3.4. Last year, at the age of 36, Carlyle found major league success by posting a 1.45 ERA, 0.90 WHIP, 8.1 K/9, and 1.5 BB/9.

On Opening Day this year, the Mets were holding a 3-1 lead heading into the ninth but their closer, Jenrry Mejia, was injured with a sore elbow. Jerry Blevins got the first out of the inning, then Buddy Carlyle came in to get Ryan Zimmerman and Wilson Ramos for his first major league save. He was immediately added to nearly 2,000 fantasy baseball teams on Yahoo by ever-watchful saves scavengers. More importantly, it was a great moment for a guy who just kept plugging away at it all these years. Hat tip, Buddy Carlyle.


The Fans Projections: Pitchers

Previously, I looked at the difference between the Fans projections and the Depth Charts projections for hitters. Now let’s look at the pitchers.

As with the hitters, the Fans projections are much more optimistic than the Depth Charts. Using the raw projections, the following table shows how much more optimistic the Fans are for pitchers. One note: because of the big difference in playing time and role for Tanner Roark, I eliminated him from consideration. The Depth Charts have Roark primarily pitching in relief (61 G, 6 GS, 95 IP), while the Fans have him as a starter (34 G, 29 GS, 184 IP).

For the average starting pitcher, the Fans are projecting eight more innings pitched, a much better ERA and WHIP, slightly more strikeouts, and 0.5 more WAR. Relievers have closer projections from the Fans and the Depth Charts, with the Fans projecting just 0.1 more WAR for the average reliever. For the entire set of pitchers, the Fans are projecting a 3.47 ERA and 1.21 WHIP, while the Depth Charts check in at 3.71 and 1.25.

The overall totals are useful to get a big-picture view, but the distribution of WAR can also be interesting. The graph below shows the difference between the Fans projected WAR and the Depth Charts projected WAR for starting pitchers in increments of WAR from -0.8 to 1.9. The players on the left are projected by the Fans for less WAR than the Depth Charts are projecting. The players on the right are projected for more WAR by the Fans. The black line is at a difference of 0.0 WAR.

The Fans projected more WAR for 80% of the hitters (previous article). It’s even more extreme for the pitchers: 83% of the pitchers are projected by the Fans for more WAR than the Depth Charts are projecting. The pie chart below shows this breakdown.

Again, that’s the big picture for starting pitchers. The individual pitchers at the extremes might be interesting to look at, so we’ll start with the nine pitchers with the biggest NEGATIVE difference between their Fans projection and their Depth Charts projection.

There are some good pitchers on this list. Given that the Fans project 83% of pitchers to have a higher WAR than the Depth Charts are projecting, it’s surprising to see Max Scherzer, Jose Fernandez, Hisashi Iwakuma, and Francisco Liriano on this list of starting pitchers the Fans like the least. In most cases, the Fans are projecting a better ERA than FIP and, because FanGraphs WAR is FIP-based, this explains some of the difference in WAR. Also, the Fans are projecting significantly fewer innings than the Depth Charts for some of these pitchers, which reduces their WAR.

Notes:

  • The Fans like Masahiro Tanaka to perform well when he’s on the mound (3.14 FIP versus 3.37 FIP projected by the Depth Charts) but project him for 46 fewer innings than the Depth Charts are projecting, which accounts for his lower projected WAR.
  • Max Scherzer is projected by the Fans for five more innings than the Depth Charts, but with a higher FIP, at 2.96 to 2.78, and a higher BABIP that results in a higher WHIP (1.12 to 1.07). He’s still the eighth-best starting pitcher per the Fans, while the Depth Charts have him at #5 among starters in WAR.
  • Francisco Liriano is similar to Scherzer in that the Fans are in agreement on the number of innings pitched but project Liriano for a higher FIP (3.54 to 3.29) than the Depth Charts.
  • Jose Fernandez and CC Sabathia are projected for fewer innings by the Fans than the Depth Charts. In the case of Sabathia, the deficit is 53 innings. As for production, the Fans and Depth Charts projections are quite similar for CC: 4.18 ERA, 3.93 FIP, 1.26 WHIP for the Fans, 4.12 ERA, 3.96 FIP, 1.26 WHP for the Depth Charts.
  • After dropping his BB/9 to a microscopic 0.7 in 2014, the Fans and the Depth Charts both see regression in this area for Phil Hughes. The Fans expect Hughes’ BB/9 to more than double, from 0.7 to 1.6, while the Depth Charts expect Hughes to hold on to some of those gains, projecting a 1.2 BB/9. Hughes is projected for a very similar number of innings, but his higher FIP projection by the Fans results in a -0.6 WAR difference between the two sources.
  • For John Lackey, the main difference in his Fans projection and his Depth Chart projection is a higher BB/9 (2.3 to 2.0). His career mark is 2.6, but he’s been better than that in each of the last two years (1.9 BB/9 in 2013, 2.1 BB/9 in 2014).
  • Finally, the Fans are most pessimistic about James Shields, despite his move to Petco Park, also known as Pitchers Paradise (by me, I just made that name up, you’re welcome.). The Depth Charts project Shields for a higher strikeout rate (8.1 K/9 to 7.6 K/9) and to have fewer fly balls leave the yard (0.7 HR/9 to 0.9 HR/9). The result is a difference in FIP in favor of the Depth Charts (3.23 FIP to 3.47) and a 0.8 difference in WAR. Among starting pitchers, Shields is ranked 16th in WAR by the Depth Charts but 56th by the Fans.


On the other end of the spectrum, there are 21 starting pitchers for whom the Fans project a WAR that is at least 1.0 greater than the Depth Charts are projecting, with Jesse Hahn leading the way with a difference of 1.9 WAR. Here are the top 10 starting pitchers based on the greatest difference in their Fans projection and their Depth Charts projection.

All ten of these pitchers are projected for more innings and a better FIP by the Fans than by the Depth Charts. Many of these pitchers are younger pitchers or pitchers with only a year or two of major league experience.

Notes:

  • The leader in the clubhouse is Jesse Hahn, projected for 1.9 more WAR by the Fans than the Depth Charts. Their innings projections are close, just a difference of 10, but the Fans expect Hahn to post a 3.27 FIP compared to the 4.25 mark projected by the Depth Charts. The Fans project a better strikeout rate, better walk rate, and lower home run rate. In 163 1/3 minor league innings, Jesse Hahn struck out 8.8 batters per nine innings. His K/9 was 8.6 in 73 1/3 major league innings last year. The fans are projecting more of the same, with a K/9 of 8.5. The Depth Charts see major regression, pegging Hahn for a 6.7 K/9.
  • Cliff Lee is projected for 180 innings by the Fans and 106 by the Depth Charts. It looks like there’s a good chance he won’t achieve either mark in 2015.
  • Drew Smyly is projected for significantly more innings by the Fans, along with a better FIP (3.41 to 3.63).
  • The Mookie Betts of starting pitchers? That would be Carlos Carrasco. Carrasco’s projection for 4.2 WAR by the Fans ranks him 9th among all SPs, while the Depth Charts have him 28th. The Fans project Carrasco for a much higher K/9 (9.3 to 8.5) and a lower walk rate (2.2 BB/9 versus 2.6 BB/9), along with 29 more innings pitched.
  • If you compare the strikeout and walk rate projections by the Fans for Nathan Eovaldi to his career strikeout and walk rates, it’s easy to see that they are quite optimistic for Eovaldi in 2015. The Fans project Eovaldi for a 7.0 K/9 versus a 6.3 career K/9 and a 2.3 BB/9 versus a career 2.9 mark. That gives him a forecasted 3.58 FIP. The Depth Charts have him with a 4.25 FIP and less than half as much WAR.
  • Jake Odorizzi had a strong 2014 season and the Fans are optimistic that he can do it again in 2015.
  • Jacob deGrom had a big jump in his strikeout rate after moving up to the big leagues last year. In 323 1/3 minor league innings, deGrom has a career 7.4 K/9, and his best single-season mark in the minor was 7.8 K/9 in 2012. Then he came up to the major leagues last year and struck out 9.2 batters per nine in 140 1/3 innings. The Fans are projecting deGrom for a K/9 of 8.8, while the Depth Charts have him down at 8.2. The difference in FIP is 3.03 for the Fans and 3.40 for the Depth Charts, which produces an overall WAR difference of 1.3. deGrom is ranked 58th among starting pitchers in WAR based on his Depth Chart projection but is 32nd based on the Fans projections.
  • Both the Fans and the Depth Charts like Jordan Zimmermann quite a bit. The Depth Charts projection has Zimmermann with 3.4 WAR, which ranks him 12th among starting pitchers. The Fans projected WAR of 4.7 moves Zimmerman up to 6th.

Well wrap this up with a look at the individual relief pitchers at the extremes. First are the relief pitchers who are projected for much less WAR by the Fans than the Depth Charts.

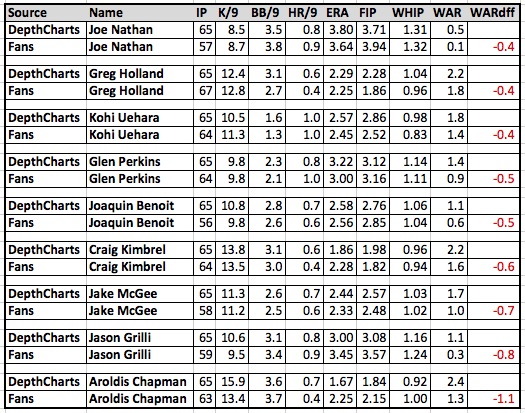
The three relievers who might be the top three closers in baseball are on this list, which is surprising (Aroldis Chapman, Craig Kimbrel, Greg Holland).

  • Aroldis Chapman is projected for a 2.15 FIP but even that can’t compare to the 1.84 FIP projected by the Depth Charts. The Fans also project Chapman to have a 13.4 K/9 versus a 15.9 K/9 projected by the Depth Charts. The end result is a difference of 1.1 WAR, with the Depth Charts placing Chapman 1st in WAR among relief pitchers and the Fans projecting him 9th.
  • When it comes to Greg Holland, Craig Kimbrel, and Koji Uehara, I’m not sure what is going on with their WAR projection from the Fans. Holland, Kimbrel, and Uehara are all projected for better FIPs by the Fans than the Depth Charts, and similar innings pitched, but less WAR.
  • Jake McGee’s lower WAR projection is in part due to eight fewer innings being projected by the Fans.

Finally, we’ll look at the relievers with the most favorable difference in WAR based on the Fans projections versus the Depth Charts projections.

  • Aaron Sanchez is very popular this spring. He was terrific in 33 innings out of the bullpen last year (1.09 ERA, 2.80 FIP). The Fans project him for a 3.36 FIP in 129 innings (43 games, 16 starts), while the Depth Charts are not so optimistic, with a 4.53 projected FIP in 111 innings (56 games, 11 starts). This combination of better pitching in more innings results in a difference of 1.9 WAR, tops among all relief pitchers.
  • Yusmeiro Petit is similar to Sanchez, projected to have a better FIP (3.07 to 3.30) and more innings pitched (131 to 92) by the Fans.
  • A couple of Seattle Mariners pitchers, Dominic Leone and Danny Farquhar, make this list based on their projection for many more innings by the Fans versus the Depth Charts. This is also true for Chase Whitley, Tony Watson, Jake Diekman, and Justin Wilson.
  • The Fans projection for Jeurys Familia is closer to the Depth Charts projection for innings pitched (61 to 55), but the Fans project Familia to have a 2.97 FIP versus a 3.50 FIP projected by the Depth Charts.


The Fans Versus the Depth Charts

By now it’s common knowledge that the projections created by the Fans here at FanGraphs are much more optimistic than Steamer or ZiPS or the combination of Steamer and ZiPS used in the Depth Charts. Of course, this isn’t totally fair because of the difference in projected playing time. The Fans project more playing time for most players so those players will generally be projected for more WAR. The Depth Charts can be altered at any time by the people behind the curtain to reflect current injuries or changes in playing time estimates, while the Fans projections have been coming in for the last couple months and don’t accurately reflect recent changes in expected playing time. Still, I thought it would be interesting to look at the Fans versus the Depth Charts to highlight the players with the largest difference in WAR when comparing the two. This information is from Friday the 13th, so the Depth Charts may have had some changes since then. There are 326 players with projections from the Fans and the Depth Charts.

To get this party started, consider the graph below. This graph shows the difference between the Fans projected WAR and the Depth Charts projected WAR for each player in increment of WAR from -1.0 to 2.6. The players on the far left, at -1.0 WAR, are projected for 1.0 less WAR by the Fans than the Depth Charts. The thick line above 0.0 is the dividing point between negative WAR and positive WAR. There were 19 players projected for the same WAR by the Fans and the Depth Charts.

This shows very clearly that the majority of players are projected by the Fans to have more WAR than the Depth Charts are projecting for that player. Can you guess the identity of the player on the far right, the guy who is projected for 2.6 more WAR by the Fans? He’s a FanGraphs’ favorite. It’s *Mookie Betts! A little to his left, at 2.2 more WAR, is Steven Souza. On the other end, the two hitters projected for 1.0 less WAR by the Fans are Mark Trumbo and Drew Stubbs.

*Mookie Betts is projected by the Depth Charts to have 371 PA with a .275/.343/.416 batting line. The Fans project him for 633 PA with a .294/.368/.435 line. The Fans also project him to have better fielding and base running numbers.

The pie chart below shows the breakdown of players projected for less WAR, the same WAR, and more WAR by the Fans. As you can see, 80% of the players are projected for more WAR by the Fans than the Depth Charts.

As mentioned above, the Fans project more playing time for most players than the Depth Charts project. The graph below shows the breakdown by plate appearances when comparing the Fans to the Depth Charts.

Again, not surprising. The Fans consistently project more playing time. The breakdown for plate appearances shows that 79% of the players were projected for more plate appearances by the Fans. This matches up well with the WAR projections, as 80% of the players were projected for more WAR by the Fans. Individually, the three players projected for the greatest difference in plate appearances by the Fans are Danny Espinosa (+296), Jon Singleton (+279), and Robbie Grossman (+277). The four players to the extreme in the other direction are Jake Marisnick (-151), Marcus Semien (-151), Maikel Franco (-145), and Brendan Ryan (-130). The Fans don’t expect these four players to get the kind of playing time the Depth Charts are projecting. Just for fun, the players who have the most similar projections for plate appearances are Marcell Ozuna (-2), Nick Franklin (+1), Justin Turner (+1), and J.D. Martinez (+2).

It’s not all about playing time, though. To find out how much of the higher projection of WAR by the Fans is due to playing time and how much is based on actual production on the field, I adjusted the Fans’ WAR projections to the same number of plate appearances being predicted by the Depth Charts and created the following graph and accompanying pie chart.

Even after adjusting to an equivalent number of plate appearances, the Fans are projecting 75% of the players to have more WAR than the Depth Charts are projecting. This shows that the Fans are consistently projecting hitters to perform better. They are also projecting these hitters to be better fielders and base runners than the Depth Charts are projecting. Consider the table below that shows the average line for these hitters based on the Depth Charts and based on the Fans.

The Fans are projecting these players for an average of 49 more plate appearances and a better hitting line across the board, along with better Fld and BsR and about 0.6 more WAR per hitter.

Let’s look at some individual players, starting with the true oddballs: the players the Fans like much LESS than the Depth Charts. These are the adjusted numbers, meaning that the WAR projected by the Fans is adjusted to the number of plate appearances projected by the Depth Charts. These are the players for whom, playing time being equal, the Fans like much less than the Depth Charts.

All nine of these players are projected by the Fans to hit worse than their Depth Charts projection would suggest and six of the nine players are projected to be worse fielders. I’d say the most surprising player on this list would have to be Mike Trout. As good as the Fans believe Trout will be, the Depth Charts like him even more. Based on raw numbers, Trout is projected for 8.6 WAR by the Depth Charts and 8.2 WAR by the Fans, but the raw numbers show Trout projected by the Fans for 686 plate appearances. In the chart above, Trout’s plate appearances are adjusted down to the 644 projected by the Depth Charts, which drops his WAR to 7.7 and creates a difference of -0.9 WAR. The WAR difference can be attributed to a worse projected wOBA (.401 to .411) and worse fielding.

Other notes on these players:


  • The Depth Charts project a .339 wOBA for Mark Trumbo, while the Fans have him at .321. Last year, Trumbo finished with a .308 wOBA. The year before, he was at .322. His career mark is .326 and he’s had a wOBA of .339 or more just once in his four years as a regular (or semi-regular) player. The Fans might end up being more accurate on Trumbo than the Depth Charts.
  • Drew Stubbs has a projected wOBA of .313 by the Fans and .327 by the Depth Charts. He had his best-hitting season last year with a .358 wOBA, all of it Coors Field inflated (.431 wOBA at home, .276 on the road).
  • Torii Hunter will be 85 years old this year (not really) and it looks like the Fans are pegging him for age-related decline, with a projected wOBA of .319 compared to the Depth Charts’ .327. Hunter hasn’t had a wOBA below .330 since 2003. The Fans are also projecting Hunter to be even worse in the field than the Depth Charts expect.


So, what players do the Fans REALLY like? Which players are projected for significantly more WAR by the Fans than the Depth Charts? Again, the following numbers are adjusted, meaning the players’ plate appearance totals are adjusted to their Depth Chart projections. With this adjustment, FanGraphs’ favorite Mookie Betts is not the most-liked player. Instead, Mr. Steven Souza rises to the top, with his former teammate, Michael Taylor, right there with him, and Joc Pederson rounding out this trio of young Fan favorites.

The Fans project all of these players to hit better, field better, and have better (or equal, in the case of Michael Cuddyer) base running numbers than the Depth Charts are projecting. In the case of Michael Taylor, the Fans are VERY optimistic, projecting a .336 wOBA compared to a .290 wOBA expected of the Depth Charts. The numbers for Taylor are based on just five fans, though, so take this with a giant grain of salt.

Eight of these nine players are young, have little major league experience, or both. Michael Cuddyer is the lone veteran. Cuddyer is coming off back-to-back years with wOBAs of .396 and .414. Of course, those seasons were in Colorado, where Cuddyer took full advantage of the park’s friendliness to hitters. Last year, Cuddyer had a .533 wOBA at home and .324 on the road. In 2013, it was a slightly more reasonable .427/.369 split. He will call Citi Field home this year and the Depth Charts are forecasting a .329 wOBA, while the optimistic Fans see Cuddyer posting a .352 mark.

Souza, Taylor, Pederson, Pompey, and Castillo have almost no major league track record to speak of yet the Fans are projecting them all to be above-average players. It’s very likely that these players will be drafted higher than they should be in the fantasy world. Everyone likes the shiny new toy, but young and inexperienced players generally take time to develop into fantasy assets.

Here is the next group of players liked much more by the Fans projections than the Depth Charts (again, adjusted to equal playing time based on the Depth Charts projections):

This group of players has a few with limited major league experience, such as Kevin Kiermaier, Joe Panik, Jose Ramirez, and Jorge Soler, but also includes a few players who have four or more big league seasons under their belts (Kyle Seager, Lorenzo Cain, Francisco Cervelli). Almost all of these players are projected by the Fans to hit, field, and run better the Depth Charts would suggest. One very notable number on this chart is the relative optimism of the Fans for Wil Myers on defense.

Going back to Kyle Seager, the Fans are projecting a career-high wOBA for Seager, at .354. His career mark is .333. He’s increased his wOBA in each year of his major league career, from .306 to .321 to .337 to .346. The Fans see another increase, while the Depth Charts are projecting regression back to his 2013 mark.

Other notes of interest:

  • The Fans project Kiermaier to equal his wOBA from last year’s 108 games with the Rays (.333 last year, projected for .332). The Depth Charts have him at .304.
  • The Fans like Josh Rutledge to be close to his career .312 wOBA (projected for .314), but the Depth Charts have him way down at .284.
  • In less than a half-season of playing time, Joe Panik had a .317 wOBA last year. The Fans have him projected for a .312 wOBA, while the Depth Charts see much more regression, down to a .291 mark.
  • In his two seasons in the bigs, Wil Myers has posted a .357 wOBA and a .275 mark. Of course, he dealt with injuries last year, which likely contributed to that disappointing performance. The Depth Charts are projecting a .329 wOBA for Myers this year, while the Fans have him with a .345 wOBA. Both projections are worse than what Myers did in his rookie year but much better than what he did last year.
  • Soler was crazy-good in 24 games last year (.386 wOBA). The Depth Charts have him regressed down to a .339 wOBA, while the Fans have him projected for a .364 mark.
  • In 785 career plate appearances, Francisco Cervelli has a career .327 wOBA. The Fans are projecting him for more of the same (.325), while the Depth Charts don’t think he’ll come close to that (.300).


Okay, last group. After adjusting to equalize the playing time, the following players are projected for 1.2 more WAR by the Fans than the Depth Charts:

Here we’re starting to see a few bigger names, like Joe Mauer, George Springer and Adam Jones.

  • Joe Mauer has a career .372 wOBA but is coming off a season that saw him with the second-lowest mark of his career, at .322. In the two previous seasons, Mauer had wOBAs of .376 and .383. The Fans are projecting a .357 wOBA, while the Depth Charts are not that optimistic, projecting a .338 mark.
  • George Springer’s career wOBA (.352) is between his 2015 Depth Charts projection (.346) and Fans projection (.366).
  • Adam Jones has reached his 2015 Fans projected wOBA of .355 just once in his career, back in 2012.
  • Jedd Gyorko hit .249/.301/.444 with a .325 wOBA in 2013, then followed that up with a .210/.280/.333 (.275 wOBA) season last year. The Fans see a return to his 2013 glory days (.328 wOBA), while the Depth Charts see improvement (.308 wOBA) but not to the level of two years ago.

The Fans projections are optimistic on most players, but the players listed on the three charts above are the players that the Fans like most of all. Many of them are young with limited major league playing time. It will be interesting to see how accurate the Fans are on these players at the end of the season.


Crowdsourcing Bullpen Roles

With less than a month before Opening Day and fantasy baseball prep ramping up, I thought I’d take a look at bullpen roles for each major-league team. Most leagues still use saves as a category and it’s important to know who’s slated for the closer role, as well as the #2 and #3 guy in each pen if you’re in a large league or a league where every team is scrambling for the guy next-in-line to get those precious saves.

I used eight sources to determine how the fantasy experts are projecting each team’s bullpen. The sources are: FanGraphs Bullpen Report, CBS sports, Rotoworld, MLB.com, ESPN.com, Roster Resources, Fantasy Alarm, and Fox. For each team, I’ve listed their closer, setup guy #1, and setup guy #2, with the number of lists they are on out of the eight sources. I’ve also listed the projected saves for each pitcher based on the FanGraphs Depth Charts.

Locked In Their Roles


Kansas City Royals

Closer: Greg Holland (all 8 sources)

Setup #1: Wade Davis (all 8 sources)

Setup #2: Kelvin Herrera (all 8 sources)


Comment: There’s no question how the Royals’ bullpen is set up, which is not surprising considering how successful they were last season when they rode a tremendous bullpen all the way to the seventh game of the World Series.


FanGraphs Depth Charts: Holland—37, Davis—1, Herrera—1


Philadelphia Phillies

Closer: Jonathan Papelbon (all 8 sources)

Setup #1: Ken Giles (all 8 sources)

Setup #2: Jake Diekman (all 8 sources)


Comment: All eight sources have the Phillies’ pen lineup up as Papelbon, Giles, and Diekman. The one thing to watch for here is if the Phillies can find a taker for Papelbon’s contract. He’s owed $13 million this year and has a vesting option for another $13 million in 2016 if he finishes 55 games this year or 100 games over 2014-2015. If he goes, Giles is the guy to have.


FanGraphs Depth Charts: Papelbon—36, Giles—2, Diekman—2


Atlanta Braves

Closer: Craig Kimbrel (all 8 sources)

Setup #1: Jason Grilli (all 8 sources)

Setup #2: Jim Johnson (7), James Russell (1)


Comment: The Braves are opening a new ballpark in 2017 and Kimbrel is owed $9 million this year, $11 million next year and $13 million in 2017, with a $13 million club option for 2018. Does a team that doesn’t look ready to compete in the next two years really want to spend $20 million on a closer during that time? If Kimbrel gets traded, Grilli is next in line.


FanGraphs Depth Charts: Kimbrel—39, Grilli—2


Two Spots Set, What About That Third?


St. Louis Cardinals

Closer: Trevor Rosenthal (8)

Setup #1: Jordan Walden (8)

Setup #2: Seth Maness (5), Matt Belisle (3)


Comment: Rosenthal and Walden look to have the late-game roles locked in, but the #2 setup guy isn’t as certain. Maness is a ground-ball machine (career 61.5% GB%) with a low strikeout rate (15.9%) but a career 2.66 ERA. He picked up 3 saves last year. Belisle had a 4.87 ERA last year with the Rockies, but is projected to be much better this year (3.52 ERA—FanGraphs Depth Charts).


FanGraphs Depth Charts: Rosenthal—42


Cleveland Indians

Closer: Cody Allen (8)

Setup #1: Bryan Shaw (8)

Setup #2: Scott Atchison (5), Marc Rzepczynski (3)


Comment: It’s Allen and Shaw, with Atchison the most likely second setup guy. Rzepczynski shouldn’t be allowed to face a right-handed hitter with the game on the line. In his career, righties have hit .272/.366/.441 against him.


FanGraphs Depth Charts: Allen—38, Shaw—2, Atchison—2


New York Yankees

Closer: Dellin Betances (8)

Setup #1: Andrew Miller (8)

Setup #2: Adam Warren (5), David Carpenter (3)


Comment: Betances (3.2 WAR) and Miller (2.3 WAR) were two of the top six relievers by FanGraphs WAR last year. The consensus seems to be that Betances will be the closer with Miller the primary setup guy, but the FanGraphs Depth Charts show Betances with 30 saves to Miller’s 11, so he’s not being projected as the slam-dunk closer just yet. Both Warren and Carpenter are solid setup guys.


FanGraphs Depth Charts: Betances—30, Miller—11, Warren—2


Los Angeles Angels of Anaheim

Closer: Huston Street (8)

Setup #1: Joe Smith (8)

Setup #2: Fernando Salas (4), Mike Morin (2) Cesar Ramos (1), Vinnie Pestano (1)


Comment: If/when Huston Street misses a couple weeks with an injury in the middle of the season, Joe Smith will be the guy. After Smith, Fernando Salas has the most experience picking up saves, as he had 24 saves with the Cardinals back in 2011.


FanGraphs Depth Charts: Street—37, Smith—4


San Diego Padres

Closer: Joaquin Benoit (8)

Setup #1: Kevin Quackenbush (7), Dale Thayer (1)

Setup #2: Dale Thayer (5), Shawn Kelley (1), Alex Torres (1), Nick Vincent (1)


Comment: Benoit and Quackenbush both picked up saves after Huston Street was traded last year, but Benoit is clearly the closer going into this season. Thayer had 7 saves for the Padres in 2012. The FanGraphs Depth Charts have Brandon Maurer getting 4 saves and Shawn Kelley with 2, but Quackenbush with zero, which doesn’t seem quite right to me.


FanGraphs Depth Charts: Benoit—37, Maurer—4, Kelley—2


Pittsburgh Pirates

Closer: Mark Melancon (8)

Setup #1: Tony Watson (6), Jared Hughes (1), John Holdzkom (1)

Setup #2: Jared Hughes (3), Tony Watson (2), Antonio Bastardo (2), John Holdzkom (1)


Comment: Watson is considered the top setup guy for Melancon, with Hughes and Holdzkom falling in place behind him. Holdzkom has the sky-high strikeout rate, while Hughes is a ground ball machine (64.6% GB%).


FanGraphs Depth Charts: Melancon—40, Bastardo—2


Seattle Mariners

Closer: Fernando Rodney (8)

Setup #1: Danny Farquhar (6), Yoervis Medina (2)

Setup #2: Yoervis Medina (4), Danny Farquhar (2), Charlie Furbush (1), Tom Wilhelmsen (1)


Comment: After Rodney, it’s either Farquhar or Medina, with Farquhar the more popular choice among the eight sources used here and also the better pitcher statistically. After Rodney, Wilhelmsen has the most experience at closer.


FanGraphs Depth Charts: Rodney—40, Wilhelmsen—4


Detroit Tigers

Closer: Joe Nathan (8)

Setup #1: Joakim Soria (6), Al Alburquerque (1), Ian Krol (1)

Setup #2: Joakim Soria (2), Al Alburquerque (2), Joba Chamberlain (2), Bruce Rondon (2)


Comment: Joe Nathan started to show his age in 2014. His strikeout rate dropped; his walk rate rose, and he had the third-worst ERA of his 16-year career (4.81). His FIP (3.94) and xFIP (4.14) weren’t as bad as his ERA, but they weren’t great either. He’ll be 40 this year. In the long history of baseball, relievers 40 and older have a total of 13 seasons with 20 or more saves and eight seasons with 30 or more. The odds are against Joe Nathan. Joakim Soria is ready to take over should Nathan falter. Al Alburquerque looks to be the #3 guy in this pen. The FanGraphs Depth Charts expect Soria to get plenty of save opportunities this year.


FanGraphs Depth Charts: Nathan—24, Soria—14, Alburquerque—1, Chamberlain—1


Texas Rangers

Closer: Neftali Feliz (8)

Setup #1: Tanner Scheppers (7), Shawn Tolleson (1)

Setup #2: Kyuji Fujikawa (3), Shawn Tolleson (2), Tenner Scheppers (1), Alex Claudio (1), Mendez (1)


Comment: Feliz is the #1 guy going into the season, but his peripheral statistics were ugly last year. He had a 1.99 ERA, with a 4.90 FIP and 4.60 xFIP, thanks to a below-average 6.0 K/9, mediocre 3.1 BB/9, and ugly 1.4 HR/9. He had a BABIP of .176 and LOB% of 100%, neither of which are likely to be repeated. Scheppers was injured for much of the year, as was Fujikawa, but either pitcher could get some save chances if Feliz falters.


FanGraphs Depth Charts: Feliz—33, Tolleson—4


Arizona Diamondbacks

Closer: Addison Reed (8)

Setup #1: Brad Ziegler (7), Evan Marshall (1)

Setup #2: Oliver Perez (5), Evan Marshall (2), Brad Ziegler (1)


Comment: Reed is currently having shoulder problems, but the Diamondbacks’ team site reported that the team is optimistic he’ll be ready for Opening Day. Ziegler is most often named as the top setup guy, with Oliver Perez and Evan Marshall among the possibilities for late inning work. The FanGraphs Depth Charts are all over the place with this bullpen, with nine pitchers projected for at least one save.


FanGraphs Depth Charts: Reed—7, Ziegler—7, Marshall—7, Perez—6, Delgado—5, D. Hudson—4, M. Reynolds—2, Ch. Anderson—1, M. Stites—1, R. Ray—1


Who’s the 8th Inning Guy?


Boston Red Sox

Closer: Koji Uehara (8)

Setup #1: Junichi Tazawa (5), Edward Mujica (3)

Setup #2: Edward Mujica (4), Junichi Tazawa (3), Craig Breslow (1)


Comment: Since becoming a reliever in 2010, Uehara has been terrific. Still, he’ll be 40 years old this year and there’s not much history of 40-year-old relievers racking up high save totals. Tazawa is the favored option after Uehara by the eight sources used here, but Mujica is the guy with a history of getting saves (37 in 2013, 8 in 2014).


FanGraphs Depth Charts: Uehara—36, Tazawa—2, Mujica—2


Oakland Athletics

Closer: Tyler Clippard (8)—injury replacement for Sean Doolittle (DL)

Setup #1: Ryan Cook (5), Eric O’Flaherty (3)

Setup #2: Ryan Cook (3), Eric O’Flaherty (2), Fernando Abad (2), Evan Scribner (1)


Comment: While Doolittle is out the Oakland pen should go Clippard-Cook-O’Flaherty, although three sources have O’Flaherty ahead of Cook. Once Doolittle returns, everyone else gets bumped back a spot.


FanGraphs Depth Charts: Doolittle—28, Clippard—12


Chicago Cubs

Closer: Hector Rondon (8)

Setup #1: Pedro Strop (5), Neil Ramirez (2), Jason Motte (1)

Setup #2: Neil Ramirez (4), Pedro Strop (3), Zac Rosscup (1)


Comment: CBS is the only source that has Motte listed as the first setup guy so, despite his experience as a closer in 2012, it’s much more likely that Strop and Ramirez will be the primary setup guys to Hector Rondon.


FanGraphs Depth Charts: Rondon—40, Strop—3


Washington Nationals

Closer: Drew Storen (8)

Setup #1: Casey Janssen (4), Aaron Barrett (2), Craig Stammen (1), Matt Thornton (1)

Setup #2: Craig Stammen (3), Matt Thornton (2), Aaron Barrett (1), Blevins (1), Tanner Roark (1)


Comment: Janssen has earned 81 saves over the last three years and he’s the favorite to be the primary setup guy here, but his strikeout numbers last season were ugly (5.5 K/9). Barrett looks most likely to jump ahead of Janssen in this pen.


FanGraphs Depth Charts: Storen—43, Janssen—4


Chicago White Sox

Closer: David Robertson (8)

Setup #1: Zach Putnam (4), Jake Petricka (3), Zach Duke (1)

Setup #2: Jake Petricka (4), Zach Duke (3), Nate Jones (1)


Comment: There’s a difference of opinion on who will be the primary setup guy to Robertson in the White Sox’ bullpen. Putnam had 6 saves last year and a 1.98 ERA but a 3.08 FIP and 3.64 xFIP. Petricka had 14 saves last year and a 2.96 ERA but 3.60 FIP and 3.76 xFIP. Duke is projected to get more saves than both Putnam and Petricka by the FanGraphs Depth Charts. They also have Robertson with just 25 projected saves, which seems much too low.

FanGraphs Depth Charts: Robertson—25, Duke—8, Putnam—6


Cincinnati Reds

Closer: Aroldis Chapman (8)

Setup #1: Jumbo Diaz (4), Sam LeCure (3), Sean Marshall (1)

Setup #2: Sam LeCure (4), Burke Badenhop (2), Jumbo Diaz (1), Oscar Villarreal (1)


Comment: The primary setup job is still a question mark here, based on the eight sources. Jumbo Diaz is listed as setup guy #1 by four sources, but LeCure is listed more often as either the primary setup guy or the #2 guy.


FanGraphs Depth Charts: Chapman—39, LeCure—3


Baltimore Orioles

Closer: Zach Britton (8)

Setup #1: Tommy Hunter (4), Darren O’Day (4)

Setup #2: Tommy Hunter (3), Brian Matusz (3), Darren O’Day (2)


Comment: Hunter and O’Day are listed as the primary setup guy by four sources each. Hunter has more experience picking up saves (15 over the last two years), but O’day is the better pitcher.


FanGraphs Depth Charts: Britton—36, O’Day—3, Hunter—1


Miami Marlins

Closer: Steve Cishek (8)

Setup #1: A.J. Ramos (3), Mike Dunn (3), Bryan Morris (2)

Setup #2: A.J. Ramos (5), Mike Dunn (3)


Comment: There isn’t a strong consensus on the setup guy in this pen, but it’s most likely Ramos, then Dunn. Ramos, the right-hander, is most likely to step in if something happens to Cishek.


FanGraphs Depth Charts: Cishek—39, Ramos—1, Dunn—1


Minnesota Twins

Closer: Glen Perkins (8)

Setup #1: Casey Fien (3), Brian Duensing (3), Michael Tonkin (1), Caleb Thielbar (1)

Setup #2: Casey Fien (2), Brian Duensing (2), Ryan Pressly (2), Michael Tonkin (1), Stauffer (1)


Comment: Fien saw his dropout rate drop from 10.6 K/9 in 2013 to 7.3 K/9 in 2014, but he’s the top right-handed setup guy, so he would most likely be the guy to get saves if Perkins is unable to do so for some reason. Duensing is listed as the primary setup guy by three sources. His career 6.1 K/9 and 4.12 ERA suggests he’s not a guy you want to have on your fantasy roster.


FanGraphs Depth Charts: Perkins—34, Fien—1, Thielbar—1


Colorado Rockies

Closer: LaTroy Hawkins (8)

Setup #1: Rex Brothers (4), Adam Ottavino (3), Boone Logan (1)

Setup #2: Rex Brothers (3), Adam Ottavino (2), Boone Logan (2), Tommy Kahnle (1)


Comment: All eight sources have the 42-year-old LaTroy Hawkins listed as the Colorado closer. In the history of baseball, 42-year-old relievers have had more than 15 saves in a season just three times—1965 Hoyt Wilhelm (20), 1997 Dennis Eckersley (36), and 2013 Mariano Rivera (44). Still, Hawkins has been able to keep runs off the board over the last three seasons despite a low strikeout rate. Rex Brothers is listed most often as next in line, with Adam Ottavino also in the mix. The FanGraphs Depth Charts have eight pitchers projected for at least one save.


FanGraphs Depth Charts: Hawkins—6, Brothers—6, Ottavino—5, Axford—5, D. Hale—5, B. Logan—3, Bettis—2, J. Diaz—1


San Francisco Giants

Closer: Santiago Casilla (8)

Setup #1: Sergio Romo (4), Jeremy Affeldt (4)

Setup #2: Sergio Romo (4), Jeremy Affeldt (4)


Comment: The sources agree that the top three guys in the Giants’ pen will be Casilla, Romo, and Affeldt. They are not in agreement on whether it’s Romo or Affeldt as the primary setup guy. Romo has the closer experience, though, so he should be your handcuff with Casilla in leagues where backup closers are rostered.


FanGraphs Depth Charts: Casilla—14, Romo—11, Affeldt—9, J. Lopez—7, Petit—5


Milwaukee Brewers

Closer: Francisco Rodriguez (5), Jon Broxton (2), Rob Wooten (1)

Setup #1: Jon Broxton (6), Jim Henderson (1), Will Smith (1)

Setup #2: Will Smith (6), Tyler Thornburg (1), Brandon Kintzler (1)


Comment: This isn’t as uncertain as it looks. K-Rod is the closer. The Brewers wouldn’t have signed him if he weren’t going to close. He’s still in the process of obtaining his work visa and the hope is that he gets to camp by the end of the week. For now, MLB.com has Rob Wooten listed as the closer, and ESPN.com and Fantasy Alarm both have Broxton listed as the closer. The reality is that the late inning pitchers for the Brewer will be K-Rod, Broxton, and Will Smith.


FanGraphs Depth Charts: Broxton—4


Toronto Blue Jays

Closer: Brett Cecil (6), Aaron Sanchez (1), Steve Delabar (1)

Setup #1: Aaron Loup (5), Aaron Sanchez (2), Brett Cecil (1)

Setup #2: Steve Delabar (4), Aaron Loup (2), Aaron Sanchez (1), Brett Cecil (1), Steve Delabar (1)


Comment: Cecil has been a very good reliever over the last two years and is expected by the majority of these eight sources to be the main man for saves in 2015. Aaron Sanchez is a terrific young pitcher who may get bumped to the bullpen if there’s no room for him in the rotation. Loup is a setup guy with a mediocre strikeout rate. Delabar was great in 2012 and 2013 but really bad last year. Fox has him listed as the Blue Jays’ closer at the moment, but I would say that’s not bloody likely.


FanGraphs Depth Charts: Cecil—37, Loup—4


Messy Closer Situations


Los Angeles Dodgers

Closer: Joel Peralta (6), Brandon League (2)—filling in for Kenley Jansen (DL)

Setup #1: Brandon League (3), Joel Peralta (2), Pedro Baez (2), J.P. Howell (1)

Setup #2: Pedro Baez (3), J.P. Howell (3), Brandon League (1), Paco Rodriguez (1)


Comment: With Jansen currently out with a foot injury, six of eight sources like Joel Peralta to close for the Dodgers, with Brandon League the choice by the other two. When Jansen comes back, Peralta and League should be the top setup guys. The FanGraphs Depth Charts have saves scattered among six guys with J.P. Howell projected for the most.


FanGraphs Depth Charts: J.P. Howell—8, Jansen—7, Peralta—7, League—6, Baez—3, Paco Rodriguez—2


New York Mets

Closer: Jenrry Mejia (6), Jenrry Mejia/Bobby Parnell (2)

Setup #1: Jeurys Familia (6), Bobby Parnell (2)

Setup #2: Jeurys Familia (2), Vic Black (2), Carlos Torres (2), Josh Edgin (1), Rafael Montero (1)


Comment: Mejia is listed by himself as the closer by six sources and he shares the job with Parnell on the lists of two other sources. Mejia had 28 saves last year. Parnell had 22 the year before and is coming back from an injury hoping to reclaim his job. Right now, the FanGraphs Depth Charts have Mejia projected for 21 saves and Parnell projected for 19, so it’s a difficult situation to judge at the moment. Familia would be the guy who is third in line.


FanGraphs Depth Charts: Mejia—21, Parnell—19, Familia—2


Houston Astros

Closer: Luke Gregerson (5), Chad Qualls (3)

Setup #1: Luke Gregerson (3), Pat Neshek (3), Chad Qualls (2)

Setup #2: Pat Neshek (5), Chad Qualls (2), Josh Fields (1)


Comment: Five of eight sources have Gregerson listed as the Astros’ closer, with the other three putting Qualls in that spot. Qualls was the team’s closer last year and he had 19 saves with a 3.33 ERA. You would think the spot would be his to lose, but Gregerson has been the better pitcher over the years so it’s not hard to understand why most people would expect Gregerson to become the closer. Neshek is most likely third in line and Fields is a longshot.


FanGraphs Depth Charts: Gregerson—26, Qualls—6, Neshek—6


Tampa Bay Rays

Closer: Brad Boxberger (4), Grant Balfour (2), Kevin Jepsen (2)—filling in for Jake McGee (DL)

Setup #1: Brad Boxberger (4), Grant Balfour (3), Kevin Jepsen (1)

Setup #2: Grant Balfour (2), Ernesto Frieri (2), Kevin Jepsen (2), Jeff Beliveau, Kirby Yates (1)


Comment: McGee is likely to miss most or all of April. It’s hard to know who will get saves in the meantime. The majority likes Boxberger, but Balfour and Jepsen both have their backers. Balfour had 12 saves last year and 38 the year before, so he has experience as a closer. Boxberger was very effective last year, striking out 14.5 batters per nine innings, but the Rays may want to keep him in a setup role.


FanGraphs Depth Charts: McGee—38, Boxberger—3, Balfour—1,


Drafting an Injured Hunter Pence

Hunter Pence has been one of baseball’s most durable players since his first full-time season in 2008. Over the last seven years, Pence has never played fewer than 154 games, and he’s coming off a three-year stretch of 160, 162, and 162 games. He is the active leader in consecutive games played, with 382.

Unfortunately, that streak will end when the Giants open their regular season on April 6th in Arizona. Pence was hit by a pitch in a spring training game on Thursday and will be out six-to-eight weeks with a broken arm. Of course, in the real world, the important thing for Pence and the Giants is that he heals quickly and gets back on the field as soon as possible. In the fantasy baseball world, it’s natural to wonder how the injury affects his value on draft day.

One of the reasons Pence has been valuable in fantasy baseball over the years has been his durability. He has played almost every day for the last seven seasons, and this has allowed him to accumulate counting stats even if his rate stats are not elite. He’s not a 30-homer guy, rarely a 20-steals guy, and has only hit over .300 once since 2008. He’ll generally score 80- to 90 runs and drive in around 90. He’s scored 100 or more runs one time. He’s driven in 100 or more runs one time.

Consider his average season since 2008:

159 G, 671 PA, 172 H, 88 R, 24 HR, 89 RBI, 13 SB, .280 AVG

That’s solid across-the-board production but without any of the big, round numbers that are so exciting to see (100 runs, 30 homers, 100 RBI, 20 steals, .300 average). An interesting comparison is Carlos Gonzalez. Gonzalez is an elite player, when healthy. When he’s in the lineup, he’s a top 5 guy. Unfortunately, Gonzalez is often not healthy.

Consider the average season for Carlos Gonzalez since 2008:

109 G, 444 PA, 118 H, 69 R, 19 HR, 65 RBI, 16 SB, .294 AVG

Now let’s look at both Pence and Gonzalez since 2008, per 162 games played:

162 G, 686 PA, 176 H,   90 R, 25 HR, 91 RBI, 14 SB, .280 AVG—Hunter Pence

162 G, 662 PA, 177 H, 103 R, 29 HR, 98 RBI, 24 SB, .294 AVG—Carlos Gonzalez

Given the same amount of playing time, Carlos Gonzalez beats Hunter Pence across the board. Gonzalez is the guy that you can dream on to achieve the big, round numbers mentioned above. In the real world, though, despite his inferior statistics on a per-plate appearance basis, Pence has been the more valuable fantasy outfielder because of his durability.

So, what about 2015? How much does Pence’s broken arm affect his fantasy value?

I created dollar values using composite projections from Fantasy411.com (a combination of 12 sources). These projections are based on a 12-team league with 21 players, including 9 active hitters (no MI or CI), 7 active pitchers (2 SP, 2 RP, 3 P), and 5 bench spots. There were 63 outfielders projected for positive value (a little more than 5 per team). Using these projections, a healthy Hunter Pence is projected for the following stats:

644 PA, 159 H, 81 R, 20 HR, 82 RBI, 12 SB, .270 AVG

This puts him #12 among outfielders, but a dollar more in value would move him as high as ninth and a dollar less would drop him to 15th, so you could say he’s in the 9-15 range when it comes to outfielders. Others in that same range based on these projections are Ryan Braun, Jacoby Ellsbury, Corey Dickerson, Matt Kemp, Justin Upton, and Matt Holliday. With these stats (per this set of projections), Pence would be a late fourth-round pick.

Healthy Hunter Pence

$21

#12 OF (range is from 9 to 15)

Late 4th round

Comparable to: Ryan Braun, Corey Dickerson, Matt Kemp, Justin Upton

This year we know Pence will miss some time. The initial estimates say six to eight weeks until he’s ready to play. Pence seems to me to be the type of guy who will do whatever he can to get back on the field as soon as possible. In fact, I can’t imagine Pence could sit still for five minutes, let alone an entire baseball game. He’s probably going to drive his teammates crazy.

So let’s say Pence misses the month of April. That leaves him with five months of playing time. Some simple math would suggest the injured Pence will get 83% of the playing time a healthy Pence would get, so we’ll pro-rate his projection above to 83% of the playing time:

535 PA, 132 H, 68 R, 17 HR, 68 RBI, 10 SB, .270 AVG—83% of the season

Losing a month of playing time drops Pence’s value into the mid-30s among outfielders, around such players as Brandon Moss, Denard Span, Marcell Ozuna, and Alex Rios.

Injured Hunter Pence (missing one month of the season)

$9

#36 OF (range is from 33 to 39)

Early 13th round

Comparable to: Brandon Moss, Denard Span, Marcell Ozuna, Alex Rios

But wait, there’s more! We know Pence will miss time. It could be a couple weeks, it could be a month, it could be a month-and-a-half. We also know that we can replace him for that time, so we can factor in his replacement to get a better value for Pence. If you drop him all the way down to 83% of his projected stats, he drops too far on your cheat sheet and you’ll never acquire him.

Let’s factor in the value of a replacement outfielder for the time Pence is going stir-crazy on the Giants’ bench. Based on the composite projections from Fantasy411, the first five replacement outfielders are Michael Saunders, Michael Morse, Curtis Granderson, Angel Pagan, and Dexter Fowler. If you combine the stats for these five players and pro-rate them to one month’s worth of playing time, you get the following:

87 PA, 20 H, 11 R, 2 HR, 9 RBI, 2 SB, .258 AVG—Pence one-month replacement

Add this to our “83% of the season” numbers for Pence from above:

535 PA, 132 H, 68 R, 17 HR, 68 RBI, 10 SB, .270 AVG—83% of the season

And we get:

622 PA, 152 H, 78 R, 19 HR, 77 RBI, 12 SB, .268 AVG—Pence + Replacement

This batting line moves Pence back up the rankings. He becomes the #20 outfielder, in the range of Alex Gordon, Nelson Cruz, and Jason Heyward.

Injured Hunter Pence + Replacement Player for One Month

$17

#20 OF (range is from 18 to 23)

6th round

Comparable to: Alex Gordon, Nelson Cruz, Jason Heyward

Of course, your numbers may vary, but the process is the important part. A healthy Hunter Pence is a late 4th-round pick. An injured Hunter Pence with no replacement is an early 13th round pick. An injured Hunter Pence with a replacement player for one month is a mid 6th round pick.

The recent injury to Hunter Pence hurts his value, but he could still be someone to target if other owners shy away from him and he’s still around in the 7th round or later.


K-BB vs. the RotoGraphs Top Starting Pitcher Rankings

Back on January 1, I wrote an article proposing a “quick-and-easy” way to rank starting pitchers for fantasy baseball. The TL; DR (Too Long; Didn’t Read) summary is that you can take the projections of your starting pitchers and rank them by the simple metric “strikeouts minus walks” (K-BB). I also looked at slightly more complex metrics like “strikeouts minus walks minus home runs” (K-BB-HR) and “strikeout rate minus walk rate, divided by games started” (K%-BB%/GS) and both of those had a slightly better correlation, but are not as simple.

The correlation between the starting pitcher rankings based on K-BB and starting pitcher rankings based on dollar values was around 0.80 for each of the last three years.

At the time, I created a list of the top starting pitchers based on Steamer projections, as those were the only readily available projections out there. Now that we’re getting closer to the season, more projections are available. At Fantasy411, they have a downloadable spreadsheet with the composite projections from 12 different providers. It’s a true “wisdom of the crowds” approach.

Using this collection of projections, I ranked the starting pitchers using the very simple K-BB metric and compared those rankings to the consensus rankings for starting pitchers on the updated RotoGraphs Top 300. I downloaded the spreadsheet from the post on February 17th by Paul Sporer where he explained that players not ranked by a writer would get a “last ranked+1” for that particular player. There were 87 starting pitchers ranked in the Top 300. [Note: I would have used K-BB-HR but the composite projections did not have home runs allowed for pitchers]

First off, the correlation between the RotoGraphs Top 300 rankings for these 87 starting pitchers and my rankings based on K-BB came out to 0.81. Also, 46 of the 87 pitchers (53%) were within 12 spots of each other on the two lists, or the equivalent of one round in a 12-team league. Seventy-four of the 87 pitchers (85%) were within 24 spots of each other, the equivalent of two rounds in a 12-team league.

The charts below show the starting pitchers based on the RotoGraphs Top 300, along with their rank by K-BB, the difference between the two, and the composite projection from the Fantasy411 sources for selected pitchers who were off by a significant number of picks. By looking at the projections for these pitchers, we may better understand why the rankings differ so much.

The Top 20:

Most of the pitchers in the top 20 are similarly ranked by the RotoGraphs’ Five and the K-BB method. Just one of these 20 pitchers has a rankings difference that is off by more than 12 (one round in a 12-team league). Carlos Carrasco has the biggest difference in this group of pitchers between his K-BB rank of 44th and his RotoGraphs’ rank of 16th. Carrasco is a popular sleeper. He’s such a popular sleeper that he’s probably no longer a sleeper. I think most people are wide-awake on Carlos Carrasco by this point. The composite projection has Carrasco down for 156 innings in 2015. Steamer projects 163 innings, ZiPS has him for 119, and the optimistic Fans are projecting 191 innings, which is more than Carrasco has pitched in the last two seasons combined.


The Next 20 (21-40)

There are more differences as we move down the list of starting pitchers. Sonny Gray (ranked 25th by RotoGraphs, 47th by K-BB) is an interesting guy to look at. For his career, Gray has a 2.99 ERA and 1.17 WHIP, but his FIP is 3.39, xFIP is 3.34, and SIERA is 3.44. Gray’s ERA and WHIP have been helped by a .277 career BABIP. That’s quite low, but Oakland as a team allowed a .276 BABIP in 2013 (2nd best in baseball) and .272 BABIP in 2014 (tops in baseball). If you expect that to continue, then Gray is probably better ranked by the RotoGraphs Five. Steamer (3.75 ERA, 1.29 WHIP) and ZiPS (3.36 ERA, 1.26 WHIP) are not so optimistic.

Phil Hughes’ impressive ability to limit bases on balls might have him ranked too highly by K-BB.

Andrew Cashner has the second largest difference between his ranking by K-BB (81st) and RotoGraphs (37th) of any pitcher in the RotoGraphs Top 300. Cashner has a history of injuries and he’s on record as saying he’s focusing more on getting quick outs than strikeouts. Over the last two seasons, his K% has been 18.1% and 18.4%. That 18.4% mark last year placed him 80th among pitchers with 120 or more innings. His 5.7% BB% placed him 41st and that was the best BB% of his career. Looking at just strikeouts and walks it’s easy to see why Cashner is ranked by K-BB among pitchers like Matt Cain and Jon Niese rather than Cliff Lee and Zack Wheeler (Cashner is between those two in the RotoGraphs starting pitcher rankings).


The Next 20 (41-60)

Garrett Richards’ composite projection calls for 137 strikeouts in 160 innings, which comes out to a 7.7 K/9. Steamer and ZiPS both project Richards to strike out around 8.2 batters per nine innings. If Richards’ composite projection is upped to a strikeout rate of 8.2 K/9, he would move up to 64th on the K-BB list.

Dallas Keuchel was very successful last year, posting a 2.93 ERA and 1.18 WHIP despite a middling strikeout rate (6.6 K/9). He succeeded last year with a terrific ground ball rate (63.5%) and by allowing far fewer home runs than he had in his first two years in the big leagues. The K-BB metric ranks Keuchel 77th among starting pitchers based on the two things a pitcher has the most control over.

Justin Verlander and Ian Kennedy are the two pitchers with the biggest difference in rankings in favor of K-BB over the RotoGraphs Five rankings and Drew Hutchison and Scott Kazmir are both in the top seven. Verlander is coming off an ugly 4.54 ERA, 1.40 season in which his strikeout rate dropped just below 7.0 K/9 after being around 9 K/9 for the bulk of his career. The composite projection expects his strikeout rate to go back up to 7.7 K/9 and his ERA to come down close to his 2014 FIP of 3.74. With a projection of 208 innings, Verlander is ranked 25th by K-BB, 34 spots ahead of where he’s ranked by the RotoGraphs’ writers. Similarly, Ian Kennedy is ranked 23rd by K-BB and 55th by RotoGraphs. He’s coming off a better year than you might realize, with 9.3 K/9 and a 3.21 FIP, but a 3.63 ERA.


The Final 27 (61-87)

In this final group of pitchers, the guys that K-BB likes much more than the RotoGraphs’ writers include John Lackey, Mike Minor, and A.J. Burnett. It’s possible that Lackey (36 years old) and Burnett (38 years old) were ranked lower by the RotoGraphs’ writers because of expected age-related decline. Also, Burnett had a 4.59 ERA and 1.41 WHIP with the Phillies in 2014. The composite projection may be looking at the 38-year-old Burnett through rose-colored glasses when he’s projected for 195 innings and an ERA below 4.00, but he has pitched an average of 202 innings over the last seven years and had 213 2/3 innings last season. Like Burnett, Minor is coming off a terrible year—4.77 ERA, 1.44 WHIP, which has him ranked 77th by the RotoGraphs Five. As bad as his results were in 2014, Minor’s strikeout rate was in the range of his two previous seasons and his walk rate was only slightly worse than his career mark. After the season he just had he’s a potential buy low candidate based on K-BB.

The three pitchers in this group who are much higher ranked by the RotoGraphs writers are James Paxton (the biggest difference in ranking of all the pitchers on this list), Tanner Roark (4th largest difference), and Henderson Alvarez (5th largest difference). Paxton (143 innings) and Roark (122 innings) have low playing time projections that limit their K-BB value. Henderson Alvarez is projected for a solid 182 innings, but with a projected strikeout rate of just 5.3 K/9 he gets little love from the K-BB metric.

This comparison included all 87 pitchers who were ranked in the RotoGraphs Top 300. The following pitchers are among the top 87 when ranked by K-BB and don’t show up on the RotoGraphs Top 300:


#60 CC Sabathia

#69 Wade Miley

#74 Bartolo Colon

#79 Yovani Gallardo

#81 Bud Norris

#84 Jon Niese

#84 Ricky Nolasco

#86 Trevor Bauer


I plan to revisit this at the end of the year. I’ll compare the RotoGraphs’ rankings and the K-BB rankings for these 87 pitchers to the actual end of season dollar value rankings for starting pitchers in 2015.


When Should You Draft Troy Tulowitzki?

In the fantasy baseball world, Troy Tulowitzki is the Lamborghini that is terrific when it’s on the road but spends too much time in the garage. Since becoming a regular in 2007 (eight years), Tulowitzki has had just three seasons in which he played more than 140 games and none of those seasons were in the last three years. He’ll be 30 years old during the 2015 season, so age is not on his side when it comes to health.

Last year was the most tantalizing and ultimately disappointing season of all. Tulowitzki was off to a tremendous start, hitting .340/.432/.603 through 91 games. He was hitting like a vintage Albert Pujols but at the shortstop position. In a little more than half a season, he accumulated 5.1 WAR and had a career-best 171 wRC+.

Then it happened—the yearly injury. On July 19th, in Pittsburgh, Tulowitzki strained his left hip flexor while running to first base and his season was over. Despite playing just 91 games, Tulowitzki ranked 73rd in Zach Sanders’ End of Season Rankings for 2014. Sanders had Tulowitzki worth $16.08, right in the same ballpark as Ryan Braun ($16.33), Jonathan Lucroy ($16.15), and Jimmy Rollins ($16.01). These rankings were based on a 12-team, 5 x 5 league with one catcher, so Tulowitzki’s placement at 73rd would make him the first pick in the 7th round, despite playing just over half the season. Of course, the pre-season consensus rankings of FanGraph writers had Tulowitzki anywhere from 12th to 20th, so 73rd was a big disappointment.

Over the last three years, Tulowitzki has averaged 88 games and 363 plate appearances per season, with a batting line of .316/.399/.551. You know he’s going to play well, you just don’t know how much he’ll play. So what do you do with Tulo on draft day?

First, let’s look at his injury history.

After a 25-game cup of coffee in 2006, Troy Tulowitzki became a Rockies regular in 2007, playing 155 games as a 22-year-old.

In 2008, Tulowitzki hit the disabled list twice. On April 29th, Tulo was not in the original starting lineup but was put in the game at the last minute when Jeff Baker broke a blood vessel in his throwing hand during pregame warm-ups. He then tore his left quadriceps on a defensive play in the first inning. He came off the DL on June 20th and played regularly until July 5th, when he went back on the DL with a cut hand. During the game on the previous day, Tulowitzki hit his bat against the ground in frustration, only to have the bat shatter and cut the palm of his hand up to his index finger. He would need 16 stitches and miss the next two weeks. With the two injuries limiting him to 101 games, Tulowitzki had the least-productive year of his career, other than the first-year 25 game stint.

In 2009, Tulo played 151 games and had 5.5 WAR, one of six seasons with 5 or more WAR in his career

The 2010 season saw Tulowitzki pick up right where he left off in 2009. Through 62 games, he was hitting .306/.375/.502. Then, on June 17th, he was hit by a pitch from Alex Burnett and fractured his left wrist. The injury kept him out for five weeks but he came back better than ever, hitting .323/.386/.634 after the injury. Despite playing in just 122 games, Tulowitzki had his best season in 2010, accumulating 5.9 WAR.

Tulowitzki played 143 games in 2011. Nothing to see here.

In 2012, Tulo was off to a slow start, hitting just .287/360/.486. On May 30th, he strained his groin while running out a ground ball and his season was over. He played just 47 games that year.

Two years ago, Tulowitzki missed nearly a month in the middle of the season with a fractured rib from diving for a ground ball. He still hit .312/.391/.540 and had 5.4 WAR in 126 games.

Last year, as mentioned above, Tulo was off to his best start ever but his season ended in July because of a strained hip flexor sustained while running to first base.

So, over the last seven years, Tulowitzki has been on the DL six times. Twice he was hurt while running to first base. Twice he was hurt while making a play on defense. And twice he was hurt through what I would call flukes—slamming his bat into the ground and getting hit by a pitch. He’s had a torn quadriceps, strained groin, fractured rib, strained hip flexor, cut hand, and fractured wrist. On the one hand, two of those were flukes and he hasn’t hurt the same body part more than once. On the other hand, the quad, groin, and hip flexor are all lower-body type injuries, which could continue to occur as he gets older.

So how much do you factor in the injury history when considering when to draft Troy Tulowitzki in 2015?

On his player page, Tulo is projected for 525 at-bats by Steamer and 467 by the Fans (23 fan projections). He hasn’t reached either of those totals since 2011. I have projections from other sources that are more conservative with his playing time:

Cairo: 352 AB

ZiPS: 381 AB

Marcel: 410 AB

Davenport: 417 AB

CBS: 466 AB

Average them all together and Tulowitzki is projected for 431 at-bats.

So let’s go to the spreadsheet. I created dollar values using the z-scores method for a 12-team, 5 x 5, one-catcher league and came up with the following.

Scenario #1: If Tulowitzki gets the 525 at-bats projected by Steamer, he would be a first-round pick, right there with Jose Abreu and Paul Goldschmidt. (525 AB, 159 H, 85 R, 28 HR, 91 RBI, 3 SB, .302 AVG).

Scenario #2: If Tulowitzki gets 431 at-bats (the average of the seven sources I’ve collected) and his other numbers are pro-rated to that total, he drops down to around the middle of the 4th round. (431 AB, 131 H, 70 R, 23 HR, 75 RBI, 2 SB, .302 AVG).

Scenario #3: If Tulowitzki gets 314 at-bats (his average over the last three years) and his other numbers are pro-rated to that total, he drops to the 18th round. (314 AB, 95 H, 51 R, 17 HR, 54 RBI, 2 SB, .302 AVG).

But that’s not the whole story because I haven’t factored in an injury replacement. When Tulowitzki gets injured, he usually goes all out and heads to the DL and generally misses significant time. He’s not like an aging Chipper Jones who would play 4 or 5 games a week and would be difficult to replace if you can’t make daily moves.

So let’s factor in an injury replacement for Tulo if he misses some time. I took the average of three “replacement-level” shortstops from my spreadsheet (Jordy Mercer, Wilmer Flores, and Yunel Escobar) and pro-rated them to the amount of time Tulowitzki would miss in the latter two scenarios from above.

Scenario #2, Adjusted:

431 AB, 131 H, 70 R, 23 HR, 75 RBI, 2 SB, .302 AVG—Tulowitzki

94 AB, 24 H, 10 R, 2 HR, 10 RBI, 1 SB, .258 AVG—Jordy Flores Escobar

525 AB, 155 H, 80 R, 25 HR, 85 RBI, 3 SB, .295 AVG—Tulo & Friends

Add in 94 at-bats from a replacement-level shortstop to Tulowitzki’s projected stats, which would bring his total to the 525 at-bats projected by Steamer, and Tulowitzki would drop from the middle of the 1st round to the middle of the 2nd round; still definitely worth having on your team.

Scenario #3, Adjusted:

314 AB, 95 H, 51 R, 17 HR, 54 RBI, 2 SB, .302 AVG—Tulowitzki

211 AB, 54 H, 23 R, 5 HR, 23 RBI, 1 SB, .258 AVG—Jordy Flores Escobar

525 AB, 149 H, 74 R, 22 HR, 77 RBI, 3 SB, .284 AVG—Tulo & Friends

Add in 211 at-bats from a replacement-level shortstop to Tulowitzki’s projected stats, which would bring his total to the 525 at-bats projected by Steamer, and Tulowitzki would drop from the middle of the 1st round to the middle of the 4th round. That’s the somewhat realistic downside risk.

Looking at the three scenarios above, we have:

  • A fully-healthy Tulowitzki is a mid-1st round pick.
  • A somewhat healthy Tulowitzki (using the average of 7 projection sources) plus a replacement-level shortstop used for the time missed and Tulo drops to the middle of the 2nd round.
  • A healthy-as-he’s-been-the-last-three-years Tulowitzki (using an average of his at-bats over the last three years) plus a replacement-level shortstop and Tulo drops to the middle of the 4th round.

In the Rotographs’ Top 300, the five participants had Tulowitzki with an average pick of 29th overall, just one spot behind Ian Desmond. In that Top 300, Zach Sanders had Tulo ranked 75th, which was quite the outlier (the others had Tulo from 15th to 28th). If you remove Sanders’ rankings, Tulowitzki would be the 17th player off the board, which would put him right in line with Scenario #2 from above—the middle of the 2nd round.

Everyone has his own appetite for risk, but I would go ahead and roll the dice on Troy Tulowitzki in 2015.


Competitive Bidding for the All-Star Game?

It was announced recently that the Miami Marlins will host the 2017 All-Star Game, making this the first time the Marlins will host the Midsummer Classic. Fourteen years ago the Marlins were in line to host the 2000 All-Star Game but after their fire sale following their 1997 World Series championship, MLB flipped the game to Atlanta.

Traditionally, the All-Star game has alternated between leagues. The last time the same league hosted back-to-back All-Star Games was 2006-2007, when the game was played in Pittsburgh’s PNC Park then San Francisco’s AT&T Park, both in the National League. Before that, you have to go all the way back to 1950-1951 to find All-Star Games hosted by the same league in back-to-back seasons (the White Sox’ Comiskey Park in 1950, Detroit’s Briggs Stadium in 1951). Awarding the 2017 game to the Marlins means that National League will host the game three years in a row, following Cincinnati this year and San Diego in 2016.

In the case of the Marlins in 2017, it appears that outgoing commissioner Bud Selig had slated the Marlins to get an All-Star Game in the near future after the team recently opened a new ballpark in 2012. Other teams in contention were the Baltimore Orioles, who last hosted the game in 1993, and the Washington Nationals. The Nationals have not hosted a game since their move from Montreal in 2005.

Along with the 2017 All-Star Game announcement, incoming commissioner Rob Manfred had this to say in a recent interview with ESPN’s Jayson Stark: “One of the things that I am going to try to do with the All-Star Games is—and we’ll make some announcements in the relatively short term—I am looking to be in more of a competitive-bidding, Super Bowl-awarding-type mode, as opposed to [saying], ‘You know, I think Chicago is a good idea’”.

The Super Bowl bidding process is quite a thing to behold. In an article in the Minneapolis Star-Tribune from June of last year, the paper listed many of the concessions made by the city to get the Super Bowl. The paper also posted a copy of the NFL’s “Host City Bid Specifications and Requirements”, which is 153 pages long. Among the items in this document:

  • NFL controls 100 percent of the revenues from all ticket sales, including suites, and exclusive access to all club seats.
  • Exclusive, cost-free use of 35,000 parking spaces for gameday parking.
  • Full tax exemption from city, state, and local taxes for tickets sold to the Super Bowl, including the NFL Experience, the NFL Honors show and other NFL Official Events.
  • NFL has the option to install ATMs that accept NFL preferred credit/debit cards in exchange for cash and to cover up other ATMs.
  • Host city is asked to pay all travel and expenses for an optional “familiarization trip” for 180 people in advance of the Super Bowl to inspect the region.
  • NFL requires the usage of three top-quality, 18-hole golf courses in close proximity to one another and greens and cart fees at these three courses must be waived or otherwise provided at no cost to the NFL. (Golf courses in Minneapolis in February? Really?!)
  • NFL requires the reservation of up to two quality bowling venues at no rental cost.

And those are just a few of the request by the NFL. The “competitive-bidding, Super Bowl-awarding-type mode” is great for NFL bigwigs. It’s not surprising that MLB owners would want to get on board this gravy train.

Other sports have their own bidding processes for their showcase events. Notably, FIFA has had numerous scandals associated with the bidding process for the World Cup. Most recently, after awarding the 2018 World Cup to Russia and the 2022 World Cup to Qatar, FIFA had an investigator create a report looking into accusations of impropriety in the World Cup bidding process. They then announced that the report “cleared its integrity and should constitute closure” despite the fact that the 42-page summary of the report identified numerous instances of corruption, collusion, and vote-buying. Even as the chief chair of FIFA’s ethics committee patted himself on the back, the man who created the report, U.S. prosecutor Michael Garcia, claimed that the portrayal of his report was “erroneous and incomplete”.

Of course, the long-standing king of bidding process corruption would be the Olympics. Do a Google search on “corruption in the Olympics bidding process” and numerous articles as far back as 1999 turn up dealing with shenanigans when it comes to awarding the Olympics to cities competing for the honor.

In a 1999 article at the New York Times, the International Olympic Committee (IOC) acknowledged corruption in the Salt Lake City bidding for the 2002 Winter Olympics. Richard Pound, a lawyer who led the IOC investigation said, “We have found evidence of very disappointing conduct by a number of IOC members. Their conduct has been completely contrary to everything the Olympic movement has worked so hard to represent.” HA! That’s quite funny, in hindsight. Rather than clean up the process, things have just grown worse in the last 15 years.

Sure, the Salt Lake City Olympics scandal triggered reform that was supposed to ban gifts and favors to Olympic committee members, but less than a decade later the Olympics were awarded to Sochi (won the bid in 2007, hosted the 2014 Winter Olympics). This article at Salon.com proclaimed the Sochi Olympics the “most corrupt Olympics ever.”

In the case of the NFL, the process for bidding to host the Super Bowl is not necessarily corrupt; it’s just pure greed. Fat cat NFL owners realize there’s no event bigger than the Super Bowl, so they can demand anything they want from prospective host cities. Is it at all surprising that the billionaire baseball owners want in on this action?

Personally, I like that the baseball All-Star Game gets passed around from city to city. In the past 25 years, 24 different MLB teams have hosted the All-Star game (Pittsburgh hosted the game twice, in two different ballparks). In that same time period, just 14 NFL cities have hosted the Super Bowl, with four cities hosting three or more Super Bowls during that stretch. In the 49-year history of the Super Bowl, the game has been played in Miami and New Orleans ten times each, and another seven times in Los Angeles, meaning more than half of the Super Bowl games have been played in just three cities. Of course, the NFL does prefer to have the game played in warm-weather cities, unless you have a dome (Minneapolis, Indianapolis, Detroit) or you are New York (???). Major League Baseball doesn’t have to worry about the weather for the Midsummer Classic.

We’ll have to see what MLB commissioner Rob Manfred has to say about the “competitive-bidding, Super Bowl-awarding-type mode” he’s considering for the All-Star Game. Will there be a mechanism in place so the same city doesn’t host the game every few years? Will cities without major league baseball get a chance to bid for the game? And just how many top-quality, 18-hole golf courses will MLB owners demand?


Changes in WAR from 2000 to 2014 (Part 4)

If you haven’t read Part 1, Part 2, and Part 3, you may want to go back and check them out.

After looking in-depth at 2014 WAR, I thought it would be interesting to compare 2014 WAR with WAR totals from 2002. Baseball scoring has dropped considerably since 2002 and I wondered how this would be reflected in WAR, either at the positional level or the age level or both.

Here is a comparison of hitting statistics from 2002 and 2014:

YEAR R/G AVG OBP SLG wOBA ISO BABIP BB% K%
2002 4.62 .261 .331 .417 .326 .155 .293 8.7% 16.8%
2014 4.07 .251 .314 .386 .310 .135 .299 7.6% 20.4%

Twelve years ago, hitters put up a higher batting averages, on-base percentages, slugging percentages, and isolated slugging. They walked more and struck out less.

But,we pretty much knew this. Did this difference in the level of offense affect the WAR accumulated at each position?

Position Players

The following table shows WAR for each position with 2002 on top and 2014 below.

If we look at the comparison of WAR/600 PA for the premium hitting positions (DH, 1B, RF, LF, 3B), we see that all except third base accumulated more WAR in 2002 than in 2014. On the other end of the fielding spectrum, the key defensive positions (C, SS, 2B, CF) all had more WAR in 2014, when offense was down.

This table shows a comparison of the traditionally offense-oriented positions versus the positions historically known more for their glove work in the two different run-scoring environments of 2002 (4.62 R/G) and 2014 (4.07 R/G).

In 2002, the offense-oriented positions averaged 2.2 WAR/600PA. In 2014, these positions average 1.8 WAR/600 PA. The more defensive-oriented positions averaged 1.9 WAR/600 PA in the higher run-scoring environment and 2.4 WAR/600 PA when runs were more scarce.

This shift of WAR from more hitter-heavy positions to the better fielding positions has been a general trend over the last thirteen years, particularly so in the last four years as run scoring has dropped significantly.

Consider the table below. The column to the far right shows the difference between WAR for the hitting positions and fielding positions each year:

The biggest change has been over the last four years, as run scoring has dropped down below 4.3 runs per game after being in the range of 4.6 to 4.8 runs/game in the 2000s. Teams are getting more WAR/600 PA from the defensive-oriented positions than the bat-first positions. The 2014 season saw the biggest gap in the last thirteen years, with glove-first positions averaging 0.6 more WAR/600 PA than the bat-first positions.

Changing distribution of playing time and WAR based on age

Along with the change in WAR for the hitting positions versus the defense-oriented positions, there has been a shift in WAR and playing time based on age. From 2000 to 2005, position players 33 and older had more plate appearances than players 25 and under. Beginning in 2006, position players 25 and under have had more plate appearances each year than players 33 and older. Since 2010, this difference has accelerated, as the graph below shows:

In 2000, players 33 and older had 40,626 plate appearances and players 25 and under had 38,919. Last year, players 33 and older had dropped to 29,191 plate appearances and players 25 and under were up to 45,439 plate appearances.

Plate Appearances by Age Group
Year 25 & under 33 & older
2000 38,919 40,626
2014 45,439 29,191
Difference 6,520 -11,435

With increasing playing time, players 25 and under have seen their total WAR go up, while WAR for players 33 and older has gone down:

The difference in WAR is not just a playing time difference, though. Older players have not only seen less playing time, they’ve also been less productive, as this graph of WAR/600 PA demonstrates:

In 2000, players 33 and older averaged 1.7 WAR/600 PA, while players 25 and under averaged 1.4 WAR/600 PA. The older group of players maintained their lead until 2003, when the two groups were essentially even. Since then, younger players have out-produced older players. Last year, the gap was 0.5 WAR/600 PA in favor of the younger group of players.

Starting Pitchers

For starting pitchers, there are some differences. Innings pitched by starting pitchers 25 and under have fluctuated quite a bit over the last 15 years. Since 2000, starting pitchers age 25 and under have thrown a high of 10,268 innings (2002) and a low of 6,663 innings (2005). Starting pitchers 33 and older have a narrower range of innings pitched per season, with a very slightly downward trend over the last thirteen years, as shown by this graph:

While their innings pitched has been fairly consistent since 2000, starting pitchers 33 and older have been less productive. The following graph shows the WAR/150 innings pitched for starting pitchers 25 and under compared to those 33 and older. The “33 and older” group has dropped from a high of 2.5 WAR/150 IP in 2000 to a low of 1.2 WAR/150 IP last season.

From 2000 to 2007, pitchers 33 and older were more productive per inning than pitchers 25 and under. Since then, young pitchers have been more productive, except for that 2012 season. The gulf has widened between these two groups over the last two years.

Relief Pitchers

Finally, let’s look at relief pitchers. Since 2000, relief pitchers 33 and older have seen their innings pitch per year rise from around 3,000 in 2000 to a high of 3,951 in 2005, but have steadily dropped since then. In 2014, they pitched a 15-year low of 2,063 innings. Relief pitchers 25 and under saw a sharp increase in innings pitched from 2004 to 2006, and have bounced around a bit since then, but have generally seen a drop in the amount of innings they’ve pitched since then.

When it comes to production, older relief pitchers have followed a different pattern than their counterparts. Position players and starting pitchers 33 and older have seen their production drop (using WAR per playing time), while relief pitchers 33 and over have held steady. Older relievers are pitching fewer innings each year but they are still as productive (and have a slight increase in WAR/50 IP over the last 15 years).

Final Thoughts

Baseball has evolved over the last 15 years from a high-offense, slugging game to a low-offense, pitching-and-defense game and WAR reflects those changes. The offense-oriented positions (1B, RF, LF, 3B) used to accumulate more WAR each season, but no longer do so. Older players were once more likely to sustain their production into their mid-30s, but no longer play as much or as well as they once did at an advanced age.

Looking to the future, we have to wonder what’s to come. Will offense continue to drop or has it bottomed-out and now due for a rebound? Will MLB do something to raise the level offense (adjust the strike zone, perhaps?)? If offense makes a comeback, how will that be reflected by WAR?