Author Archive

The Importance of Hard-Hit Percentage

In some ways, baseball is a simple game. For a hitter, it boils down to: see ball, swing at ball, hit ball hard, jog around bases (the Frankenstein approach). Of course, it’s not really that simple and there are many other variables involved. Still, a simple goal for a hitter would be to hit the ball hard as often as possible. With that in mind, I thought I’d investigate what happens when a batter hits the ball hard on a regular basis.

I took all players with 150 or more plate appearances so far in 2015. All data in this article is through June 14. Using players with more than 150 plate appearances gave me 236 players.

To start off, I looked at the correlation between the old-school statistic of batting average with hard, medium, and soft hit percentage. You may think that players who hit the ball hard more often would have higher batting averages. This is true. The correlation between batting average and hard hit percentage for these 236 players was .18. For both medium and soft hit percentage, the correlation was negative. The more often you hit the ball hard, the higher your batting average. The more often you hit the ball medium or soft, the lower your batting average.

Here is a table that shows the correlation for other metrics:

The statistic that correlates most with hard-hit percentage (Hard%) is Isolated Slugging (ISO), with a correlation of .73. Hitting the ball hard more often leads to getting extra-base hits more often. The top three metrics in the table—ISO, HR/FB, and SLG—are all measures of power and correlate quite nicely with Hard%. The two measures of overall hitting production—wRC+ and wOBA—also score high on this chart.

Both strikeout rate and walk rate correlate positively with Hard%. When you swing hard, you are more likely hit the ball hard and also more likely to miss, so hitters who have a higher Hard% also have higher strikeout rates, in general. Hitting the ball hard also correlates with walking more often. Perhaps pitchers a more careful to hitters who can beat them with one swing of the bat.

Hard% has a positive correlation (0.36) with fly-ball percentage, no correlation with line-drive percentage, and a negative correlation with groundball percentage.

With all of that in mind, I decided to separate hitters into groups based on hard-hit percentage and compare their composite batting lines. Consider the charts below. There’s a great deal of information here, but if you go down the column as Hard% goes down, you can see the effect on other statistics.

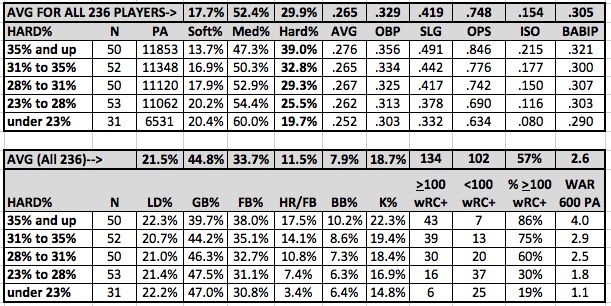
The group of hitters who have a hard-hit percentage of 35% or higher have combined to hit .276/.356/.491. Their .276 batting average is 9 points higher than the next-highest group, their OBP is 22 points higher, and their slugging percentage is 49 points higher. They have a .215 ISO, a solid 10.2% walk rate, and the best HR/FB rate, at 17.5%.

As the hard-hit percentage goes down, the other numbers go down also. By the time you get to the bottom group, those with Hard% below 23%, the composite batting line is .252/.303/.332, with an ISO of .080 and a HR/FB rate of 3.4%. This group strikes out less often than any other group, has the highest rate of soft-hit balls, and the lowest rate of fly balls. These are your typical light-hitting shortstops (Alcides Escobar, Elvis Andrus) and speedy outfielders (Billy Burns, Sam Fuld).

The three wRC+ columns show the number of hitters with a wRC+ at 100 or higher, the number below 100, and the percentage of above-average hitters in each group. For example, 86% of the hitters with Hard% above 35% have been above-average hitters this year, while just 19% of the hitters with Hard% below 23% have been above-average. If you’re not hitting the ball hard with some frequency, you are unlikely to be productive. The break-even point where half the players are above average hitters and half are below is in the range of 27% to 28% hard hit balls.

Let’s take a closer look at these groups.

Diamond Group (35% and higher Hard%)


.276/.356/.491, .321 BABIP

.215 ISO, 17.5% HR/FB

10.2% BB%, 22.3% K%

WAR/600 PA: 4.0

wRC+ >100: 43 players (86%)

wRC+ <100:   7 players (14%)


Best Hitter: Bryce Harper, 216 wRC+

Median Hitter: George Springer, 131 wRC+

Worst Hitter: Matt Kemp, 78 wRC+


  • Top five hitters in this group, by wRC+: Bryce Harper, Paul Goldschmidt, Miguel Cabrera, Mike Trout, Anthony Rizzo.
  • Middle five hitters in this group, by wRC+: Andrew McCutchen, Jose Abreu, George Springer, Adam Lind, Seth Smith.
  • Bottom five hitters in this group, by wRC+: Mark Trumbo, Will Middlebrooks, Matt Adams, Steve Pearce, Matt Kemp.
  • Bryce Harper is the top performing player in this group, hitting .333/.469/.721 with a Hard% of 40.4% and a 216 wRC+. He’s the Hope Diamond of Major League Baseball right now.
  • Giancarlo Stanton has the highest Hard%, at 51%. Stanton’s .341 ISO is second in baseball to Harper’s .388. Stanton’s Hard% is 5% higher than the next-highest player in baseball, Brandon Belt.
  • Nine of the top ten hitters in baseball by wRC+ are in this group (Nelson Cruz missed the cut with a Hard% of 32.9%.
  • The seven below-average performers with a 35% or higher Hard% are Jorge Soler (96 wRC+), Jay Bruce (96 wRC+), Mark Trumbo (93 wRC+), Will Middlebrooks (80 wRC+), Matt Adams (79 wRC+), Steve Pearce (79 wRC+), and the enigmatic Matt Kemp (78 wRC+) bringing up the rear. These players are hitting the ball hard at a high rate but have still been below average hitters.
  • Speaking of Kemp, what is up with this guy? After a bounce-back year in 2014, when he hit 25 home runs in 599 plate appearances, Kemp has just two homers so far in 274 plate appearances. He’s the Robinson Cano of the National League. His 35.4% Hard% isn’t bad, but it’s not as high as last year’s 40.3%. He also pulled the ball more often last year (43.8%) and his ground ball rate is at a career high (48.7%, career rate is 41.9%). He is struggling big time on fastballs after crushing fastballs in 2014. It’s been an ugly start to the year for Kemp, just ask Bud Black.
  • Two players in this group who are very close to a 100 wRC+ are Ryan Howard (100 wRC+ and Pedro Alvarez (104 wRC+). They both have been terrible against left-handed pitchers, having struck out at least 30% of the time against lefties. Also, when they do make contact against southpaws, they aren’t making good contact, with identical 25% Hard% versus lefties.


Quartz Group (31% to 35% Hard%)


.265/.334/.442, .300 BABIP

.177 ISO, 14.1% HR/FB

8.6% BB%, 19.4% K%

WAR/600 PA: 2.9

wRC+ >100: 39 players (75%)

wRC+ <100: 13 players (25%)


Best Hitter: Nelson Cruz, 175 wRC+

Median Hitter: Evan Longoria, 115 wRC+

Worst Hitter: Christian Yelich, 68 wRC+


  • Top five hitters in this group, by wRC+: Nelson Cruz, Mark Teixeira, Andre Ethier, Albert Pujols, Stephen Vogt.
  • Middle five hitters in this group, by wRC+: Danny Espinosa, Carlos Santana, Evan Longoria, Khris Davis, Mark Canha.
  • Bottom five hitters in this group, by wRC+: Justin Maxwell, Luis Valbuena, Robinson Cano, Michael Taylor, Christian Yelich.
  • The magic pixie dust that Nelson Cruz was sprinkled with in April (206 wRC+) and May (188 wRC+) seems to have worn off in June (78 wRC+). His ISO has dropped from .402 to .262 to .000 by month (although he has continued to be fortunate on balls in play with a .393 BABIP in June). He’s also seen a big drop in the percentage of hard hit balls, from 40.6% in April to 30.1% in May to 21.4% this month. This has coincided with a drop in fly ball rate, from 55.1% to 27.4% to 21.4%. Cruz was never going to keep up his torrid early-season pace but he’s also not as bad as he’s looked recently.
  • The player at the bottom of this group, Christian Yelich, has an above average Hard% of 34.2%. Unfortunately, his sky-high ground ball rate (69.1%) and miniscule fly ball rate (15.4%) mean those hard hit balls are not providing much production (68 wRC+).
  • Another player in this group, Luis Valbuena, is having a very peculiar season. He’s hitting the ball hard (31.5% Hard%) and hitting a ton of fly balls (50.3%), which has resulted in 14 home runs in just 234 plate appearances. His career high was set last year when he hit 16 dingers in 547 plate appearances. Valbuena has seen his fly ball rate increase in each of the last three seasons from 35.4% in 2012 to his current rate of just over 50%. That all sounds very good until you look at his ugly .185/.256/.412 batting line, good for an 86 wRC+. With all of those balls flying over the wall for home runs, Valbuena has a .169 BABIP. It’s surprising that a player could hit 14 home runs in 234 plate appearances and be a below-average hitter but Valbuena is doing it.


Apatite Group (28% to 31% Hard%)


.267/.325/.417, .307 BABIP

.150 ISO, 10.8% HR/FB

7.3% BB%, 18.4% K%

WAR/600 PA: 2.5

wRC+ >100: 30 players (60%)

wRC+ <100: 20 players (40%)


Best Hitter: Jason Kipnis, 160 wRC+

Median Hitter: Torii Hunter, 110 wRC+

Worst Hitter: Alexei Ramirez, 51 wRC+


  • Top five hitters in this group, by wRC+: Jason Kipnis, Josh Reddick, Justin Turner, Russell Martin, Brian Dozier.
  • Middle five hitters in this group, by wRC+: Edwin Encarnacion, Trevor Plouffe, Torii Hunter, Daniel Murphy, Brad Miller
  • Bottom five hitters in this group, by wRC+: Aaron Hill, Nick Castellanos, Ryan Zimmerman, Mike Zunino, Alexei Ramirez.
  • Jason Kipnis tops this group of players with a 160 wRC+, 50 points higher than the median player in this group. He’s having his best season. Looking at his numbers, he’s striking out less often than he ever has and has a .375 BABIP that is 68 points higher than his career mark. He’s also hitting fewer fly balls than ever (26.9% FB% compared to a career mark of 30.8%). He’s replaced those fly balls with line drives. His current Hard% almost exactly matches his career rate, but he’s done it in an interesting way. In three of his first four seasons, his Hard% was around 27% (2011, 2012, 2014). In 2013, his Hard% was 35.3%, which would put him up in the elite group (the Diamonds). That 2013 season was his best before this year’s revival. Kipnis is not going to OBP over .400 and likely won’t slug over .500, but he’s looking more like the 2013 version of himself than last year’s colossal disappointment. Maybe this is what a healthy Kipnis looks like.
  • The two players at the very bottom of this group in wRC+ are Mike Zunino and Alexei Ramirez. Zunino just strikes out way too much (36.7% K%). He has power (.159 ISO, 13.0% HR/FB) because he does hit the ball hard, but he doesn’t hit the ball hard often enough to be productive.
  • Alexei Ramirez is actually hitting the ball hard more often than he has in any season in his career. His current 28.4% Hard% is quite a bit higher than his career mark of 23.7%. His batted ball profile hasn’t changed, with a similar rate of line drives, ground balls, and fly balls. He does have the lowest BABIP of his career, at .256 (career mark is .293) and he’s walking at the lowest rate of his career, although he’s never been one to walk much.


Calcite Group (25% to 28% Hard%)


.262/.313/.378, .303 BABIP

.116 ISO, 7.4% HR/FB

6.3% BB%, 16.9% K%

WAR/600 PA: 1.8

wRC+ >100: 16 players (30%)

wRC+ <100: 37 players (70%)


Best Hitter: Mike Moustakas, 133 wRC+

Median Hitter: Jean Segura, 91 wRC+

Worst Hitter: Danny Santana, 42 wRC+


  • Top five hitters in this group, by wRC+: Mike Moustakas, Dustin Pedroia, Brandon Guyer, Cameron Maybin, Rajai Davis.
  • Middle five hitters in this group, by wRC+: Cory Spangenberg, Juan Uribe, Jean Segura, Martin Prado.
  • Bottom five hitters in this group, by wRC+: Dustin Ackley, Lonnie Chisenhall, Chris Owings, Jordy Mercer, Danny Santana.
  • The Bizarro World version of Mike Moustakas tops this group. This is the first time Moustakas has ever been an above average hitter in his major league career, but it doesn’t look like Hard% has much to do with it. His Hard% of 25.6% is right in line with most of his career and close to his career average (last year’s 31.7% is an outlier). The rest of his batted ball profile is quite different, from the lowest fly ball rate and highest ground ball rate of his career, to the direction he’s hitting the baseball. After never hitting the ball to the opposite field more than 22.7% of the time in a season, Moustakas’ 33.3% Oppo% this season is a career high. That may explain some of his elevated .346 BABIP (.270 career mark). He’s also striking out less frequently than he usually does (11.1% K% to 16.1% career mark). On the other hand, looking at his monthly splits throws up a big red flag. Moustakas went opposite field 39% of the time in April, 30.7% of the time in May, and is at 26.3% in June and has seen his wRC+ drop from 170 in April to 112 in May and June (aided by a .368 BABIP in June). Whatever changes he made in April don’t seem to be sticking, as his batted ball locations in June look much more like his career marks than they did in April. This Tiger may be reverting back to his original stripes. It seems strange that he would consciously make that change despite being so effective in April, so it could be that pitchers have adjusted and are pitching him differently.
  • Among this group of 53 players with Hard% between 23% and 28%, Salvador Perez has the most home runs, with ten. This is interesting because Perez has had much higher Hard% rates over the last three years, when his lowest mark was 29.8%. This year, he’s hit fewer hard hit balls but has the highest HR/FB of his career. That doesn’t seem like something that can continue going forward.


Talc Group (23% and below Hard%)


.252/.303/.332, .290 BABIP

.080 ISO, 3.4% HR/FB

6.4% BB%, 14.8% K%

WAR/600 PA: 1.1

wRC+ >100:   6 players (19%)

wRC+ <100: 25 players (81%)


Best Hitter: Nori Aoki, 131 wRC+

Median Hitter: Eric Sogard, 69 wRC+

Worst Hitter: Rene Rivera, 24 wRC+


  • Top five hitters in this group, by wRC+: Nori Aoki, Jacoby Ellsbury, Jose Iglesias, Billy Burns, Dee Gordon.
  • Middle five hitters in this group, by wRC+: Alcides Escobar, Elvis Andrus, Eric Sogard, Freddy Galvis, Jimmy Rollins.
  • Bottom five hitters in this group, by wRC+: Melky Cabrera, Chase Utley, Jose Ramirez, Omar Infante, Rene Rivera.
  • If you aren’t hitting the ball hard on a regular basis, you better find some holes. The top 12 hitters by wRC+ in this group have BABIPs at .311 or higher and the top five are significantly higher than that: Aoki–.344 BABIP, Ellsbury–.379, Iglesias–.367, Burns–.366, Gordon–.418.
  • On the other hand, the players at the bottom of this group in wRC+ are not only struggling to hit the ball hard but also struggling to get those balls to drop in for hits: Utley–.189 BABIP, Jose Ramirez–.205, Infante–.241, Rene Rivera–.198. Of course, this may not stop Infante from starting the All-Star game, but that’s a whole different topic.
  • These players don’t hit home runs, for the most part. Of this group of 31 players, just two have more than four home runs and 25 of the 31 have 0 to 2 home runs.
  • Stephen Drew leads this group with 9 home runs, despite a Hard% of 20.4%. His career rate is 30.6% and he had a 38.8% Hard% in 2013, the last year he was an above average hitter (109 wRC+). In that 2013 season, Drew had a fly ball rate of 41.6%. Drew then went unsigned prior to the 2014 season and missed spring training and the first two months of the year before joining the Red Sox in early June. He appears to be a very different hitter than he’d been before. His Hard% has been 23.2% and 20.1% in 2014 and 2015 after regularly being around 30% in previous seasons. He’s also greatly increased his rate of fly balls, from a consistent 40-42% from 2009 to 2013 to around 50% the last two seasons. Along with the increase in fly balls is an increase in the number of balls he pulls. His career rate is 41.2%. Over the last two seasons he’s pulled the ball over 50% of the time. Along with these changes in batted ball profile, Drew has a .182 BABIP since joining the Red Sox in early June of 2014. It’s hard to believe that missing a half season could result in such a dramatic change in a player’s batted ball profile, but it may have happened to Drew and it’s not a good thing for him.
  • Jimmy Rollins is the other hitter in this group with more than four homers. He currently has seven. His HR/FB rate is 10.6%, which would be the highest he’s had since 2007. Unfortunately, that’s about all he’s done well on offense, as he is hitting .199/.260/.336 (.265 wOBA, 68 wRC+).


A Nightmare Scenario for Pedro Alvarez: Playing for Cleveland

With apologies to Clevelanders everywhere, I can think of a number of reasons why Pedro Alvarez would rather be in Pittsburgh than in Cleveland, or C-Town, or The Mistake on the Lake, whichever you prefer. Pittsburgh is located where the first Europeans reached the “Golden Triangle” at the confluence of the Ohio, the Monongahela, and Allegheny rivers. “Golden Triangle” not only sounds very appealing, in a slightly sexual way, but to my knowledge none of the three rivers confluence-ing in Pittsburgh have been on fire like the Cuyahoga River that runs through Cleveland.

Pittsburgh has regularly finished near the top of lists of “Most Livable City in the U.S.”, including last year when the ‘Burgh narrowly beat out Honolulu for the top spot. It was the third time in seven years that The Economist had Pittsburgh at or near the top of the list of the most livable cities in the continental United States. Cleveland, on the other hand, was named the most miserable city in the United States, according to a 2010 poll by Forbes.com.

So it’s clear the Pedro Alvarez is quite fortunate to be with the Pittsburgh Pirates as opposed to the Cleveland Native Americans, just for the pure livability factor of the city.

When it comes to baseball, this pattern continues. The Pirates are 31-25 (.554) and in second place in the NL Central. Cleveland is 27-29 and in fourth place in the AL Central (all data is through June 7th). According to the playoff odds at FanGraphs, the Pirates currently have a 67.6% chance of winning their division or being a wild card team. The Indians are at 51.5%. If not for the parity of the American League, this gap would be even greater.

More importantly, and the point of this article, there’s something very specific to Pedro Alvarez that makes it fortunate that he’s with Pittsburgh this year and not Cleveland. Pedro Alvarez does not hit well against left-handed pitching. This is not a major revelation. I think most people reading FanGraphs know that Pedro struggles against lefties. In his career, Pedro has hit .193/.263/.315 against lefties, with a walk rate of 8.3% and strikeout rate of 36.7%. Yikes! His wRC+ against lefties in his career is 61. Against right-handed pitchers, Alvarez has hit .248/.321/.474, with an improved walk rate of 9.5%, a much improved strikeout rate of 26.9%, and a 118 wRC+. For reference, based on his career wRC+, Alvarez hits like the 2015 version of Starling Marte (.256/.317/.473 this year) against right-handed pitchers and like the 2015 version of Lonnie Chisenhall (.209/.241/.345 this year) against lefties. Chisenhall was just sent to the minor leagues. Pedro Alvarez, like former Pirate Andy Van Slyke before him, is fortunate that he lives in a predominantly right-handed world.

Adding to the good fortune for Alvarez this season is the limited number of left-handed pitchers the Pirates have faced. The average team in the Major Leagues has had 24.8% of their plate appearances against southpaws. The Pirates have had the lowest percentage of plate appearances against lefties, just 17.5%. That’s more than one standard deviation below the average. The Cleveland Indians are on the opposite side of the coin, having had 38.0% of their plate appearances against lefties, which is more than two standard deviations above the average. Consider the handedness of the starting rotations of the non-Pittsburgh and non-Cleveland teams in the AL Central and NL Central:

The non-Cleveland teams in the AL Central have 12 right-handed starters and eight left-handers (40% lefties) currently in their starting rotations. The non-Pittsburgh teams in the NL Central have 17 righties and just three lefties currently in their starting rotations (15% lefties).

I was curious how big a difference this would make for Pedro Alvarez, so I decided to look at it in two different ways.

For the first scenario, I took Pedro’s batting line against lefties (20 PA) and righties (173 PA) this year. I figured out what percentage of the team’s plate appearances against each type of pitcher Alvarez has had. I then applied those percentages to Alvarez if he were to play on a team that has seen the league average number of lefties and on the Indians, who have seen the most lefties this year. Here are the results:

Alvarez goes from a .244/.316/.453 hitter with the Pirates to a .220/.289/.403 hitter with the Indians. Not only would he be moving from one of the most livable cities in the U.S. to one of the most miserable, his production would take a big hit. He also loses some playing time because the Pirates have limited him against lefties and the Indians and the league-average team have faced fewer righties.

This leads me to the second scenario. The Pirates have rightly limited the number of plate appearances against lefties for Alvarez this year. Just 20 of his 193 plate appearances have been against southpaws. If Alvarez was transplanted to Cleveland, or to a league-average team, perhaps they would also keep Alvarez riding the pine when a lefty is on the mound. In this second scenario, I moved Alvarez to the Indians and to a league-average team and limited his plate appearances against left-handers to his actual number of 20.

If he were limited to 20 plate appearances against lefties, Alvarez would hit similarly well but would lose playing time. In the case of a hypothetical move to Cleveland, Alvarez would have 41 fewer plate appearances, the equivalent of around 11 games based on his current 3.6 plate appearances per game played.

Pedro Alvarez, you are a fortunate man. Not only do you live in a world with many more right-handed pitchers than lefties, but you also play for a team that has seen more right-handers than any other team in baseball. Now go enjoy the spectacular view of Pittsburgh while riding on the Duquesne Incline, then get a Primanti Brothers sandwich and head over to Point State Park near the “Golden Triangle” and enjoy one of the country’s largest fountains on a beautiful Pittsburgh day.

(I feel like I should maybe apologize to any Clevelanders who might be reading this, but I don’t know if they have Internet in Cleveland yet, so it’s probably not necessary.)


Effects of Stats So Far on Depth Charts RoS Projections — Pitchers

Previously, I looked at hitters and how their current in-season performance has changed their rest-of-season projections. Here, I do the same for pitchers.

I limited my analysis to starting pitchers. For starting pitchers, I compared their preseason Depth Charts projections to their rest-of-season Depth Charts projections, then found the five starters with the biggest positive and negative differences in their projected ERA. All statistics are from May 27th.

The Biggest Losers


Adam Warren (+0.29 in ERA)


50.7 IP, 3.91 ERA, 4.54 FIP, 4.42 xFIP, 1.24 WHIP—current

166 IP, 3.81 ERA, 1.28 WHIP—preseason

115 IP, 4.10 ERA, 1.33 WHIP—rest-of-season


Used exclusively as a reliever in 2014, Adam Warren had a career-high 8.7 K/9 and career-low 0.5 HR/9. As a starting pitcher this year, Warren has seen his K/9 drop to 5.7 and his HR/9 go up to 1.1. Even though he has a 3.91 ERA, his 4.54 FIP and 4.42 xFIP explain why his rest-of-season ERA projection has increased by 0.29 from his preseason projection. He’s lost a little more than two miles per hour on his fastball, from 94.2 to 91.9 but has increased the use of the fastball at the expense of his slider and has seen his contact percentage go up from 76% in 2014 to 81% this year. Warren is a good illustration of the difficult transition from reliever to starter. As a reliever, he threw harder and used his slider more and struck out more batters in short stints. As a starter, he’s throwing his slider less, using more two-seam fastballs and generating fewer strikeouts.

Phil Hughes (+0.29)


64.7 IP, 4.59 ERA, 4.60 FIP, 4.16 xFIP, 1.29 WHIP—current

205 IP, 3.66 ERA, 1.15 WHIP—preseason

144 IP, 3.95 ERA, 1.19 WHIP—rest-of-season


Phil Hughes had an unreal 1.9% walk rate last year that was coupled with the best strikeout rate he’s had as a starting pitcher (21.8%). This year, he’s still been quite stingy with the walks (2.2% BB%) but his strikeout rate has dropped to 15.1%, his lowest mark since 2011. The biggest change in his pitch types (per PITCHf/x) has been a dramatic rise in the percentage of two-seam fastballs, from 5.2% last year to 23.9% this year, with a drop in four-seam fastballs (61.8% to 50.2%) and cutters (16.7% to 12.8%). He’s also lost about one mile per hour on his fastball. Batters are making more contact on his pitches and they are doing damage with the long ball, which had long been a problem for Hughes before last season. From 2010 to 2013, Hughes allowed 1.4 HR/9 and had a HR/FB rate of 10.8%. Last season, those numbers dropped to 0.7 HR/9 and 6.2%. This year, he’s back to his old ways, giving up 1.6 HR/9 and a 12.3% HR/FB. Looking at Hughes’ last six years as a starting pitcher, it’s clear that his 2014 season was the aberration.

Matt Garza (+0.29)


57 IP, 6.00 ERA, 5.31 FIP, 4.37 xFIP, 1.58 WHIP—current

185 IP, 3.96 ERA, 1.26 WHIP—preseason

124 IP, 4.25 ERA, 1.32 WHIP—rest-of-season


Garza came into this season with a walk rate consistently in the range of 7.5% over the previous five seasons but has seen that rate jump to 10.5% so far this year. He also may be experiencing age related decline as his strikeout rate is on pace to decline for the fourth straight year right along with his fastball velocity, which has also gradually declined over that time from 93.8 miles per hour in 2011 to 92.5 this year. Like other pitchers in the “biggest losers” category, Garza has had trouble with home runs, giving up 10 so far in 57 innings with a career-high 18.2% HR/FB rate. Last year, pitching for the same team in the same ballpark, Garza allowed just 12 home runs in 163 1/3 innings (7.0% HR/FB). He’s also had trouble stranding runners for the second year in a row (67.5% LOB% this year, 66.6% last year).

R.A. Dickey (+0.28)


64 IP, 5.77 ERA, 5.70 FIP, 4.80 xFIP, 1.33 WHIP—current

209 IP, 4.08 ERA, 1.28 WHIP—preseason

140 IP, 4.36 ERA, 1.33 WHIP—rest-of-season


Dickey’s preseason Depth Charts projection called for a 7.1 K/9, which was reasonable considering he’d been over seven strikeouts per nine in each of the last three seasons. Unfortunately, the knuckleballer has seen his strikeout rate plummet this year. Through 10 starts, he’s at 4.9 K/9. Dickey has also seen his walk rate go up in each of the last three seasons and he’s giving up more homers than he has since establishing himself as an above-average starting pitcher with the Mets in 2010. So, strikeouts down, walks and homers up, that’s a recipe for disaster.

Taijuan Walker (+0.28)


43 IP, 7.33 ERA, 5.48 FIP, 4.84 xFIP, 1.84 WHIP—current

158 IP, 3.98 ERA, 1.30 WHIP—preseason

116 IP, 4.26 ERA, 1.34 WHIP—rest-of-season


Taijuan Walker pitched well in 11 games and 53 innings over his first two partial seasons in the major leagues at 21 and 22 years old (2.89 ERA, 3.28 FIP, 1.21 WHIP). He then ramped up the hype machine with a sterling spring training this year that saw him give up just two runs in 27 innings with 26 strikeouts and five walks. He had a nice projection for a 23-year-old pitcher coming into this season. Unfortunately, he’s been lit up so far in 2015, posting a 7.33 ERA and 1.84 WHIP. His .356 BABIP and 63% LOB% are a big part of the problem, as are the eight home runs allowed in 43 innings (1.7 HR/9, 14.5% HR/FB). His FIP (5.48) and xFIP (4.84) are much better than his actual ERA, but still nothing to be excited about, which is why his rest-of-season projection for ERA is 0.28 higher than it was before the season started.

That 14.5% HR/FB should come down but Walker has also allowed many more fly balls than he did last season, up from 26.2% to 39.0% so he is likely to give up more home runs than he has in the past even with regression in his HR/FB rate. He’s also giving up a higher percentage of hard-hit balls, increasing from 23.8% last year to 34.3% this year. On the bright side, his fastball velocity has stayed at the same level since his rookie year. Walker still has the raw skills to be a good major-league pitcher but a combination of giving up more fly balls and seeing more fly over the fence, along with a below-average left-on-base percentage has really hurt him this season.


The Biggest Winners


Michael Pineda (-0.40)


64.3 IP, 3.36 ERA, 2.54 FIP, 2.52 xFIP, 1.14 WHIP—current

142 IP, 3.74 ERA, 1.20 WHIP—preseason

117 IP, 3.34 ERA, 1.12 WHIP—rest-of-season


Last year, Phil Hughes had the second-lowest walk rate of any pitcher who qualified for the ERA title since 2001. He walked just 1.9% of the batters he faced. Only Carlos Silva in 2005 (1.2%) has had a better rate over the last 15 years. This year, Michael Pineda is walking even fewer batters than Hughes did last year, allowing just 1.7% of the batters he’s faced to reach via the base on balls. Pineda has the added bonus of a 25% strikeout rate to go with that miniscule walk rate. Along with elite strikeout and walk rates, Pineda has added the ability to induce groundballs to his arsenal. He came into this year with a career groundball rate of 37.2%. This year, his groundball rate is up to 52.4%. He’s turned into Felix Hernandez Lite. Imagine if the two of them were on the same staff. Jesus (Montero) that would be nice for Mariner fans. Pineda’s 3.34 ERA is actually higher than you’d expect based on his peripherals, mainly due to a .339 BABIP and 68.3% left on base percentage.

Jake Odorizzi (-0.24)


66.3 IP, 2.31 ERA, 2.52 FIP, 3.61 xFIP, 0.96 WHIP—current

178 IP, 4.05 ERA, 1.31 WHIP—preseason

136 IP, 3.81 ERA, 1.27 WHIP—rest-of-season


Jake Odorizzi has seen his strikeout rate drop from last year’s 24.2% to 20.2% this year but he’s offset that with a walk rate that has dropped at an even greater rate, from 8.2% last year to 4.6% so far this year. According to PITCHf/x Pitch Types, he’s changed his pitch arsenal in a number of ways. Consider the chart below:

Odorizzi has dropped his usage of the four-seam fastball and almost completely eliminated his slider and increased the use of his two-seamer, cutter, and splitter. The result has been a lower strikeout rate but better control and an increase in ground ball percentage, from 29.9% last year to 41.2% this year. Last year, Odorizzi gave up the second-highest percentage of fly balls of any pitcher who qualified for the ERA title, at 48.7%, behind only Chris Young (58.7%). This year, he’s 34th out of 109 pitchers who qualify. Fewer fly balls generally mean fewer home runs allowed and Odorizzi has seen a big drop there also. Last year, he gave up 20 homers in 168 innings. This year, he’s allowed just two long balls in 66 1/3 innings, although a very low 2.8% HR/FB rate is part of that decrease and he’s not likely to sustain a home run per fly ball rate that low for the whole season. Still, despite the lower strikeout rate, Odorizzi has been even more effective this year than previously because he’s made up for it with better control and more ground balls.

Jake Arrieta (-0.23)


58 IP, 2.95 ERA, 2.39 FIP, 2.68 xFIP, 1.09 WHIP—current

173 IP, 3.62 ERA, 1.25 WHIP—preseason

127 IP, 3.39 ERA, 1.21 WHIP—rest-of-season


Over the first four years of his career, Jake Arrieta had a 5.23 ERA (4.75 FIP) and 1.43 WHIP. He struck out 17.5% of the batters he faced, walked 10.2%, and induced ground balls on 43.3% of his balls in play. Since the beginning of 2014, Arrieta has a 2.64 ERA (2.29 FIP), and 1.02 WHIP. He’s struck out 27.1% of the batters he’s faced, walked 6.5%, and has a 49.8% ground ball rate. All of the most important things you want a pitcher to do better, he’s done better. He’s done this by changing his pitch arsenal. If you go by Baseball Info Solutions pitch types, Arrieta started throwing cutters nearly 30% of the time in 2014 and has continued to do so this season after not throwing any cutters from 2010 to 2012 and throwing it 6% of the time in 2013. According to PITCHf/x pitch types, he went from throwing sliders roughly 14% of the time prior to the 2014 season to nearly 30% of the time this year and last. I don’t know enough about the difference in classification between the two sources but Arrieta made a change of some sort and it is working. It may be more cutters, it may be more sliders. Maybe it’s a slutter. Whatever it is, this change in pitch type that has resulted in much improved numbers since the beginning of last season would suggest to me that even that improved rest-of-season projection is likely going to come in on the high side for Arrieta.

Aaron Harang (-0.22)


65 1/3 IP, 1.93 ERA, 2.86 FIP, 4.30 xFIP, 1.03 WHIP—current

155 IP, 4.51 ERA, 1.40 WHIP—preseason

125 IP, 4.29 ERA, 1.37 WHIP—rest-of-season


Based on some metrics, Aaron Harang is off to a terrific start. He’s currently seventh in WAR among all pitchers with a sub 2.00 ERA. His 2.86 FIP is also quite good but that comes with a caveat—Harang’s 2.3% HR/FB rate, which would be much better than anything he’s ever done before. In his career of over 2215 innings, Harang has allowed 9.9% of his fly balls to leave the yard, so it’s hard to believe he has somehow magically developed the ability to limit home runs on fly balls. He has improved his walk rate but is also striking out fewer batters and has a .258 BABIP, which is much lower than his career .304 BABIP. All signs point to regression from his current numbers, but his rest-of-season projection doesn’t think he’ll be as bad as his preseason projection thought he’d be. That’s still not good, of course.

Chris Archer (-0.21)


59.3 IP, 2.12 ERA, 2.46 FIP, 2.59 xFIP, 0.99 WHIP—current

183 IP, 3.69 ERA, 1.29 WHIP—preseason

138 IP, 3.48 ERA, 1.26 WHIP—rest-of-season


Chris Archer was good in 2013 and 2014 but has turned it up a notch this year. Over the first two years of his career, Archer had a 21.2% strikeout rate, 7.9% walk rate, and 46.3% ground ball rate. This year, he’s increased his strikeout rate to 30.7%, dropped his walk rate to 7.5%%, and increased his ground ball rate to 52.5%. Archer has increased his slider usage by about 10% over last year (based on BIS and PITCHf/x) and is generating more swinging strikes than he ever has, up to 12.1% this year compared to 9.3% last year.


Effect of Stats So Far on Depth Charts RoS Projections

Major League Baseball teams have played more than one-fourth of their schedule so for and there is new data to incorporate into projections. Some players are off to amazing starts (Bryce Harper and Nelson Cruz), while others have really struggled (Troy Tulowitzki and Steve Pearce). With that in mind, I thought I’d look at which players have seen their rest-of-season projections change the most from their preseason projections. I used the preseason Depth Charts projections and compared each player’s preseason projection for AVG/OBP/SLG and wOBA to their rest-of-season Depth Charts projection. All statistics are from May 25th.

The Biggest Losers


SS Troy Tulowitzki (-.019)


.272/.288/.415, .301 wOBA—current

.307/.386/.539, .400 wOBA—preseason

.300/.370/.515, .381 wOBA—rest-of-season


The statistic that stands out most when looking at Tulowitzki is an extremely low walk rate of just 2.6%. Tulo’s career walk rate is 9.8% and the lowest single-season walk rate he’s had was an 8.4% mark in 2007, his second year in the major leagues. He also has a strikeout rate (21.7%) that is 5.7% higher than his career mark. According to Pitch f/x Plate Discipline, Tulowitzki is swinging at more pitches outside the strike zone (on pace for a career high of 32.9% O-Swing%) and more pitches inside the strike zone (65.6%, career mark is 57.8%) and making less contact than he ever has in a season (78.2% Contact%). When it comes to balls in play, Tulowitzki has seen just 4.3% of his fly balls leave the yard, far below his career rate of 15.1% HR/FB. Despite his struggles, his rest-of-season projection of a .381 wOBA is still elite for a shortstop even if it’s dropped .019 from his pre-season projection of .400.

2B/OF/1B Steve Pearce (-.018)


.188/.262/.323, .259 wOBA—current

.266/.346/.471, .358 wOBA—preseason

.254/.333/.446, .340 wOBA—rest-of-season


Pearce is striking out slightly more than he did last year (20.6% to 19.8%) and walking a bit less (7.5% to 10.4%), but nothing as glaringly different from the norm as Troy Tulowitzki has shown so far (see above). One of the biggest problems for Pearce has been a .197 BABIP, down from .322 last year and well below his .287 career mark. His BABIP is down despite a career-best 25.3% line drive rate. His HR/FB is also close enough to last year’s rate to not be anything to worry about (14.3% this year, 17.5% last year). According to Pitch f/x Pitch Types, Pearce has seen a much lower percentage of two-seam fastballs (4.5%) than he did last year (14.1%) even though his overall percentage of fastballs is up (45.1% to 43.7%), so pitchers are attacking him a bit differently. The heat maps below show the swing percentage for Steve Pearce in 2014 on the left and his swing percentage for 2015 on the right. It looks like pitchers are getting Pearce to swing at more pitches in the upper half and inside part of the strike zone with four seam fastballs. Can he adjust?

OF Carlos Gonzalez (-.017)


.206/.285/.326, .275 wOBA—current

.281/.346/.509, .370 wOBA—preseason

.270/.338/.481, .353 wOBA—rest-of-season


Unlike his equally disappointing teammate, Troy Tulowitzki, Carlos Gonzalez is walking more and striking out less than he has in the last couple seasons. His walk rate of 10.1% is higher than his career mark of 8.0% and his strikeout rate of 20.8% is below his career mark of 22.3%. Like Steve Pearce, CarGo has a BABIP problem. From 2008 to 2013, Gonzalez never had a BABIP below .318 and his career mark over 2826 plate appearances was .350. Last year, he had a .283 BABIP. This year, it’s down to .238. His batted ball profile shows a 22.9% line drive rate, which is higher than his career rate of 20.2%. He’s hitting more ground balls and fewer fly balls than he has historically, which should help his BABIP. When looking at Gonzalez’ hard hit percentage, we find his 27.3% mark this year is his lowest since his rookie year. In his two best season’s (2010 and 2013), CarGo had his two best Hard Hit percentages, at 43.8% and 38.8%. With Gonzalez and his history of injuries, you never know if he’s truly healthy. His plate discipline numbers suggest he’s fine in that regard but that low hard hit percentage is troublesome.

OF Melky Cabrera (-.014)


.241/.287/.271, .253 wOBA—current

.292/.342/.436, .342 wOBA—preseason

.286/.335/.414, .328 wOBA—rest-of-season


Melky is suffering from a low BABIP of .252 (career mark is .308) but his batted ball profile isn’t much different from last year as far as line drives, ground balls, and fly balls are concerned. His HR/FB is way down at 2.4% (last year it was 10.7%) and his Hard% of 19.6% is well below his 2014 rate of 30.5%. He’s walking about as much as he usually walks and is striking out less often than he ever has so he’s making contact, it just hasn’t been good contact.

2B Robinson Cano (-.013)


.253/.295/.337, .279 wOBA—current

.296/.361/.455, .353 wOBA—preseason

.289/.351/.438, .340 wOBA—rest-of-season


Through more than one-fourth of the season, Robinson Cano has just one home run. Other than a terrible 2.9% HR/FB, his batted ball profile looks much like last year and his Hard% of 32.6% is better than last season’s 28.5% mark. As for plate discipline, his walk rate is down to 5.4% after averaging over 9% in the three previous seasons. He also currently has the highest strikeout rate of any season of his career, at 16.7%, with a contact percentage down by approximately 5% on pitches both inside and outside of the strike zone.


The Biggest Winners


OF Bryce Harper (+.019)


.333/.471/.727, .494 wOBA—current

.279/.363/.491, .372 wOBA—preseason

.287/.383/.528 .391 wOBA—rest-of-season


Bryce Harper’s monster start to the season has raised his wOBA projection by .019, the largest increase for any player. This looks like the year Harper has made the jump to elite level. His walk rate of 20.9% is well above his career rate of 11.6%. He’s been hitting so well, and with such power, that pitchers just don’t want to throw him anything to hit. His percentage of strikes out of all pitches thrown was 61.7% in his first three years in the major leagues. This year, pitchers are throwing strikes to Harper just 55.8% of the time. He’s also swinging less often on pitches both inside and outside the strike zone and has a career-best 40.0 Hard% when he does make contact. His HR/FB of 35.6% is almost double his career rate and he’s increased the percentage of fly balls he’s hit and the percentage of balls he’s pulled. It looks like he’s matured into the player everyone thought he’d be.

C Stephen Vogt (+.019)


.307/.410/.598, .424 wOBA—current

.255/.303/.398, .308 wOBA—preseason

.263/.322/.429, .327 wOBA—rest-of-season


Stephen Vogt has some of the same indicators as Bryce Harper. Vogt is also seeing fewer strikes (58.2% after seeing 64.1% strikes in his first three seasons) and has a career-best walk rate of 15.1% (career rate is 8.1%). His HR/FB rate of 22.2% is more than double his career rate (10.6%) and he’s pulling more balls than he ever has.

OF Nelson Cruz (+.016)


.341/.398/.688, .458 wOBA—current

.250/.309/.457, .334 wOBA—preseason

.262/.322/.492, .350 wOBA—rest-of-season


Unlike Harper and Vogt, Cruz has a walk rate that is very close to his career mark. He’s also striking out just a little more than he has during his career, so he’s not walking or striking out at a much different rate than he normally does. He does have a very high .374 BABIP (career BABIP is .302) and the best HR/FB rate of his career, at 31.5% (career mark is 17.9%). With Cruz being on the positive side of the biggest changes in projected wOBA from the preseason to now and his teammate Robinson Cano being on the negative side, the only explanation is that Cruz stole Cano’s mojo.

The interesting thing is that the Cruz and Cano combined are not far off from preseason projections when pro-rated to their current 376 combined plate appearances:

376 PA, 44 R, 14 HR, 49 RBI, .274/.336/.456—Combined preseason projection for Cano & Cruz pro-rated to their current 376 plate appearances.

376 PA, 48 R, 18 HR, 48 RBI, .296/.346/.508—Current combined hitting statistics for Cano & Cruz.

DH Alex Rodriguez (+.015)


.262/.363/.545, .388 wOBA—current

.231/.311/.386, .310 wOBA—preseason

.236/.323/.417, .325 wOBA—rest-of-season


Heading into his age 39 season and having missed all of 2014, expectations were low for Alex Rodriguez this year. And yet, here he is with a very good .263/.363/.545 batting line and 10 home runs in 41 games. His current .388 wOBA would be his highest since 2009. Of course, the projections don’t see that happening but they have bumped up his wOBA from .310 before the season started to .325 for the rest of the season. A-Rod is walking and striking out at similar rates to his 2013 season and has a similar BABIP to that year as well, but he’s increased his HR/FB percentage from 15.6% in 2013 to 23.3% so far this year. That rate would be his best since 2007.

1B Mark Teixeira (+.015)


.236/.362/.563, .387 wOBA—current

.229/.319/.422, .327 wOBA—preseason

.234/.332/.454, .342 wOBA—rest-of-season


Mark Teixeira has seen a projected increase of .015 in his wOBA from the preseason to the rest-of-season thanks to a .387 wOBA through his first 43 games. Teixeira is doing this despite a .191 BABIP, which is well below his career mark of .285. Of course, Teixeira routinely had BABIPs above .300 in the first seven years of his career but has been below .250 in each of the last five years. He is walking more than he ever has (15.6% BB%) and striking out at a career-low rate (12.1%). He also has a 25.5% HR/FB, which would be a career high.


Checking in on Starting Pitchers

The MLB season is nearing the one-quarter mark. Most teams are getting close to 40 games played and many starting pitchers have between 40 and 60 innings under their belts. With that in mind, I decided to take a look at fantasy-relevant starting pitchers. Fantasy-relevant can mean different things to different people, depending on the size of the league. For these purposes, I gathered information on all starting pitchers with four or more starts, then eliminated those who are projected by the FanGraphs Depth Charts to finish with an ERA over 4.25. This is arbitrary, I know, but I wanted to get the number of pitchers down to a smaller number. I was left with 90 pitchers.


Here is the key for the tables below:

IP—Current innings pitched (as of May 18)

ERA—Current ERA

FIP—Current FIP

xFIP—Current xFIP

DC-ERA—Rest-of-Season Projected Depth Charts ERA

ERA-xFIP—Current ERA minus current xFIP

ERA-DCERA—Current ERA minus Rest-of-Season Projected Depth Charts ERA


I used xFIP because I’ve read that it is a better predictor going forward than actual ERA or FIP.

I’ve separated the table into groups because a 90-pitcher spreadsheet just seems like too much to take in at one time. The groups will be sorted based on the difference between the pitcher’s current ERA and their current xFIP. With most of these pitchers having pitched around 50 innings, a difference of one earned run allowed is a difference of 0.18 in ERA, so I’ve used 0.54 and 1.08 as cutoff points in either direction for the charts.

The first group of pitchers includes those with an ERA at least 1.08 below their xFIP. These are the guys whose results are much better than you’d expect based on their peripherals.

The column on the far right shows the difference between their current xFIP and their Depth Charts RoS projections (DC-ERA). For pitchers who have a number close to zero, you could say they are pitching about as well as they’re projected to pitch going forward.

I will revisit these charts at the end of the year to see how things play out.

All of the pitchers in the top 17 have shown much better results than would be expected based on their peripherals and their projections. The column on the far right is interesting, though, and may be where we learn something at the end of the season. For example, Zack Greinke has a terrific 1.52 ERA, much lower than his 3.64 xFIP or his 3.20 FIP. His RoS Projection calls for a 3.14 ERA. At the end of the year, I will compare Greinke’s actual ERA from May 19th to the end of the season with these numbers. Greinke can be expected to have a higher ERA moving forward. The question is whether it will be closer to the 3.64 xFIP he has or the 3.14 DC-ERA.

A similar situation is true for Garrett Richards. Among this group of pitchers, Richards has the biggest difference between his xFIP and Depth Charts RoS projection (DC-ERA), at 0.69. Richards has a 2.29 ERA, 3.10 FIP, 4.04 xFIP, and 3.35 DC-ERA. He’s due for regression no matter which metric you favor, but is he closer to a 4.00 guy or a 3.30 guy?

A.J. Burnett has the biggest difference going the other direction, with a 3.58 xFIP and 3.98 DC-ERA. His current 1.38 ERA is ridiculous. He can be a useful pitcher with a 3.50-ish ERA but much less useful if his ERA is closer to 4.00 from this point on. Similar to Burnett is Dallas Keuchel, with a 1.87 ERA, 2.85 FIP, 3.28 xFIP, and 3.67 DC-ERA, and Jake Odorizzi (2.36 ERA, 2.49 FIP, 3.54 xFIP, 3.83 DC-ERA).

In theory (it’s my theory and I admit I am no Isaac Newton), the pitchers with the biggest negative difference in the column on the far right are pitchers who are more likely to beat their projections going forward. A big difference in the other direction could mean they are less likely to hit that projection. Again, I’ll revisit this at the end of the season.

This next group of pitchers also has results that are better than expected. The guy to target in this group based on my theory from above would be JA Happ:

JA Happ—2.98 ERA, 3.35 FIP, 3.58 xFIP, 4.07 DC-ERA. Happ is expected to regress but his FIP and xFIP say he won’t regress nearly as much as his projection would have you believe. In his first seven starts, Happ has a 1.8 BB/9, which is a much better walk rate than he’s had in any previous season of his career. His lifetime BB/9 is 3.7.

On the other hand, the following guys may not be all you want them to be:

John Lackey—2.96 ERA, 3.19 FIP, 4.00 xFIP, 3.63 DC-ERA. Lackey is striking out fewer batters and walking more than he did last year but has a much better ERA. The big difference has been a .269 BABIP and 0.4 HR/9. Last year he gave up 1.1 HR/9 and had a .305 BABIP. His xFIP suggests an ERA around 4.00 while his projection is for a 3.63 ERA going forward.

Jordan Zimmermann—3.66 ERA, 3.19 FIP, 4.21 xFIP, 3.32 DC-ERA. Zimmermann’s strikeout rate has dropped from 8.2 K/9 last year to 5.8 K/9 this year. That being said, last year looks like the outlier, as it was the first time in his first four years as a starter that his K/9 was over 7.1. Still, this year’s strikeout rate would be the lowest of Zimmermann’s career. His xFIP is at 4.21, while his rest-of-season projection is a much more optimistic 3.32.

These pitchers have ERAs within -0.54 and +0.54 of their xFIPs, which is the equivalent of two or three runs, so they could be considered the big group in the middle with numbers closest to what you’d expect. Still, the column to the right reveals some pitchers to target and avoid.

Guys who could outpitch their rest-of-season projections:

Gerrit Cole—2.40 ERA, 2.43 FIP, 2.75 xFIP, 3.32 DC-ERA. Cole could be taking a great leap forward to Ace status. He’s upped his strikeout rate and lowered his walk rate and his ERA, FIP, and xFIP are all below 3.00.

Jason Hammel—3.11 ERA, 3.36 FIP, 3.37 xFIP, 3.83 DC-ERA. Hammel is enjoying life back in the National League. In his career, Hammel has a 2.9 BB/9. Last year he sported a 1.9 BB/9 in his time with the Cubs but that went up to 2.8 BB/9 with the Athletics. He’s back with the Cubs and has walked just 1.2 per nine so far this year.

Chris Archer—2.47 ERA, 2.58 FIP, 2.73 xFIP, 3.47 DC-ERA. Through nine starts, Archer has jacked up his strikeout rate from last year’s 8.0 K/9 to 10.2 K/9. He’s also dropped his walk rate (3.3 BB/9 to 2.6 BB/9). He could be taking the leap along with Gerrit Cole to becoming a top tier-starting pitcher.

Jake Arrieta—2.77 ERA, 2.23 FIP, 2.69 xFIP, 3.39 DC-ERA. In his first four years in the major leagues (2010-2013), Jake Arrieta had a 5.23 ERA (4.75 FIP). Last year he broke out with the Cubs and posted a 2.53 ERA (2.26 FIP, 2.73 xFIP). Projections naturally expected some regression but he has been just as good this year as last year (2.23 FIP, 2.69 xFIP) so his Depth Charts Rest-of-Season Projection of 3.39 looks like it could be much too high.

Bartolo Colon—3.86 ERA, 3.60 FIP, 3.39 xFIP, 3.96 DC-ERA. Bartolo Colon saw what Phil Hughes did last year (186 strikeouts and 16 walks in 209 2/3 innings) and decided he would show the youngster how it’s done. Colon has 42 strikeouts and just one walk in 52 1/3 innings so far this year (he walked Ryan Zimmerman in his first outing this year, back on April 6th).


Guys to be cautious about:

Doug Fister—4.31 ERA, 4.71 FIP, 4.69 xFIP, 3.75 DC-ERA. Fister just went on the DL with forearm tightness so there’s a chance we won’t learn much from him over the rest of the season.

Madison Bumgarner—3.20 ERA, 3.52 FIP, 3.58 xFIP, 2.94 DC-ERA. Bumgarner pitched almost 270 innings last year when you include his stellar postseason and has seen his K/9 drop from 9.1 to 8.2 through his first eight starts. He can still be a positive contributor with an ERA in the 3.50 range but owners likely drafted him expecting an ERA near 3.00.

Alex Wood—3.83 ERA, 3.36 FIP, 4.02 xFIP, 3.49 DC-ERA. After striking out 8.9 batters per nine over his first 249 innings in the big leagues (2013 and 2014 combined), Wood’s K/9 has dropped to 6.1 this year. He’s upped his ground ball rate to over 50% but his fantasy owners would prefer he find those lost strikeouts.

Julio Teheran—4.33 ERA, 5.55 FIP, 4.18 xFIP, 3.66 DC-ERA. If you’re expecting Teheran to have a 3.66 ERA going forward, as his Depth Charts projection would suggest, you may be quite disappointed. Tehran is walking more batters than he ever has and giving up home runs at a ridiculous rate. Even adjusting to a league average home run rate doesn’t make him look very good, as his xFIP is over 4.00.

These pitchers all have ERAs that are worse than would be expected based on their xFIPs.

Guy from this group my theory would expect to be better than his rest-of-season projection:

Michael Pineda—3.31 ERA, 2.01 FIP, 2.41 xFIP, 3.27 DC-ERA. Pineda’s rookie year was back in 2011, when he struck out 9.1 batters per nine and walked 2.9. After missing two years because of injury, he came back last year to strike out 7.0 batters per nine and dropped his walk rate to 0.8 BB/9. This year, he has combined the best of both years, upping his strikeout rate to 9.6 K/9 and dropping his walk rate to 0.5 BB/9. He’s first in all of baseball with a 2.01 FIP and third in xFIP, at 2.41. Pineda’s rest-of-season projection calls for a 3.27 ERA but it looks like he could be on track to outdo that.

Guy my theory would not expect to be better than his rest-of-season projection:

Danny Duffy—5.87 ERA, 4.58 FIP, 4.82 xFIP, 3.86 DC-ERA. Duffy was a useful starting pitcher in fantasy league’s last year when he had a 2.53 ERA and 1.11 WHIP. His walk rate of 3.2 BB/9 was the best of his career. This year, he can’t get the walks under control (4.5 BB/9) and his ERA and WHIP have skyrocketed. Duffy’s FIP and xFIP don’t portend the improvement you might expect if you’re looking hopefully at his rest-of-season projection.

This final group of pitchers includes guys who have ERAs much worse than their xFIPs. These are the guys who have destroyed you ratios in the early going. You probably aren’t real happy with any of these chumps. Based on regression to the mean, they should all be better, but you knew that. Which guys should REALLY be better and which guys should you be a bit more skeptical about?

Should be MUCH better:

Danny Salazar—4.06 ERA, 3.52 FIP, 2.36 xFIP, 3.55 DC-ERA. Since returning from his minor league exile to start the season, Salazar has struck out 12.4 batters per nine and walked just 1.4. He’s given up too many home runs (7 in 37 2/3 innings, 1.7 HR/9), which has inflated his ERA. Salazar’s rest-of-season projection calls for an ERA around 3.50, which is the same as his current FIP. His xFIP, though, has him with an ERA under 2.50.

Clay Buchholz—4.93 ERA, 2.91 FIP, 2.99 xFIP, 3.95 DC-ERA. Based on the things a pitcher has the most control over—strikeouts, walks, and home runs allowed—Clay Buchholz is having his best season (10.6 K/9, 2.6 BB/9, 0.8 HR/9). Based on actual results (2-4 record, 4.93 ERA, 1.38 WHIP), he’s been pretty bad. He should be better. The caveat with Buchholz is that his ERA last year was 5.34, which was much higher than his FIP (4.01) and xFIP (4.04), so you just don’t know if maybe this is who he is now. For the record, in his career, Buchholz has a 3.97 ERA, 4.00 FIP, and 4.03 xFIP.

Finally, the guys who should be better but maybe not as good as you hope:

Chris Tillman—6.34 ERA, 5.42 FIP, 5.09 xFIP, 4.24 DC-ERA. From 2012-2014, Chris Tillman had a 3.42 ERA and 1.19 WHIP in 499 2/3 innings, although his FIP was a much less impressive 4.22. This year, Tillman currently has a 6.34 ERA through seven starts and his FIP and xFIP are both over 5.00. He’s projected to have a 4.24 ERA from this point forward but a sky-high walk rate (4.5 BB/9) will have to come down for him to approach that number.

Stephen Strasburg—5.98 ERA, 3.47 FIP, 3.66 xFIP, 3.14 DC-ERA. It’s shocking to see Stephen Strasburg with a 5.98 ERA. He’s striking out fewer batters than last year (9.3 K/9 to 10.1 K/9) and walking more (2.7 BB/9 TO 1.8 BB/9), but his strikeout and walk numbers are still quite good. The biggest problem appears to be a .389 BABIP and 60.6 LOB%. The Depth Chart projections expect a 3.14 ERA going forward but Strasburg’s FIP (3.47) and xFIP (3.66) aren’t as optimistic.


MLB Franchise Four: NL East

Major League Baseball has a campaign asking fans to vote for the four “most impactful” players in their team’s history, with the winners being announced at the 2015 All-Star Game in Cincinnati. A panel of experts created an eight-man ballot for each team. This panel consists of MLB’s Official Historian John Thorn and representatives from MLB’s official statistician (the Elias Sports Bureau), MLB.com, MLB Network, and the Baseball Writers’ Association of America.

“Most impactful” is open to interpretation, which makes this an interesting exercise. It isn’t “best” or “most famous” or “most popular”, but “most impactful.” I decided to look at the eight players on the ballot for each franchise and where they rank in FanGraphs WAR during their time with that franchise.

For each franchise, I’ve listed their top 10 in FanGraphs WAR along with any players who are on the ballot who are below the top 10. The players in BOLD are those who are on the ballot and the years listed are the years in which they played for that team.


Atlanta Braves (1871-2015)

(1) Hank Aaron, 136.0 WAR (1954-1974)

(2) Eddie Mathews, 94.3 WAR (1952-1966)

(3) Chipper Jones, 84.6 WAR (1993, 1995-2012)

(4) John Smoltz, 80.3 WAR (1988-1999, 2001-2008)

(5) Warren Spahn, 74.3 WAR (1942, 1946-1964)

(6) Greg Maddux, 73.9 WAR (1993-2003)

(7) Kid Nichols, 72.8 WAR

(8) Phil Niekro, 71.0 WAR

(9) Andruw Jones, 64.3 WAR

(10) Tom Glavine, 57.0 WAR (1987-2002, 2008)

(11) Dale Murphy, 44.3 WAR (1976-1990)


On the ballot: The players on the Braves Franchise Four ballot range from Warren Spahn, who first played in the big leagues in 1942, to Chipper Jones, who hung up his spikes after the 2012 season. Three of the players on the ballot—Warren Spahn, Eddie Mathews, and Hank Aaron—were part of the 1957 World Series Champion Milwaukee Braves team. Four players—Chipper Jones, John Smoltz, Greg Maddux, and Tom Glavine—were key members of the consistently good Atlanta Braves teams of the 1990s. Then there’s Dale Murphy, who played for the Braves from 1976 to 1990 and experienced just three seasons in which the team finished in the upper half of the standings. The Braves finished in last place eight times in those 15 years but Murphy was a bright spot, winning back-to-back MPV Awards in 1982 and 1983.

Hank Aaron hit .280/.322/.447 as a 20-year-old rookie for the 1954 Milwaukee Braves. He was not an All-Star that year, but he would be an All-Star for the next 21 years of his career. He was the National League MVP in 1957, the year the Braves won the World Series. He led the league in home runs and RBI four times each and in total bases eight times and was the all-time leader in career home runs when he retired. He’s an easy pick for the Braves Franchise Four.

Eddie Mathews and Warren Spahn were teammates of Hank Aaron in the 1950s and 60s. Mathews ranks third all-time in FanGraphs WAR for third basemen. Spahn is sixth all-time in wins for a pitcher. Both were key contributors to the Braves back-to-back World Series years in 1957 and 1958. Mathews had 7.3 WAR in 1957 and 5.8 WAR in 1958. Spahn was the Cy Young Award winner in 1957and led the National League in wins both years.

The Atlanta Braves made the playoffs every year from 1991 to 2005, except for the 1994 season that was ended by a labor dispute. Chipper Jones joined the team as a regular in 1995 and finished second in the Rookie of the Year voting, then won the NL MVP Award four years later when he hit .319/.441/.633 during the 1999 season.

John Smoltz was a very good starting pitcher from 1989 to 1999, which included an NL Cy Young Award in 1996. He was injured and missed the entire 2000 season, then came back as a relief pitcher and saved 144 games over three seasons from 2002 to 2004.

Greg Maddux won his first Cy Young Award with the Cubs in 1992 but was at his absolute best with the Braves from 1993 to 1998 when he averaged 7.9 WAR per season, won three more Cy Young Awards, and had a 2.15 ERA and 0.96 WHIP. In 1994 and 1995, Maddux was 35-8 with a 1.60 ERA over 411 2/3 innings.

Tom Glavine didn’t reach the heights that his fellow pitchers did. He never had a season with as much as 6 WAR. He was an above-average pitcher for a long time, though, and finished his career with over 300 wins.

Notable ballot snubs: Phil Niekro and his 71.0 WAR with the Braves (8th all-time) give him an argument for inclusion over Glavine (57 WAR) and Murphy (44.3 WAR) but it’s a tough call.

My Franchise Four: Hank Aaron, Eddie Mathews, Chipper Jones, John Smoltz


Miami Marlins (1993-2015)

(1) Hanley Ramirez, 30.4 WAR

(2) Giancarlo Stanton, 21.4 WAR (2010-2015)

(3) Luis Castillo, 21.1 WAR (1996-2005)

(4) Josh Johnson, 20.8 WAR

(5) Miguel Cabrera, 19.6 WAR

(6) Dan Uggla, 18.1 WAR

(7) Ricky Nolasco, 17.9 WAR

(8) Mike Lowell, 17.3 WAR (1999-2005)

(9) Dontrelle Willis, 17.1 WAR

(10) Jeff Conine, 16.7 WAR (1993-1997, 2003-2005)

(13) Gary Sheffield, 14.4 WAR (1993-1998)

(14) Charles Johnson, 14.0 WAR (1994-1998, 2001-2002)

(15) Josh Beckett, 13.9 WAR (2001-2005)

(50) Livan Hernandez, 3.9 WAR (1996-1999)


On the ballot: The Marlins have made the playoffs twice in the 22 seasons they’ve completed (and won the World Series both times). Their two World Series squads are well represented on their Franchise Four ballot. Luis Castillo, Jeff Conine, Gary Sheffield, Charles Johnson, and Livan Hernandez were on the 1997 team that beat the Indians in the World Series. Castillo, Conine, and Johnson were also on their 2003 World Series team, with Mike Lowell and Josh Beckett joining them on the roster. The only player on the team’s Franchise Four ballot who wasn’t a part of either World Series team is Giancarlo Stanton, their current superstar. Stanton is starting his sixth season with the team and is already second on their all-time WAR leaderboard. In his first five years with the team, he averaged 31 home runs and 127 games played. Before this season he signed a 13-year, $325 million contract so his place on the Marlins Franchise Four is likely a sure thing.

Luis Castillo is the longest tenured Marlin on the ballot. He played 10 years with the team and accumulated 21.1 WAR, with his best season being the 4.9 WAR season of 2003. He hit .314/.381/.397 that year, made his second All-Star team, and won the first of three straight Gold Glove Awards.

Jeff Conine and Charles Johnson each had two separate stints with the Marlins. Conine and Johnson were teammates on the 1997 World Series winners. Conine was selected by the Marlins in the 1992 Major League Baseball expansion draft and his best year with the Marlins was in 1996 when he hit .293/.360/.484 and was worth 4.4 WAR. He’s one of the most loved players in franchise history, still works in the team’s front office, and is known as “Mr. Marlin”. Charles Johnson hit .250/.347/.454 in 1997, with good defense behind the plate. He followed up his good regular season play by hitting .357/.379/.464 in the ’97 World Series.

Gary Sheffield played for eight different MLB teams in his 22-year career. Six of those seasons were with the Marlins from 1993 to 1998 but two were partial seasons. He joined the Marlins in the middle of the 1993 season then left partway through the 1998 season. His best year with the team was in 1996 when he hit .314/.465/.624 and was worth 6.5 WAR.

Livan Hernandez, like Sheffield, played for many different MLB teams. Hernandez spent 17 years in the bigs and spent time with nine different teams. He had more starts with Washington and San Francisco than he did with the Marlins but his work in the 1997 postseason earned him a place on the Marlins’ ballot. Hernandez won two games in the NLCS and two more in the 1997 Fall Classic and was named MVP of each series. Of course, if he makes the team’s Franchise Four, MLB might want to carve out some space for Eric Gregg and his generous strike zone that helped Livan strike out 15 Atlanta batters in Game 5 of the 1997 NLCS.

Mike Lowell and Josh Beckett were both 4 WAR players for the Marlins’ 2003 World Series championship team. Lowell had a career-high 32 homers that year. Beckett only started 23 games during the 2003 regular season but made five starts in the postseason and was named MVP of the World Series.

Notable snubs: Well, Livan Hernandez is way down the list of career WAR for Marlins players (50th). His spot on the ballot is almost solely due to his 1997 postseason heroics. Is he more worthy than the team leader in career WAR, Hanley Ramirez?

My Franchise Four: Giancarlo Stanton, Jeff Conine, Luis Castillo, Mike Lowell


New York Mets (1962-2015)

(1) Tom Seaver 68.5 WAR (1967-1977, 1983)

(2) Dwight Gooden 52.6 WAR (1984-1994)

(3) David Wright 52.2 WAR (2004-2015)

(4) Jerry Koosman 41.9 WAR

(5) Darryl Strawberry 35.5 WAR (1983-1990)

(6) Jose Reyes 30.7 WAR

(7) Jon Matlack 29.5 WAR

(8) Carlos Beltran 29.4 WAR

(9) Edgardo Alfonso 29.0 WAR

(10) Mike Piazza 27.0 WAR (1998-2005)

(12) Keith Hernandez 26.2 WAR (1983-1989)

(32) Gary Carter 12.8 WAR (1985-1989)

(53) John Franco 8.9 WAR (1990-2001, 2003-2004)


On the ballot: Tom Seaver is the Mets’ all-time leader in FanGraphs WAR, was named to 10 All-Star teams, won three NL Cy Young Awards with the team, and was the #1 starter on the 1969 “Miracle Mets” team that won the first World Series in franchise history. He should be a lock.

Four players on the ballot—Dwight Gooden, Darryl Strawberry, Keith Hernandez, and Gary Carter—were part of the 1986 Mets team that won the World Series in seven games over the Boston Red Sox.

Gooden was good in 1986 (5 WAR) but he was at his best the previous year when he went 24-4 with a 1.53 ERA and 268 strikeouts in 276 2/3 innings (9 WAR).

Similarly, Darryl Strawberry was a good player in 1986 (3.4 WAR) but had five other seasons with the Mets that were more valuable, with his best season coming in 1990 when he hit .277/.361/.518 with 37 homers and 108 RBI.

Keith Hernandez’ best season with the Mets was in 1986 when he hit .310/.413/.446. Hernandez is an interesting choice for the Mets’ ballot. He played more seasons and had more WAR with the St. Louis Cardinals but did not make their eight-man ballot. Gary Carter also played more years with a team other than the Mets. He spent 12 years with the Expos and is their franchise leader in WAR. He played just five seasons with the Mets and is 32nd on their all-time WAR leaderboard. Both Hernandez and Carter were big contributors to the last Mets’ World Series-winning team, so that likely sealed their place on the Franchise Four ballot. Hernandez may get some votes because he’s been an announcer with the team for many years in addition to his playing career.

Mike Piazza and John Franco were teammates on the 1999 and 2000 Mets teams that made the playoffs. The 1999 team lost the NLCS in six games, while the 2000 team made it to the World Series but lost in five games to the New York Yankees. As a Met, Piazza hit .296/.373/.542 and averaged 3.4 WAR per season. Franco saved 276 games for the Mets in his career but his overall total of 8.9 WAR in 14 seasons with the team suggests he doesn’t really belong on the Franchise Four ballot.

Finally, David Wright has been the face of the franchise over the last decade and is third all-time in WAR for the team. He’s a seven-time All-Star with a career batting line of .298/.377/.494.

Notable snub: Jerry Koosman and Jose Reyes are fourth and sixth in WAR for the Mets, yet did not make the eight-man ballot. Koosman even had two wins in the 1969 World Series. Perhaps he and/or Jose Reyes would have been a better choice than John Franco.

My Franchise Four: Tom Seaver, Dwight Gooden, Darryl Strawberry, Keith Hernandez


Philadelphia Phillies (1883-2015)

(1) Mike Schmidt, 106.5 WAR (1972-1989)

(2) Steve Carlton, 73.5 WAR (1972-1986)

(3) Ed Delahanty, 64.8 WAR

(4) Robin Roberts, 62.7 WAR (1948-1961)

(5) Chase Utley, 60.9 WAR (2003-2015)

(6) Richie Ashburn, 52.3 WAR (1948-1959)

(7) Sherry Magee, 51.5 WAR

(8) Pete Alexander, 50.8 WAR

(9) Jimmy Rollins, 49.1 WAR (2000-2014)

(10) Bobby Abreu, 47.2 WAR

(17) Chuck Klein, 34.0 WAR (1928-1933, 1936-1944)

(20) Jim Bunning, 31.2 WAR (1964-1967, 1970-1971)


On the ballot: Mike Schmidt played his entire career with the Phillies, was a three-time NL MVP, 12-time All-Star, 10-time Gold Glove winner, and led the league in home runs eight times. He was also the MVP of the 1980 World Series championship team. He’s a lock for the Phillies Franchise Four.

While perhaps not as well liked as Mike Schmidt, Steve Carlton should be a lock also. He won three NL Cy Young Awards with the Phillies and was an All-Star seven times. His 1972 season is legendary. That year, Carlton went 27-10 for a team that won just 59 games. He led the league in wins, ERA (1.97), games started (41), complete games (30), innings pitched (346.3), and strikeouts (310). In the Phillies’ World Series in 1980, Carlton won two games.

Robin Roberts averaged 4.5 WAR per season for the Phillies in his 14 years with the team. He was a workhorse, averaging 267 innings per year and eclipsing the 300-inning mark in six consecutive seasons with the Phillies. Richie Ashburn was a longtime teammate of Roberts who was well known for his defensive prowess but also had good on-base ability (.396 lifetime on-base percentage).

Chuck Klein put up eye-popping numbers during the great hitter’s era of the early 1930s. In his first six years with the Phillies, he averaged 32 homers and 121 RBI per year with a batting line of .359/.412/.632 and was the 1932 NL MVP.

Jim Bunning averaged 6.6 WAR per season in his first four years with the Phillies. This included the heart breaking 1964 season when the Phillies held a 6 ½-game lead with 12 games left to play but lost 10 of their last 12 games and were overtaken by the St. Louis Cardinals.

The two active players on the Phillies ballot are Chase Utley and Jimmy Rollins. Utley and Rollins were part of the Phillies run of playoff teams from 2007 to 2011 that resulted in back-to-back World Series appearances and one World Series title (2008). Utley became a regular in 2005 and reeled off six straight years with 5 or more WAR. Rollins best stretch of play for the Phillies was from 2004 to 2012, during which he averaged 4.2 WAR per season and won the NL MVP Award in 2007.

Notable snub: Most of the Phillies top players are on the ballot with Ed Delahanty being the notable exception. Delahanty is third all-time in WAR for the Phillies but played most of his career before 1900 so would unlikely to get much traction in the voting as a Franchise Four candidate.

My Franchise Four: Mike Schmidt, Steve Carlton, Chase Utley, Robin Roberts


Washington Nationals (1969-2015)

(1) Gary Carter, 53.8 WAR (1974-1984, 1992)

(2) Steve Rogers, 51.5 WAR (1973-1985)

(3) Tim Raines, 49.3 WAR (1979-1990, 2001)

(4) Andre Dawson, 44.3 WAR (1976-1986)

(5) Tim Wallach, 35.3 WAR

(6) Ryan Zimmerman, 34.1 WAR (2005-2015)

(7) Vladimir Guerrero, 33.8 WAR (1996-2003)

(8) Dennis Martinez, 24.3 WAR (1986-1993)

(9) Javier Vazquez, 24.1 WAR

(10) Bryn Smith, 20.9 WAR

(11) Rusty Staub, 18.0 WAR (1969-1971, 1979)


On the ballot: It just doesn’t feel right to me to consider the Montreal Expos and Washington Nationals to be the same franchise. I know it’s true of other franchises, like the Braves who played in Boston, Milwaukee, and Atlanta, and the Athletics, who played in Kansas City and Philadelphia, but it feels different to me. Maybe it’s because the Expos to Nationals change happened in my lifetime and I have read from die-hard Expos fans that their allegiances did not transfer to Washington. The Expos are their team and their team ceased to exist after the 2004 season. Expos fans did not become Nationals fans. Still, this is how the Franchise Four balloting is designed, so we have to consider Steve Rogers along with Ryan Zimmerman.

The top five leaders in war for this franchise are all old Montreal Expos players. One of them, Tim Wallach, did not make the eight-man ballot. At the top of the leaderboard is Gary Carter, who came up as a 20-year-old with the Expos in 1974. Caster had his first really good season in 1977 and that started an extended run of greatness that lasted through the 1986 season. In Carter’s final eight seasons with the Expos, he averaged 6.1 WAR per season as a good-hitting catcher who was also very good behind the dish and had a great arm. Carter’s best season was 1982, when he hit .293/.381/.510 with 29 homers and 97 RBI. He was also very good in the 1981 postseason when he hit .421/.429/.895 in the divisional series then hit .438/.550/.500 in the NLCS that the Expos lost in five games to the Los Angeles Dodgers.

Steve Rogers played his entire 13-year career with Montreal and had nine seasons with 4 or more WAR. He won three games with a 0.98 ERA in three starts during the 1981 postseason.

Tim Raines and Andre Dawson were teammates with the Expos from 1979 to 1986. Although Dawson is in the Hall of Fame, it was Raines who was the more valuable player. Hopefully, he will get into Cooperstown soon. Raines played the first 12 seasons of his career in Montreal then one final partial season late in his career. In his 13 years with the team, Raines hit .301/.391/.437 and stole 635 bases with a success rate of 86%. Dawson averaged 4 WAR per season in his 11 years in Montreal and was the 1977 NL Rookie of the Year.

Dennis Martinez played more years and pitched more innings for the Baltimore Orioles but was a three-time All-Star with the Expos from 1990 to 1992. Vladimir Guerrero was not only a good player with the Expos, he was also very entertaining to watch. He had a rifle arm in the outfield but occasional issues with accuracy that made things interesting. He never saw a pitch he didn’t want to swing at but was still able to consistently post on-base percentages of .370 or higher throughout his Expos’ career. He was a joy to watch.

Ryan Zimmerman is in his 11th season with the Nationals. Injuries have limited him at times during his career. His best stretch of play was in 2009 and 2010 when he had 6.6 WAR each season.

The low man on the Expos/Nationals Franchise Four ballot is Rusty Staub, who ranks 18th all-time in WAR for the franchise. Staub had more plate appearances with three other teams than he had with the Expos but “Le Grand Orange” was the team’s biggest star and most-liked player in the first few years after they came into existence in 1969.

Notable snubs: None, really. Tim Wallach had more WAR than four players on the ballot but all four players below him have good supporting stories behind their placement on the ballot, so it’s understandable that Wallach didn’t make the cut.

My Franchise Four: Gary Carter, Tim Raines, Andre Dawson, Vladimir Guerrero


MLB Franchise Four: NL Central

Major League Baseball has a campaign asking fans to vote for the four “most impactful” players in their team’s history, with the winners being announced at the 2015 All-Star Game in Cincinnati. A panel of experts created an eight-man ballot for each team. This panel consists of MLB’s Official Historian John Thorn and representatives from MLB’s official statistician (the Elias Sports Bureau), MLB.com, MLB Network, and the Baseball Writers’ Association of America.

“Most impactful” is open to interpretation, which makes this an interesting exercise. It isn’t “best” or “most famous” or “most popular”, but “most impactful.” I decided to look at the eight players on the ballot for each franchise and where they rank in FanGraphs WAR during their time with that franchise.

For each franchise, I’ve listed their top 10 in FanGraphs WAR along with any players who are on the ballot who are below the top 10. The players in BOLD are those who are on the ballot and the years listed are the years in which they played for that team.


Chicago Cubs (1871-2015)

(1) Cap Anson, 81.8 WAR

(2) Ron Santo, 71.9 WAR (1960-1973)

(3) Ernie Banks, 63.3 WAR (1953-1971)

(4) Ryne Sandberg, 61.0 WAR (1982-1994, 1996-1997)

(5) Sammy Sosa, 60.7 WAR (1992-2004)

(6) Billy Williams, 58.9 WAR (1959-1974)

(7) Stan Hack, 55.8 WAR

(8) Fergie Jenkins, 53.3 WAR (1966-1973, 1982-1983)

(9)Gabby Hartnett, 52.7 WAR (1922-1940)

(10) Frank Chance, 48.1 WAR

(16) Mordecai Brown, 41.0 WAR (1904-1912, 1916)


On the ballot: Half of the players on the Cubs’ ballot were members of the team in the late 1960s, a rare period of success for the team. From 1967 to 1972 the Cubs never finished lower than third place. Ron Santo, Ernie Banks, Billy Williams, and Fergie Jenkins, all Hall of Fame players, formed the core of those Cubs teams.

Santo provided strong hitting ability with Gold Glove play at third base and is the Cubs’ all-time leader in WAR among players who played for the team post-1900. Ernie Banks won back-to-back NL MVP Awards as a shortstop and was a seven-time All-Star for the Cubs in the late 1950s. He then moved to first base and played in four more All-Star games. Billy Williams manned left field in Wrigley for sixteen years, won the NL Rookie of the Year in 1961, and led the league in hitting in 1972. Fergie Jenkins averaged 301 innings pitched and 20 wins per season from 1967 to 1973, including six years in a row with 20 or more wins. During this stretch he led the league in complete games three times and innings once and finished in the top three in Cy Young voting three times, winning the award for his 1971 season.

Two players of more recent vintage on the Cubs’ ballot are Ryne Sandberg and Sammy Sosa, who were teammates at the end of Sandberg’s career and the early part of Sosa’s career. Sandberg’s best season was in 1984 when he was worth 8 WAR and named NL MVP. He hit .314/.367/.520 with 19 homers and 32 steals while playing above-average defense at second base. The Cubs made the playoffs that year for the first time since 1945 but lost the NLCS to the San Diego Padres in five games. Sandberg was also part of the 1989 Cubs team that made the playoffs but lost to the San Francisco Giants. In 10 playoff games, Sandberg hit .385/.457/.641. Sammy Sosa joined the Cubs in 1992 but only played 67 games. He became a full-time player for the Cubs in 1993 and began a stretch of 10 seasons during which he averaged 5.5 WAR per season. His best year was the 9.9 WAR season of 2001 when he hit .328/.437/.737 with 146 runs, 64 homers, and 160 RBI.

The two old-time players on the ballot are Mordecai “Three Finger” Brown and Gabby Hartnett. Brown pitched for the Cubs during a time when they were one of the top teams in the National League. They went to four World Series in five years from 1906 to 1910, winning twice. During this five-year stretch, Brown averaged 292 innings and 25 wins per season, good for 5.7 WAR per season. During his 19 years with the Cubs, Gabby Hartnett played on four World Series squads. They lost each time, of course, because they’re the Cubs. Hartnett was the 1935 NL MVP.

Notable snubs: Cap Anson is one of three players who leads his franchise in WAR but is not on their team’s ballot. Of course, he played more than 100 years ago and likely would not resonate with today’s voters. He also is considered to have been one of the driving forces in keeping baseball segregated because he refused to take the field with African American players numerous times in his career, so he may not really be a snub. Perhaps one could argue for Frank Chance or Mark Grace having a place on the ballot. Chance was a big part of the Cubs’ World Series teams from 1906 to 1910 and Grace was one of the Cubs’ most popular players in the 1990s.

My Franchise Four: Ernie Banks, Ron Santo, Ryne Sandberg, Billy Williams


Cincinnati Reds (1882-2015)

(1) Pete Rose, 76.2 WAR (1963-1978, 1984-1986)

(2) Johnny Bench, 74.8 WAR (1967-1983)

(3) Barry Larkin, 67.0 WAR (1986-2004)

(4) Bid McPhee, 62.7 WAR

(5) Frank Robinson, 59.6 WAR (1956-1965)

(6) Joe Morgan, 57.2 WAR (1972-1979)

(7) Tony Perez, 49.5 WAR (1964-1976, 1984-1986)

(8) Paul Derringer, 45.6 WAR

(9) Vada Pinson, 42.8 WAR

(10) Edd Roush, 42.0 WAR

(14) Dave Concepcion, 39.7 WAR (1970-1988)

(26) Eric Davis 29.3, WAR (1984-1991, 1996)


On the ballot: “The Big Red Machine” is well represented on the Reds Franchise Four ballot with Pete Rose, Johnny Bench, Joe Morgan, Tony Perez, and Dave Concepcion all making the cut. All five were teammates on the Reds teams that went to three World Series and one NLCS in five years from 1972 to 1976. They won back-to-back championships in 1975 and 1976. In both of those seasons, Joe Morgan was the NL MVP, leading the league in on-base percentage both years. Joe Morgan was quite amazing. In his eight years with the Reds from 1972 to 1979, Morgan averaged 7.2 WAR per season while hitting .288/.415/.470 and playing good defense at second base. Even though Morgan played more games in his career with the Houston Astros, it’s his time with the Reds that made him a first ballot Hall of Famer.

Pete Rose played the first 16 years of his career with the Reds and won the NL Rookie of the Year Award in 1963 and was the NL MVP for his 1973 season. He also played wherever the team needed him. In his career, he played over 500 games at five different positions (1B, LF, 3B, 2B, RF). He came back to the Reds for the final two seasons of his career and broke Ty Cobb’s all-time record for career hits.

Johnny Bench and Tony Perez provided the power to many of the Reds teams in the 1970s. Bench was a two-time NL MVP, winning the award in 1970 and 1972. He led the league in home runs and RBI both seasons and was a terrific defensive catcher. In his prime, Tony Perez made seven All-Star teams as a Reds player. Dave Concepcion didn’t provide the power that Bench and Perez did, but he was a nine-time All-Star who won five Gold Glove Awards.

One of the players in the “non-Big Red Machine” category is Frank Robinson, who came up with the Reds in 1956 and was terrific right from the start, winning the NL Rookie of the Year award and making the All-Star team. He won the NL MVP in 1961 with a .323/.404/.611 batting line. Even though he played more years with the Reds than any other team, Robinson may be better known as a member of the Baltimore Orioles.

Barry Larkin and Eric Davis were teammates in the late 1980s. Larkin had a Hall of Fame, 19-year career with the Reds that included the NL MVP Award in 1995. Eric Davis was immensely talented but injuries prevented him from ever playing more than 135 games in a season.

Notable snubs: None. I don’t think anyone is pining for Bid McPhee or Paul Derringer on the ballot.

My Franchise Four: Joe Morgan, Pete Rose, Johnny Bench, Barry Larkin


Milwaukee Brewers (1969-2015) 

(1) Robin Yount, 66.5 WAR (1974-1993)

(2) Paul Molitor, 56.0 WAR (1978-1992)

(3) Ryan Braun, 32.6 WAR (2007-2015)

(4) Ben Sheets, 32.2 WAR

(5) Cecil Cooper, 29.5 WAR (1977-1987)

(6) Teddy Higuera, 26.8 WAR

(7) Don Money, 26.2 WAR

(8) Jeff Cirillo, 25.9 WAR

(9) Geoff Jenkins, 24.2 WAR

(10) Moose Haas, 22.1 WAR

(14) Prince Fielder, 20.2 WAR (2005-2011)

(16) Jim Gantner, 19.5 WAR (1976-1992)

(17) Gorman Thomas, 19.5 WAR (1973-76, 1978-83, 1986)

(74) Rollie Fingers,  5.1 WAR (1981-1982, 1984-1985)


On the ballot: In their first 39 years of existence, the Milwaukee Brewers made the playoffs twice, in 1981 and 1982. That 1982 team not only made the playoffs but also advanced to the World Series, which they lost in seven games to the St. Louis Cardinals. Six of the eight players on the Brewers’ ballot played on those two postseason teams. Robin Yount, Paul Molitor, Cecil Cooper, and Jim Gantner were teammates for ten seasons from 1978 to 1987 and all but Gantner played in multiple All-Star games during this time. They are also the top four players in games played in Brewers’ history.

Robin Yount won MVP Awards at two positions—shortstop and center field—and had over 3000 hits in his career. Paul Molitor also had over 3000 hits and was an All-Star five times as a Milwaukee Brewer. Cecil Cooper won two Gold Gloves, was a five-time All-Star, and hit .302/.339/.470 for Milwaukee. Jim Gantner was the Ringo of the Brewers’ Fab Four. In 17 years with the team, he was worth 2 or more WAR just four times.

Gorman Thomas did very little in his first four seasons with the Brewers, hitting under .200 three times, but had a good stretch of play from 1978 to 1982 when he averaged 35 home runs and nearly 4 WAR per season. He led the league in home runs twice as a Brewer.

Rollie Fingers was only with the Brewers for four seasons. He led the league in saves in the strike-shortened 1981 season and was effective again in 1982 before being injured. The injury made him unable to pitch in the World Series. He missed all of 1983 but came back to have a good 1984 season (1.96 ERA, 23 saves) that was shortened by a herniated disk in July, then was terrible in 1985 before hanging up his spikes. He’s way down the list for Brewers’ career WAR but his contributions to the Brewers’ first two playoff teams and his top notch mustache will get him some votes.

The other two players on the Brewers’ ballot, Ryan Braun and Prince Fielder, were teammates for five years and played on the two most-recent Brewers’ playoff teams, in 2008 and 2011. Braun came up in 2007 and won the NL Rookie of the Year Award despite playing in just 113 games. In his first six seasons with the team, he made the All-Star team twice, won the Rookie of the Year Award, the 2011 NL MVP, and hit .313/.374/.568 while averaging 34 homers and 21 steals per season. Over the last two full seasons, he’s hit just .275/.339/.466. Prince Fielder was an All-Star three times in his six seasons with the Brewers, led the league in home runs once and RBI once, and had a .282/.390/.540 batting line.

Notable snub: Ben Sheets had more WAR as a Milwaukee Brewer than five guys on the ballot. Sure, he had problems with injuries that limited him during multiple seasons but he was very good when he was healthy and had 4.8 WAR during the 2008 playoff season.

My Franchise Four: Robin Yount, Paul Molitor, Cecil Cooper, Gorman Thomas


Pittsburgh Pirates (1882-2015) 

(1) Honus Wagner, 127.0 WAR (1900-1917)

(2) Roberto Clemente, 80.6 WAR (1955-1972)

(3) Paul Waner, 70.5 WAR (1926-1940)

(4) Arky Vaughan, 63.3 WAR

(5) Willie Stargell, 62.9 WAR (1962-1982)

(6) Bob Friend, 60.0 WAR

(7) Max Carey, 57.7 WAR

(8) Fred Clarke, 50.9 WAR

(9) Babe Adams, 50.2 WAR

(10) Barry Bonds, 48.4 WAR (1986-1992)

(12) Ralph Kiner, 42.2 WAR (1946-1953)

(15) Pie Traynor, 37.8 WAR (1920-1935, 1937)

(23) Bill Mazeroski, 30.9 WAR (1956-1972)


On the ballot: The players on the Pirates Franchise Four ballot span every decade of the 20th century, from Honus Wagner to Barry Bonds. Honus Wagner has significantly more WAR than any other player in Pittsburgh Pirates’ history. The gap between Wagner and Roberto Clemente is 46.6 WAR, good for the third-highest gap between the top two players of any team. Honus Wagner played 18 seasons with the Pirates and averaged 7 WAR per season, including eight seasons with 8 or more WAR. He led the league in hitting eight times, on-base percentage four times, slugging percentage six times, and steals five times. And he did all that damage with the bat while playing shortstop. He’s fifth all-time in FanGraphs WAR, behind only Babe Ruth, Barry Bonds, Willie Mays, and Ty Cobb.

Roberto Clemente came up with the Pirates in 1955, had his first good season in 1958, was injured in 1959, then had a run of greatness from 1960 to 1972, averaging 5.6 WAR per season and helping the Bucs to two World Series titles. Along the way he was a 12-time All-Star, 12-time Gold Glove winner, and won the 1966 MVP. In the 1972 World Series, Clemente hit .414/.452/.759 and was named MVP of the series.

Paul Waner was good in his rookie year of 1926 but really came into his own in the 1927 season when he led the league in average (.380), hits (237), triples (18), RBI (131), and total bases (342). He was the MVP that year and led the Pirates to the World Series, which they lost in four games to the “Murderer’s Row” 1927 Yankees. He would lead the league in hitting two other times during his 15 years with the Pirates and is one of three Pittsburgh players with at least 3000 career hits (along with Wagner and Clemente).

During the 1970s the Pirates had an extended run of success when they made the playoffs six times in 10 years and won two World Series titles. After Roberto Clemente’s death following the 1972 season, Willie Stargell became the heart and soul of the “Lumber Company” Pirates. Stargell’s best year by WAR was 1971 when he hit .295/398/.628 with a league-leading 48 home runs. He was nearly as good in 1973 when he hit .299/.392/.646 and again led the league in home runs (44), and led in RBI also (119). As good as he was in 1971 and 1973, Stargell’s most-celebrated season was in 1979, when he was 39 years old. He was co-MVP of the National League during the regular season, then hit .455/.571/1.182 and was named MVP of the NLCS, and followed that up by winning the World Series MVP Award for his excellent hitting and clutch home runs in a seven-game series victory against the Baltimore Orioles.

Because Wagner, Waner, Clemente, and Stargell were so good, it’s hard to imagine any of the other four players on the ballot making the cut ahead of them. Barry Bonds, of course, was a terrific player with the Pirates. He averaged nearly 7 WAR per season but only played seven of his 22 years with Pittsburgh. His five best seasons by WAR were with the San Francisco Giants. Ralph Kiner only played eight seasons with the Pirates but led the league in home runs during seven of them. He had great power and good on-base abilities but was limited on defense.

At one time, Pie Traynor was considered the best third baseman of his generation, but a look back has diminished his standing historically. During the prime of his career, Traynor averaged 3.4 WAR per season. He was an above-average player but not an all-time great. Bill Mazeroski was a terrific fielding second baseman who never had even a league-average season with the bat (per wRC+). Despite this, he was a seven-time All-Star and part of two World Series-winning teams. His home run in the bottom of the ninth of the seventh game of the 1960 World Series was the first World Series walk-off ever.

Notable snub: Arky Vaughan averaged 6.3 WAR per season over 10 seasons with the Pirates and hit .324/.415/.472 while playing above-average defense at shortstop. Surely he deserves a place on the ballot.

My Franchise Four: Honus Wagner, Roberto Clemente, Willie Stargell, Paul Waner


St. Louis Cardinals (1882-2015)

(1) Stan Musial, 127.0 WAR (1941-1944, 1946-1963)

(2) Rogers Hornsby, 93.5 WAR (1915-1926, 1933)

(3) Bob Gibson, 83.0 WAR (1959-1975)

(4) Albert Pujols, 81.4 WAR (2001-2011)

(5) Ozzie Smith, 59.5 WAR (1982-1996)

(6) Ken Boyer, 50.7 WAR

(7) Ted Simmons, 49.2 WAR

(8) Enos Slaughter, 47.0 WAR

(9) Jim Edmonds, 42.4 WAR

(10) Lou Brock, 41.6 WAR (1964-1979)

(14) Dizzy Dean, 37.1 WAR (1930, 1932-1937)

(25) Red Schoendienst, 29.2 WAR (1945-1956, 1961-1963)


On the ballot: Stan Musial is an icon in St. Louis. He was an amazing player for 22 years with the Cardinals and a baseball ambassador after his career ended. As a player, he was a three-time MVP Award winner, 20-time All-Star, seven-time batting champion, and helped the Cardinals to three World Series titles. Based on FanGraphs WAR, he’s one of the 10 best hitters to ever play the game.

Rogers Hornsby was another Cardinals player who was terrific with the bat. Hornsby played 13 years with the Cardinals and hit .359/.427/,568 with the team. He led the league in hitting six straight years from 1920 to 1925. Over that stretch, he averaged .397/.467/.666 and 10.3 WAR per season.

Bob Gibson and Dizzy Dean are the only two pitchers among the eight players on the Cardinals’ ballot. Gibson’s 1968 season is legendary. He completed 28 of 34 starts, had 13 shutouts, a 1.12 ERA, 0.85 WHIP, and 268 strikeouts in 304 2/3 innings. He was the NL Cy Young and NL MVP. He was the NL Cy Young again in 1970. From 1964 to 1968, Gibson helped the Cardinals make three World Series, winning in 1964 and 1967, with Gibson being named World Series MVP both years. Dizzy Dean’s stretch of greatness came about 30 years before Gibson. Dean was a meteor who shined brightly across the sky but burned out too quickly. From 1932 to 1936, Dean averaged 24 wins, 306 innings pitched, 25 complete games, and a 3.04 ERA during a hitter’s era. He was the NL MVP in the Cardinals’ 1934 World Series-winning season.

Albert Pujols averaged 7.4 WAR per season in his 11 years as a Cardinal. He also won the NL Rookie of the Year Award and three NL MVP Awards, while hitting .328/.420/.617 with an average of 40 home runs per year. Ozzie Smith was a wizard on defense who held his own with the bat. He won 13 consecutive Gold Gloves during his prime. Another well-regarded defensive player on the Cardinals’ ballot is Red Schoendienst. Red doesn’t rank high among the Cardinals’ all-time WAR leaders, but his post-career time as a manager and coach since his retirement has earned him a soft spot in the hearts of Cardinals’ fans.

Lou Brock played 16 years with the Cardinals and led the league in steals during eight of them. He was well regarded during and after his career and made the Hall of Fame in his first year of eligibility, but more advanced metrics suggest he was a very poor fielder for many years and was not as good a player as many thought at the time.

Notable snubs: Ken Boyer is sixth in career WAR for the Cardinals, ahead of Lou Brock, Dizzy Dean, and Red Schoendienst, so he has an argument. He doesn’t have the narrative of the other three, but he was a more valuable player.

My Franchise Four: Stan Musial, Bob Gibson, Albert Pujols, Ozzie Smith


MLB Franchise Four: NL West

Major League Baseball has a campaign asking fans to vote for the four “most impactful” players in their team’s history, with the winners being announced at the 2015 All-Star Game in Cincinnati. A panel of experts created an eight-man ballot for each team. This panel consists of MLB’s Official Historian John Thorn and representatives from MLB’s official statistician (the Elias Sports Bureau), MLB.com, MLB Network, and the Baseball Writers’ Association of America.

“Most impactful” is open to interpretation, which makes this an interesting exercise. It isn’t “best” or “most famous” or “most popular”, but “most impactful.” I decided to look at the eight players on the ballot for each franchise and where they rank in FanGraphs WAR during their time with that franchise.

For each franchise, I’ve listed their top 10 in FanGraphs WAR along with any players who are on the ballot who are below the top 10. The players in BOLD are those who are on the ballot and the years listed are the years in which they played for that team.


Arizona Diamondbacks (1998-2015)

(1) Randy Johnson, 54.9 WAR (1999-2004, 2007-2008)

(2) Luis Gonzalez, 33.8 WAR (1999-2006)

(3) Brandon Webb, 29.1 WAR (2003-2009)

(4) Curt Schilling, 24.9 WAR (2000-2003)

(5) Steve Finley, 18.2 WAR (1999-2004)

(6) Justin Upton, 16.0 WAR

(7) Chris Young, 15.3 WAR

(8) Paul Goldschmidt, 15.0 WAR (2011-2015)

(9) Miguel Montero, 14.1 WAR

(10) Dan Haren, 13.8 WAR

(17) Matt Williams, 8.8 WAR (1998-2003)

(87) Mark Grace, 1.3 WAR (2001-2003)


On the ballot: Six of the eight players on the Diamondbacks Franchise Four ballot played on their 2001 World Series Championship team. Randy Johnson and Curt Schilling were the co-aces of that squad. The Big Unit was 21-6 with a 2.49 ERA and an amazing 372 strikeouts in 249 2/3 innings that season, then won three games in the World Series to share MVP honors with Curt Schilling. He also won the NL Cy Young award in 2001, one of the four he won in four consecutive seasons with the Diamondbacks. In two of those seasons, including 2001, Curt Schilling finished second behind the Big Unit in the NL Cy Young voting. In 2001, Schilling was 22-6 with a 2.98 ERA and 293 strikeouts in 256 2/3 innings, then started three games in the World Series and had a 1.69 ERA in 21 1/3 innings.

Luis Gonzalez provided some serious offense to the Diamondbacks’ 2001 championship team. He had 8.9 WAR that season as he hit .325/.429/.688 with 57 homers and 142 RBI.

Steve Finley was worth 4.6 and 3.3 WAR in his first two seasons with the Diamondbacks in 1999 and 2000, but slipped to 1.6 WAR in the 2001 season. He hit well in the 2001 World Series, though: .368/.478/.526.

Matt Williams was also better in his first two years with the team. He had 2.3 WAR in 1998 and 4.0 WAR in 1999 but was limited by injuries and had just 2.4 WAR total over the final four years of his career with the Diamondbacks.

Brandon Webb had 4.2 WAR in his rookie season in 2003 and was a mainstay in the rotation for the next five years, averaging 5 WAR per season. He won the NL Cy Young award in 2006 with a 16-8, 3.10 ERA season (6.4 WAR). Webb had an amazing ability to generate ground balls, with a GB% of 64.2% in his career. Unfortunately, the end came quickly. Webb was 22-7 with a 3.30 ERA in 2008 and finished second in the Cy Young voting for the second straight year. He then pitched four innings in 2009 and never threw another pitch in the major leagues. He tried to come back in 2011 but lasted just 12 innings in AA and had a 9.75 ERA.

Paul Goldschmidt is currently the best player on the Diamondbacks. He was worth 6.3 WAR in 2013 when he hit .302/.401/.551 and led the league with 36 homers and 125 RBI on his way to finishing second in the NL MVP voting. He was on a similar pace last year with 4.4 WAR in 109 games before his season ended when he was hit by a pitch that fractured his hand. He’s off to a good start to the 2015 season.

There are 86 players who were worth more wins than Mark Grace as a Diamondback. Grace joined the team at the end of his career after 13 seasons with the Cubs. He played three years with the Diamondbacks and was worth 2.6, -0.3, and -0.1 WAR. He was an announcer for the team after his career and is well liked in Arizona, particularly at the team’s annual fantasy camps.

Notable snubs: Based on value, one could argue for Justin Upton or Chris Young. In fact, I believe an argument could be made for any number of players over Mark Grace based on value to the team, but Grace was a very popular player so why not give the fans a chance to remember one of their favorites? I just don’t consider him to be “impactful.”

My Franchise Four: Randy Johnson, Curt Schilling, Luis Gonzalez, Brandon Webb


Colorado Rockies (1993-2015)

(1) Todd Helton, 54.8 WAR (1997-2013)

(2) Larry Walker, 44.4 WAR (1995-2004)

(3) Troy Tulowitzki, 33.7 WAR (2006-2015)

(4) Matt Holliday, 20.2 WAR (2004-2008)

(5) Ubaldo Jimenez, 18.5 WAR

(6) Carlos Gonzalez, 17.5 WAR (2009-2015)

(7) Aaron Cook, 17.5 WAR

(8) Vinny Castilla, 15.5 WAR (1993-1999, 2004, 2006)

(9) Jeff Francis, 14.9 WAR

(10) Andres Galarraga, 13.4 WAR (1993-1997)

(24) Dante Bichette, 6.6 WAR (1993-1999)


On the ballot: Todd Helton leads the Rockies in games played, hits, runs scored, RBI, home runs, doubles, and walks, among other categories. He also had five straight years from 2000 to 2004 with 5.5 or more WAR each season. I would guess he’s an automatic Franchise Four player for the Rockies. Larry Walker is second to Helton in most of those categories and tops the Rockies in career batting average, on-base percentage, and slugging percentage. Walker hit .334/.426/.618 with Colorado.

Troy Tulowitzki, Matt Holliday, and Carlos Gonzalez were part of the only Rockies team to make the World Series, in 2007. On that team, Tulowitzki was in his second year but already one of the best players on the team, as he had 5.2 WAR and hit .291/.359/.479 with great defense at shortstop. Since then, he’s had five more seasons with 5 or more WAR despite being injured a number of times. Matt Holliday had a breakout season in the Rockies’ World Series year with a career-high 6.9 WAR. He followed that with a 5.9 WAR season in 2008 before being traded to the Athletics that winter in a deal that brought Carlos Gonzalez to the Rockies. When healthy, Gonzalez has generally been good with the Rockies but he hasn’t been healthy often enough the last couple years.

Vinny Castilla, Andres Galarraga, and Dante Bichette were teammates in the early years of the Rockies franchise, back in the pre-humidor days. They were part of a cast of hitters known as the “Blake Street Bombers.” Castilla and Galarraga each had three straight years with 40 or more homers from 1996 to 1998. Dante Bichette hit 40 bombs in 1995 and had 141 RBI in 1996. Of course, despite all the home runs these guys hit, they weren’t really all that valuable when you take park effects, base running, and defense into account.

Notable snubs: Considering he had just one season with more than 2 WAR with the Rockies, Dante Bichette could have been left off the ballot, perhaps for Ubaldo Jimenez or Aaron Cook.

My Franchise Four: Todd Helton, Larry Walker, Troy Tulowitzki, Matt Holliday


Los Angeles Dodgers (1884-2015)

(1) Don Sutton, 63.8 WAR

(2) Duke Snider, 63.4 WAR (1947-1962)

(3) Zack Wheat, 62.7 WAR

(4) Pee Wee Reese, 61.3 WAR

(5) Don Drysdale, 59.3 WAR (1956-1969)

(6) Dazzy Vance, 59.0 WAR

(7) Jackie Robinson, 57.2 WAR (1947-1956)

(8) Sandy Koufax, 54.5 WAR (1955-1966)

(9) Ron Cey, 49.9 WAR

(10) Willie Davis, 48.6 WAR

(12) Fernando Valenzuela, 39.4 WAR (1980-1990)

(14) Clayton Kershaw, 38.5 WAR (2008-2015)

(15) Roy Campanella, 38.2 WAR (1948-1957)

(16) Steve Garvey, 36.3 WAR (1969-1982)


On the ballot: The Dodgers are one of three teams whose leader in FanGraphs WAR is not on the eight-man ballot for the team’s Franchise Four. The Dodgers’ leader in WAR is Don Sutton, but he’s not one of the options (Cap Anson of the Cubs and Hanley Ramirez of the Marlins are the other two).

The players on the Dodgers’ ballot can be separated into groups. Three players on the ballot were part of the “Boys of Summer” group from the 1950s: Duke Snider, Jackie Robinson, and Roy Campanella, all three of whom were part of the Brooklyn Dodger teams that went to the World Series five times in eight years from 1949 to 1956. After losing in their first eight attempts to win the World Series going back to the turn of the century, the Dodgers finally won it all in 1955, a year that saw Roy Campanella win his third NL MVP award in five years. Duke Snider finished second to Campy in the NL MVP balloting that year despite leading the league in runs and RBI and posting a better on-base percentage and slugging percentage than Campanella. Jackie Robinson was not the All-Star he had been in the previous six seasons as injuries limited him to 105 games, but he still had a .378 OBP. In the nine years that Snider, Campanella, and Robinson played together from 1948 to 1956, Campy and Snider were All-Stars seven times and Robinson was an All-Star six times.

Sandy Koufax was on the 1955 World Series championship team, but he was not yet SANDY KOUFAX, so he doesn’t really belong with the “Boys of Summer” group (in 1955, he pitched just 41-2/3 innings and walked six batters per nine innings). Koufax teamed up with Don Drysdale to lead the Dodgers of the early-1960s. Don Drysdale had been the Dodgers’ top starting pitcher in the late-1950s before ceding the title to Koufax in the 60s. The pair went to the World Series four times from 1959 to 1966, winning three titles. Drysdale was an eight-time All-Star and the 1962 NL Cy Young winner. Koufax was named to six All-Star teams and won three NL Cy Young awards, including the 1963 season in which he was the NL Cy Young winner and the NL MVP. Over the last four seasons of his career, Koufax was 97-27 with a 1.86 ERA, 0.91 WHIP, and an average of 8.6 WAR per season.

Steve Garvey was the face of the Dodgers in the 1970s. He teamed with Davey Lopes, Bill Russell, and Ron Cey to form a Dodgers infield that played together from 1973 to 1981. Together, they appeared in the World Series four times from 1974 to 1981, winning twice. Garvey was an All-Star for the Dodgers from 1974 to 1981 and won the NL MVP in 1974. The 1981 season was the last time these four players were together and they won the World Series with the help of 20-year-old rookie Fernando Valuenzuela. Fernandomania exploded in Los Angeles in 1981 as the young pitcher led the league in games started, complete games, shutouts, innings, and strikeouts en route to winning the NL Cy Young Award. In his first six full seasons with the Dodgers, which includes the strike-shortened 1981 season, Fernando averaged 5.4 WAR per season. He also averaged over 250 innings per season during this stretch, which could be why he was worth only 9.2 WAR over the remaining 10 seasons of his career.

The only active player on the Dodgers’ ballot is the amazing Clayton Kershaw. Kershaw has won the NL Cy Young Award three times in the last four seasons and was second in the season in which he didn’t win. He was also the NL MVP last year. During this four-year stretch, Kershaw had a 2.11 ERA and 0.95 WHIP and averaged 6.9 WAR per season.

Notable snubs: Don Sutton, the all-time leader in FanGraphs WAR for the Dodgers, must feel snubbed to not see his name on the Franchise Four ballot. He was a teammate of Steve Garvey from 1969 to 1980 and out-WAR’d him 52.1 to 33.2 during those years. If not Sutton, perhaps Pee Wee Reese would have been a better choice than Garvey, as he was also a big part of the “Boys of Summer” Dodgers.

My Franchise Four: Duke Snider, Sandy Koufax, Jackie Robinson, Roy Campanella


San Diego Padres (1969-2015) 

(1) Tony Gwynn, 65.0 WAR (1982-2001)

(2) Jake Peavy, 29.3 WAR (2002-2009)

(3) Dave Winfield, 29.1 WAR (1973-1980)

(4) Randy Jones, 25.4 WAR (1973-1980)

(5) Trevor Hoffman, 25.3 WAR (1993-2008)

(6) Andy Benes, 20.8 WAR

(7) Chase Headley, 20.4 WAR

(8) Adrian Gonzalez, 19.2 WAR (2006-2010)

(9) Gene Tenace, 18.8 WAR

(10) Brian Giles, 18.4 WAR

(17) Nate Colbert, 16.6 WAR (1969-1974)

(208) Steve Garvey, 1.5 WAR (1983-1987)


On the ballot: Among the 30 franchise leaders in WAR, the 35.7 WAR gap between Tony Gwynn at #1 and Jake Peavy at #2 is the sixth largest. Gwynn played for the Padres for 20 seasons, was an All-Star for 16 consecutive years, won eight batting titles, five Gold Gloves, and had over 3000 hits with a .338 lifetime batting average. He was also a member of the only two teams in Padres history to make the World Series (1984 and 1998). You can’t think of the Padres without thinking of Tony Gwynn.

Joining Gwynn as a signature Padres player is Trevor Hoffman, who saved 552 games for the team in 16 seasons. Hoffman’s 601 career saves are second only to Mariano Rivera on the all-time list.

Jake Peavy was the Padres’ top starting pitcher from 2004 to 2008 when he averaged 4.9 WAR per season. He was the NL Cy Young winner in 2007 with a 19-6 record, 2.54 ERA, and 240 strikeouts in 223 1/3 innings.

Dave Winfield and Randy Jones both played for the Padres from 1973 to 1980, a stretch during which the team regularly finished in the bottom half of the NL West standings. Winfield played more years with the Yankees than he did with the Padres and is likely more well known as a Yankee by the average fan. Jones won the 1976 NL Cy Young Award with a 22 win season for the Padres. He had 25 complete games and threw 315 1/3 innings that year.

Adrian Gonzalez started his career with the Texas Rangers but came into his own with San Diego in 2006. From 2007 to 2010, he had four straight years of 30 or more homers and was an All-Star three times. Like Adrian Gonzalez, Nate Colbert had a short but productive career with the Padres. He had two 38-homer seasons with the team in the early 1970s.

Then there’s Steve Garvey. I don’t know who decided to put Steve Garvey on the ballot for the Padres. He ranks 208th all-time in WAR for the Padres and hit .275/.309/.409 in his five years with the team. His best season was worth 1.5 WAR. You have to give him some serious bonus points for being a member of the 1984 team that went to the World Series to think he deserves a spot on the Padres Franchise Four.

Notable snubs: It’s not hard to find a more deserving player for the ballot than Steve Garvey, so take your pick: Gene Tenace (4.7 WAR per season with the Padres), Ken Caminiti (won the NL MVP Award in 1996) or Benito Santiago (1987 NL Rookie of the Year, four-time All-Star with the team) would have been better choices.

My Franchise Four: Tony Gwynn, Trevor Hoffman, Jake Peavy, Adrian Gonzalez


San Francisco Giants (1883-2015) 

(1) Willie Mays, 148.0 WAR (1951, 1952, 1954-1972)

(2) Barry Bonds, 116.0 WAR (1993-2007)

(3) Mel Ott, 111.0 WAR (1926-1947)

(4) Christy Mathewson, 90.0 WAR (1900-1916)

(5) Willie McCovey, 61.4 WAR (1959-1973, 1977-1980)

(6) Juan Marichal, 60.6 WAR (1960-1973)

(7) Bill Terry, 57.0 WAR

(8) Carl Hubbell, 56.5 WAR

(9) Roger Conner, 54.4 WAR

(10) Larry Doyle, 47.1 WAR

(30) Orlando Cepeda, 29.1 WAR (1958-1966)

(48) Buster Posey, 23.9 WAR (2009-2015)


On the ballot: Willie Mays is among a select group of players who are automatic picks for a spot on his team’s Franchise Four. Is there anything he didn’t do as a Giant? He was the Rookie of the Year, a two-time MVP, a 20-time All-Star, 12-time Gold Glove winner, led the league in homers four times, steals four times, hitting once, on-base percentage twice, and slugging five times. And the numbers don’t do him justice. He was an amazing player to watch, whether making an amazing catch in the deepest parts of the Polo Grounds or flying around the bases for a stand-up triple. He was baseball poetry.

Barry Bonds had 116 WAR in 15 seasons with the Giants, an average of 7.7 WAR per season. He had five seasons with 10 or more WAR, including back-to-back seasons in 2001 and 2002 when he had 12.5 and 12.7 WAR. From 2001 to 2004, he turned the major leagues into his own personal video game, hitting .349/.559/.809 with 209 homers in 1642 at-bats (one HR every 7.9 at-bats).

Mel Ott was a Giants’ lifer, spending 22 years with the team and hitting 511 home runs. He went to the All-Star game for 11 straight years from 1934 to 1944.

Christy Mathewson and Juan Marichal are the only pitchers among the eight players on the ballot for the Giants. Mathewson was part of four Giants’ teams that went to the World Series from 1905 to 1913 and he led the league in wins four times and ERA five times during that stretch. He pitched three complete game shutouts in the 1905 World Series against the Philadelphia Athletics. Juan Marichal pitched for the Giants from 1960 to 1973 and was teammates with Willie McCovey and Orlando Cepeda, who join him on the ballot. All three were members of the 1962 team that lost the World Series in seven games to the New York Yankees. Marichal and Cepeda were All-Stars during that season, while McCovey was still trying to crack a loaded Giants’ lineup.

The only active player on the ballot for the Giants is Buster Posey. All he’s done in his career is helped the Giants to three World Series titles in his first six years in the big leagues, along with a Rookie of the Year Award in 2010 and an NL MVP Award in 2012.

Notable snubs: A couple of famous (and valuable) Giants players who could have arguments for a spot on the ballot are Bill Terry and Carl Hubbell, who were teammates in the late 1920s and early 193s.

My Franchise Four: Willie Mays, Barry Bonds, Mel Ott, Christy Mathewson


MLB Franchise Four: AL East

Major League Baseball has a campaign asking fans to vote for the four “most impactful” players in their team’s history, with the winners being announced at the 2015 All-Star Game in Cincinnati. A panel of experts created an eight-man ballot for each team. This panel consists of MLB’s Official Historian John Thorn and representatives from MLB’s official statistician (the Elias Sports Bureau), MLB.com, MLB Network, and the Baseball Writers’ Association of America.

“Most impactful” is open to interpretation, which makes this an interesting exercise. It isn’t “best” or “most famous” or “most popular”, but “most impactful.” I decided to look at the eight players on the ballot for each franchise and where they rank in FanGraphs WAR during their time with that franchise.

For each franchise, I’ve listed their top 10 in FanGraphs WAR along with any players who are on the ballot who are below the top 10. The players in BOLD are those who are on the ballot and the years listed are the years in which they played for that team.


Boston Red Sox (1901-2015)


(1) Ted Williams, 130.4 WAR (1939-1942, 1946-1960)

(2) Carl Yastrzemski, 94.8 WAR (1961-1983)

(3) Roger Clemens, 76.5 WAR

(4) Wade Boggs, 70.8 WAR

(5) Dwight Evans, 64.3 WAR (1972-1990)

(6) Cy Young, 54.8 WAR (1901-1908)

(7) Tris Speaker, 54.4 WAR

(8) Bobby Doerr, 53.3 WAR

(9) Pedro Martinez, 52.6 WAR (1998-2004)

(10) Jim Rice, 50.8 WAR (1974-1989)

(11) David Ortiz, 41.3 WAR (2003-2015)

(16) Carlton Fisk, 38.3 WAR (1969, 1971-1980)


On the ballot: It’s pretty amazing to think about Ted Williams and Carl Yastrzesmki manning left field for the Red Sox from 1939 to 1980, other than the few years Williams missed time because of his service to the military. For nearly 40 years, two all-time great players held down that spot in front of the Green Monster. Williams, of course, is one of the greatest hitters in baseball history who is 10th all-time in FanGraphs WAR. He hit .344/.482/.634 in his 19-year career and led the league in on-base percentage 12 times. He won two AL MVP Awards and arguably should have won more (he finished second the year he hit .406). Carl Yastrzemski was also very good during his 23-year career with the Sox. He had over 3400 hits, was an All-Star 18 times, won seven Gold Gloves, and was the AL MVP and Triple Crown winner in 1967. You can’t have a Red Sox Franchise Four without Teddy Ballgame and Yaz.

It’s interesting that Dwight Evans made the eight-man ballot despite getting little support in three years on the Hall of Fame ballot. He deserved better in the voting for the Hall of Fame. Evans is 14th all-time among right fielders in WAR, ahead of Hall of Famers Tony Gwynn, Dave Winfield, and Andre Dawson. It’s nice to see him on the ballot here.

Cy Young only pitched for the Red Sox for eight years but had 54.8 WAR during that time thanks in part to an average of 341 innings pitched per season. Those were different times. It makes for an interesting comparison with Pedro Martinez, who pitched for the Red Sox for seven years and had 52.6 WAR despite averaging just 198 innings per season. Pedro won his first Cy Young in his last season with the Montreal Expos in 1997. He joined the Red Sox in 1998 and won back-to-back Cy Young Awards in 1999 and 2000. Over these two seasons, Martinez was at his absolute best, going 41-10 with a 1.90 ERA and 0.83 WHIP. FanGraphs has him worth 11.7 and 9.5 WAR for those two seasons. Pedro was also part of the 2004 Red Sox team that won their first World Series since 1918.

Jim Rice was a Red Sox slugger in the 1970s and 1980s and David Ortiz is a Red Sox slugger currently and they have been worth similar value in their years with the team. Rice averaged 3.2 WAR per season during his 16 years with the Red Sox. Ortiz has averaged 3.4 WAR per season in the first 12 full seasons of his Red Sox career. Ortiz has the added narrative of three World Series championships, including a World Series MVP award in 2013, while Rice was part of two Red Sox teams that went to the World Series but lost both times (1975 and 1986). Carlton Fisk was a teammate of Rice in that 1975 series and is famous for his game-winning home run in the bottom of the 12th inning of Game Six. He actual played more years with the Chicago White Sox than the Boston Red Sox.

Notable snubs: Roger Clemens pitched more years and had more WAR for the Red Sox than Cy Young or Pedro Martinez, yet is conspicuously absent from the eight-man ballot. Wade Boggs had over 2000 hits and a .338/.428/.462 batting line with the Red Sox. Clemens and Boggs are third and fourth all-time in WAR for the Red Sox, which is better than six of the eight players who are on the ballot.

My Franchise Four: Ted Williams, Carl Yastrzemski, Pedro Martinez, David Ortiz


New York Yankees (1901-2015)

(1)Babe Ruth, 149.9 WAR (1920-1934)

(2) Lou Gehrig, 116.3 WAR (1923-1939)

(3) Mickey Mantle, 112.3 WAR (1951-1968)

(4) Joe DiMaggio, 83. WAR 1 (1936-1942, 1946-1951)

(5) Derek Jeter, 71.6 WAR (1995-2014)

(6) Yogi Berra, 63.8 WAR (1946-1963)

(7) Andy Pettitte, 58.0 WAR

(8) Bill Dickey, 56.1 WAR

(9) Whitey Ford, 54.9 WAR (1950, 1953-1967)

(10) Willie Randolph, 51.4 WAR

25) Mariano Rivera, 39.8 WAR (1995-2013)


On the ballot: The Yankees have such an abundance of good candidates for their Franchise Four that it will be difficult for voters to figure out who to include and who gets left out. It’s hard to imagine a Yankees Franchise Four without Babe Ruth, Lou Gehrig, Mickey Mantle, or Joe DiMaggio, but the current generation of Yankees fans will likely want a spot for Derek Jeter and, perhaps, Mariano Rivera.

Then you have Yogi Berra, a Hall of Fame catcher who won 10 World Series rings as a player and two more as a coach with the Yankees in the 1970s (and one as a coach with the 1969 Mets). Whitey Ford played with Berra for many years and was on 11 World Series teams, won six titles, and was World Series MVP in 1961. His career World Series ERA is 2.71.

Based on FanGraphs WAR, Babe Ruth is the greatest player in baseball history. In the context of his time what he did on the field was simply unreal. He led the league in on-base percentage 10 times, home runs 12 times, and slugging percentage 13 times. The Yankees went to the World Series seven times in his 15 years with the team, winning four world championships as Ruth hit .326/.470/.744 in World Series play.

Lou Gehrig batted right behind Ruth for many of those years and hit .340/.447/.632 in his career while leading the league in home runs three times and RBI five times. Like Ruth, Gehrig was very good in World Series play, hitting .361/.483/.731 in 34 World Series games.

Other than three years spent in the military during World War II, Joe DiMaggio was the Yankees’ centerfielder from 1936 to 1951. Mickey Mantle continued the run of great center field play for the Yankees into the 1960s. Both DiMaggio and Mantle were three-time AL MVPs and they have 16 World Series rings between them.

Derek Jeter won five World Series titles in a 20-year career that included 14 All-Star games, a Rookie of the Year Award, and over 3400 career hits.

Mariano Rivera is only 25th in WAR for the Yankees but he’s the best closer in baseball history, won five World Series rings with the Yankees, and has a 0.70 ERA in 141 career post-season innings. There are just too many good players to choose from on the Yankees.

Notable snubs: None, really. One could argue that Mariano Rivera’s place so far down the list of career WAR for the Yankees makes him less worthy than Bill Dickey or Andy Pettitte, but he was a major part of five World Series championships and almost unhittable in high leverage situations in postseason play.

My Franchise Four: Babe Ruth, Lou Gehrig, Mickey Mantle, Joe DiMaggio


Baltimore Orioles (1901-2015) 

(1) Cal Ripken, Jr., 92.5 WAR (1981-2001)

(2) Brooks Robinson, 80.2 WAR (1955-1977)

(3) Jim Palmer, 59.1 WAR (1965-1967, 1969-1984)

(4) Eddie Murray, 56.7 WAR (1977-1988, 1996)

(5) George Sisler, 49.8 WAR

(6) Mike Mussina, 47.8 WAR

(7) Bobby Wallace, 41.7 WAR

(8) Boog Powell, 40.1 WAR (1961-1974)

(9) Ken Williams, 38.6 WAR

(10) Harlond Clift, 37.4 WAR

(11) Paul Blair, 36.4 WAR (1964-1976)

(13) Dave McNally, 34.0 WAR (1962-1974)

(15) Frank Robinson, 33.4 WAR (1966-1971)


On the ballot: The eight players on the Orioles Franchise Four ballot are divided between the players on the very good Baltimore teams of the late 1960s and early 1970s—Brooks Robinson, Jim Palmer, Boog Powell, Paul Blair, Dave McNally, and Frank Robinson—and two players who were part of the good Orioles teams in the early 1980s—Cal Ripken, Jr., and Eddie Murray.

Brooks Robinson and Paul Blair were defensive standouts for the Orioles teams that went to the World Series four times in six years from 1966 to 1971 (winning two championships). Robinson won Gold Gloves in 16 consecutive seasons from 1960 to 1974. Paul Blair won seven consecutive Gold Gloves and eight in nine seasons from 1967 to 1975.

Jim Palmer and Dave McNally were starting pitchers on those great Orioles teams, including the 1971 team that had four 20-game winners. Palmer led the league in innings pitched four times and ERA twice and won three AL Cy Young Awards in four years from 1973 to 1976.

Boog Powell and Frank Robinson brought the lumber for the O’s in those years. Powell was the AL MVP in the 1970 season when the O’s won the World Series and was second in MVP voting in 1969. Over those two years he hit .300/.398/.554 and averaged 36 homers and 118 RBI. Frank Robinson was the AL MVP in the Orioles’ 1966 championship year when he hit .316/.410/.637 with 49 homers and 122 RBI. At the end of his playing career, Robinson became the first African American to manage in major league baseball. He managed for four different MLB teams, including the Baltimore Orioles from 1988 to 1991.

Eddie Murray and Cal Ripken, Jr. were key contributors to the good Baltimore Orioles teams of the early 1980s. Eddie Murray was part of the Orioles team that lost the 1979 World Series to the “We R Fam-a-lee” Pittsburgh Pirates in seven games. The O’s finished second in 1980. Cal Ripken, Jr. came up in 1981 and the team finished second in the AL East in his first two seasons with the team, then made the playoffs and the World Series in 1983, beating the Phillies in five games. Ripken played 21 years with the Orioles, was an All-Star 19 times, an MVP twice, and won the 1982 AL Rookie of the Year Award.

Notable snubs: Mike Mussina should be one of the starting pitchers on the fictional “Bobby Grich All-Underappreciated team.” He’s 16th all-time in WAR for pitchers, ahead of numerous Hall of Famers, yet has received just 20.3% and 24.6% of the vote in his first two years on the ballot. And, true to form, he is not one of the eight players on the ballot for the Orioles Franchise Four despite having more career WAR as an Oriole than four of the players who made the ballot.

My Franchise Four: Cal Ripken, Jr., Brooks Robinson, Jim Palmer, Eddie Murray


Toronto Blue Jays (1977-2015)

(1) Roy Halladay, 49.1 WAR (1998-2009)

(2) Dave Stieb, 44.0 WAR (1979-1992, 1998)

(3) Tony Fernandez, 35.1 WAR (1983-90, 1993, 1998-99, 2001)

(4) Carlos Delgado, 34.7 WAR (1993-2004)

(5) Jose Bautista, 29.7 WAR (2008-2015)

(6) Jesse Barfield, 29.6 WAR

(7) Jim Clancy, 28.7 WAR

(8) Jimmy Key, 28.2 WAR

(9) Vernon Wells, 24.6 WAR

(10)Lloyd Moseby, 24.6 WAR

(15) Roberto Alomar, 20.4 WAR (1991-1995)

(16) George Bell, 20.2 WAR (1981, 1983-1990)

(49) Joe Carter, 7.4 WAR (1991-1997)


On the ballot: After joining the American League as an expansion club in 1977, it took until 1985 for the Blue Jays to make the playoffs for the first time. Dave Stieb was the best pitcher on the Blue Jays during the 1980s. At his best he averaged 4.6 WAR per season from 1980 to 1985. As good as Stieb was in the 80s, Roy Halladay was that guy in the 2000s, although the Jays never made the playoffs during Halladay’s time with the team. Halladay was a six-time All-Star for the Blue Jays and won the AL Cy Young award in 2003.

Tony Fernandez had four different stints with the Blue Jays and hit well in three different American League Championship Series and the 1993 World Series. He was a teammate of George Bell from 1983 to 1990. Bell’s best year was his AL MVP season of 1987 when he hit .308/.352/.605 with 47 dingers and 134 ribbies (worth 5.3 WAR).

Carlos Delgado had two regular season plate-appearances on the Blue Jays’ 1993 championship team and did not play in the post-season. He didn’t do much at the big league level in 1994 or 1995 but broke out in 1996 with a 25-homer, 92-RBI season and was at his best in 2000 when he had 7.4 WAR, hitting .344/.470/.664.

The only two players on the Blue Jays’ eight-man ballot who were on both of the Blue Jays world championship teams are Roberto Alomar and Joe Carter. Alomar was the MVP of the ALCS in 1992 and Joe Carter hit his famous game-winning home run off Mitch “Wild Thing” Williams that won the 1993 World Series. Despite his World Series heroics, Carter is 49th in career WAR for the Blue Jays and was worth negative WAR in his last three years with the team.

The one active player on the Blue Jays’ ballot is Jose Bautista, who joined the Blue Jays in 2008 and broke out big time in 2010 with a 54-homer season, then followed that up with a 43-homer season in 2011, leading the league both years. As good as he’s been in his seven-plus years with the team, last year was the first time they finished higher than third in their division since he’s been a Blue Jay.

Notable snubs: Well, Joe Carter has his signature moment with the Blue Jays, but his body of work with the team is unimpressive. He has less WAR as a Blue Jay than Roy Howell, Ricky Romero, and one of the Alex Gonzalezes, among many others (does it matter which Alex Gonzalez? No). Perhaps Jon Olerud would have been a better choice for the ballot than Carter. Olerud was part of the two Blue Jays World Series teams and led the league in hitting and on-base percentage with a .363/.473/.599 line in 1993.

My Franchise Four: Roy Halladay, Dave Stieb, Tony Fernandez, Roberto Alomar


Tampa Bay Rays (1909-2015) 

(1) Evan Longoria, 39.2 WAR (2008-2015)

(2) Carl Crawford, 36.7 WAR (2002-2010)

(3) Ben Zobrist, 35.0 WAR (2006-2014)

(4) James Shields, 24.0 WAR (2006-2012)

(5) David Price, 23.8 WAR (2008-2014)

(6) B.J. “Melvin” Upton, 22.3 WAR (2004, 2006-2012)

(7) Scott Kazmir, 15.5 WAR (2004-2009)

(8) Carlos Pena, 14.1 WAR (2007-20010, 2012)


On the ballot: All but one of these players is still active in the major leagues but only Evan Longoria is still with the Rays. He’s an easy pick for the Tampa Bay Rays Franchise Four with 5 or more WAR in five of his first seven full seasons with the team. In the years before Evan Longoria arrived, Carl Crawford was the Rays’ best player. He played nine full seasons in Tampa and had five seasons with 4.5 or more WAR, including a very good 7.7 WAR season in 2010.

Ben Zobrist ranks just below Crawford on the Rays leaderboard. It took Zobrist a few years to get going. He was on the 2008 team that lost the World Series to the Philadelphia Phillies but was not yet a full-time player. He broke out in a big way in 2009, amassing 8.6 WAR as he hit .297/.405/.543 and played great defense at multiple positions. He continued to be one of the team’s best players until his trade to the Athletics last offseason.

James Shields was the Rays’ #1 starter on their 2008 World Series team and David Price was a rookie on that squad who pitched very well in the postseason. They are very close in career WAR in their time with the Rays but Shields accumulated his 24.0 WAR in 1454.7 innings, while Price had 23.8 WAR in 1143.7 innings. Price also had more All-Star appearances and won a Cy Young in 2012.

With his most-recent two seasons being so incredibly bad, it’s easy to forget that B.J. Upton was an above-average player for six years with the Rays from 2007 to 2012.

Scott Kazmir and Carlos Pena are a good deal behind the other six players on the ballot in WAR, but they each had their moments with the Rays. Kazmir was a two-time All-Star and Carlos Pena led the league in home runs in 2009.

Notable snub: None. The eight players on the ballot for the Tampa Bay Rays Franchise Four are the top eight players in career WAR for the team. The next-highest WAR total belongs to Julio Lugo and no one wants Julio Lugo on the ballot except maybe his mother, but definitely not his ex-wife.

My Franchise Four: Evan Longoria, Carl Crawford, Ben Zobrist, David Price


MLB Franchise Four: AL Central

Major League Baseball has a campaign asking fans to vote for the four “most impactful” players in their team’s history, with the winners being announced at the 2015 All-Star Game in Cincinnati. A panel of experts created an eight-man ballot for each team. This panel consists of MLB’s Official Historian John Thorn and representatives from MLB’s official statistician (the Elias Sports Bureau), MLB.com, MLB Network, and the Baseball Writers’ Association of America.

“Most impactful” is open to interpretation, which makes this an interesting exercise. It isn’t “best” or “most famous” or “most popular”, but “most impactful.” I decided to look at the eight players on the ballot for each franchise and where they rank in FanGraphs WAR during their time with that franchise.

For each franchise, I’ve listed their top 10 in FanGraphs WAR along with any players who are on the ballot who are below the top 10. The players in BOLD are those who are on the ballot and the years listed are the years in which they played for that team.


Cleveland Indians (1901-2015)


(1) Nap Lajoie 74.9 WAR (1902-1914)

(2) Tris Speaker 72.6 WAR (1916-1926)

(3) Lou Boudreau 63.1 WAR (1938-1950)

(4) Bob Feller 62.6 WAR (1936-1941, 1945-1956)

(5) Earl Averill 47.7 WAR (1929-1939)

(6) Mel Harder 47.6 WAR

(7) Jim Thome 46.3 WAR (1991-2002, 2011)

(8) Sam McDowell 45.6 WAR

(9) Larry Doby 45.0 WAR (1947-1955, 1958)

(10) Stan Coveleski 43.7 WAR

(31) Omar Vizquel 27.6 WAR (1994-2004)


On the ballot: All but two players on the ballot for Cleveland had their careers end before 1960. This is a ballot for an older generation and no one goes back farther than Nap Lajoie, whose time with the Indians ended more than 100 years ago. From 1902 to 1914, he led the league in hitting four times and finished with a .339 career average with the team. In fact, he was so good the team was known as the Cleveland Naps from 1903 to 1914.

Tris Speaker started his career with the Boston Red Sox, then joined the Indians in 1916 at the age of 28 and immediately led the AL in hitting with a .386 batting average. He also led the league in on-base percentage (.470) and slugging percentage (.502). He was well known for his defensive abilities in addition to his strong bat and averaged 6.6 WAR per season with the Indians.

Lou Boudreau was the player-manager and MVP of the 1948 Indians, the last Cleveland team to win a World Series. Bob Feller was also on that 1948 squad. Feller pitched 62 innings as a 17-year-old with the 1936 Cleveland Indians. From 1938 to 1941, Feller was a four-time All-Star and averaged 23 wins and 309 innings per season. He then missed three-and-a-half seasons to military service, which very likely prevented him from winning 300 games in his career (he had 266). He was back in the Indians’ rotation full-time in 1946 and pitched 371 1/3 innings with 348 strikeouts and a 2.18 ERA. He was worth 10 WAR that season. Feller was visible after his playing career ended and much-loved in Cleveland with frequent appearances at memorabilia conventions.

Earl Averill played for the Indians from 1929 to 1939. The team never finished higher than third during his tenure, but he was an All-Star for six straight years in his 11 years with the team.

I’ve always felt Larry Doby should be honored right along with Jackie Robinson on April 15th each year. Jackie Robinson was the first African-American to play in the modern major leagues when he debuted with the Dodgers on April 15, 1947, but it gets forgotten that Larry Doby debuted with the Indians less than three months later and dealt with the same racist attitudes and actions that Jackie Robinson did. Doby was just a part-time player his first year with the Indians but soon became a perennial All-star with the team.

Jim Thome and Omar Vizquel are the only two players on the ballot who played for the team in the last 50 years. They were on the very good Cleveland teams of the mid 1990s that made the playoffs five straight years and six times in seven years, including two losing World Series appearances.

Notable ballot snub: Kenny Lofton is 11th on the all-time WAR list for the Indians and was an under-appreciated part of those good Cleveland teams in the mid-1990s (except for 1997, when he was with Atlanta). He’s 20 spots higher than Omar Vizquel with almost 16 more WAR than Vizquel had with the team, but did not get a spot on the eight-man ballot.

My Franchise Four: Nap Lajoie, Lou Boudreau, Bob Feller, Jim Thome


Kansas City Royals (1969-2015)


(1) George Brett 84.6 WAR (1973-1993)

(2) Amos Otis 42.0 WAR (1970-1983)

(3) Kevin Appier 41.8 WAR

(4) Mark Gubicza 40.1 WAR

(5) Bret Saberhagen 38.5 WAR (1984-1991)

(6) Willie Wilson 35.2 WAR (1976-1990)

(7) Dennis Leonard 34.5 WAR

(8) Paul Splittorff 33.2 WAR

(9) Frank White 31.1 WAR (1973-1990)

(10) Hal McRae 27.6 WAR (1973-1987)

(11) Alex Gordon 27.0 WAR (2007-2015)

(25) Dan Quisenberry 14.4 WAR (1979-1988)


On the ballot: Some players should be automatic Franchise Four players for the team they played with. One of those players is George Brett with the Kansas City Royals. He played 21 years with the team, has almost twice the WAR of the next-highest player, and was with the team during the most successful years of the franchise, including seven of the eight years in team history that the Royals made the post-season. The gap between Brett and Amos Otis is the fourth highest for any top two players on their team’s all-time WAR leaderboard. Brett was a 13-time All-Star for the Royals and won the AL MVP Award in 1980 when he hit .390/.454/.664. He had over 3000 hits and 1500 RBI in his career. His postseason numbers are even more impressive than his regular season numbers: .337/.397/.627. Brett is as automatic as can be for a Franchise Four candidate.

Willie Wilson, Frank White, and Hal McRae were teammates of Brett during all seven years the team made the playoffs from 1976 to 1985, while Amos Otis was there for the first five of those post-season years. Wilson was the leadoff hitter who hit .294/.331/.387 with an average of 51 steals over the ten years of his prime from 1979 to 1988. Frank White won six consecutive Gold Gloves from 1977 to 1982. Hal McRae was a two-time All-Star who hit .293/.356/.458 with the Royals in his career. Amos Otis provided strong defense in center field, was a five-time All-Star, and won three Gold Gloves.

The two pitchers on the ballot are Dan Quisenberry and Bret Saberhagen. Quisenberry came aboard in 1979 and led the AL in saves five times in six years in the early 1980s and finished in the top five in AL Cy Young voting five times. He was known for his submarine pitching and quirky sayings (“I found a deliver in my flaw”) and was one of the most popular players on the team in the early 1980s. Bret Saberhagen showed up in 1984, then was the AL Cy Young winner on the 1985 World Series Champion Kansas City Royals. He won two games against the Cardinals and was named World Series MVP.

Alex Gordon is the only current player on the ballot. He has nearly the same WAR as Hal McRae in their respective time with the Royals but he doesn’t have the multiple playoff series that so many of the guys on the ballot have.

Notable snubs: There isn’t necessarily a snub here because all of the players on the ballot have either quality play or a good narrative behind their selection, or both, but Kevin Appier and Mark Gubicza provided more value to the Royals than six of the players who made the ballot.

My Franchise Four: George Brett, Amos Otis, Bret Saberhagen, Willie Wilson


Detroit Tigers (1901-2015)


(1) Ty Cobb 143.4 WAR (1905-1926)

(2) Al Kaline  88.9 WAR (1953-1974)

(3) Charlie Gehringer 78.6 WAR (1924-1942)

(4) Lou Whitaker 68.1 WAR

(5) Harry Heilmann 64.4 WAR

(6)Alan Trammel 63.7 WAR (1977-1996)

(7) Mickey Lolich 62.0 WAR

(8) Hal Newhouser 60.4 WAR

(9) Sam Crawford 60.1 WAR (1903-1917)

(10) Hank Greenberg 57.9 WAR (1930, 1933-1941, 1945-1947)

(16) Justin Verlander 43.5 WAR (2005-2014)

(18) Miguel Cabrera 39.9 WAR (2008-2015)


 On the ballot: There are some players who are “no-doubters” when it comes to this Franchise Four exercise. George Brett is one for the Royals. For the Tigers, I believe there are three—Ty Cobb, Al Kaline, and Charlie Gehringer. Not only do all three players sit atop the Tigers’ WAR leaderboard, they all have long career with the team. Al Kaline and Charlie Gehringer played their entire careers in Detroit, while Cobb played his final two seasons with the Philadelphia Athletics, but is deeply associated with the Tigers in the early part of the 20th century.

Ty Cobb is ranked fourth all-time in FanGraphs WAR, with 149.3, just 0.6 behind Willie Mays. He led the league in hitting 12 times in 13 years from 1907 to 1919 and had a .377 batting average during this stretch. He also led the league in on-base percentage seven times and slugging percentage eight times. He had three years with more than 10 WAR, with 1917 being his best, at 11.5 WAR, when he hit .383/.444/.570 (200 wRC+). The 54.5 WAR gap between Cobb and Al Kaline is the largest gap between any top-ranked player over the second-best player of any franchise in baseball.

In his 20-year career with the Tigers, Al Kaline only reached the postseason twice, but this included the 1968 season when the Tigers won their first World Series in 23 years. Even though he had only played 102 games during the 1968 regular season, Kaline played all seven games of the 1968 World Series and hit .379/.400/.655. At his best, Kaline was an All-Star every year from 1955 to 1967 and won 10 Gold Gloves for his defense in right field.

Charlie Gehringer spent 19 years with the Tigers and saw postseason action three times, including a World Series title in 1935. In his prime, Gehringer rarely missed a game and hit for a high average with a good on-base percentage while playing strong defense at second base. His career batting line is .320/.404/.480.

Beyond those three it becomes difficult to pick a fourth for the Tigers. Alan Trammel is another Tiger player who never left Detroit, and he won a World Series title in 1984. Hank Greenberg played all but one of his 13 seasons in the big leagues with the Tigers and was part of the 1935 World Series titlists. Sam Crawford was a big part of three straight World Series teams for the Tigers from 1907 to 1909.

The contemporary Tigers on the ballot, Justin Verlander and Miguel Cabrera, are pretty far down the list of WAR leaders for this franchise but will add to their totals in the years to come. Current voters might be tempted to vote for one or both of them, but they don’t really compare with the players above them on the Tigers’ ballot just yet.

Notable snub: Like Bobby Grich, Lou Whitaker is criminally underrated. He ranks just below Grich on the all-time WAR leaderboard for second basemen and, like Grich, was “one-and-done” in Hall of Fame balloting (2.9% in 2001). He’s fourth all-time among Tigers’ players in WAR, yet is not on the ballot, while his longtime double-play partner, Alan Trammel, is on the ballot.

My Franchise Four: Ty Cobb, Al Kaline, Charlie Gehringer, Alan Trammell


Minnesota Twins (1901-2015)


(1) Walter Johnson 117.9 WAR (1907-1927)

(2) Harmon Killebrew 66.3 WAR (1954-1974)

(3) Rod Carew 56.9 WAR (1967-1978)

(4) Bert Blyleven 55.8 WAR (1970-1976, 1985-1988)

(5) Jim Kaat 53.3 WAR (1959-1973)

(6) Sam Rice 50.3 WAR

(7) Camilo Pascual 48.1 WAR

(8) Joe Judge 45.6 WAR

(9) Kirby Puckett 44.9 WAR (1984-1995)

(10) Joe Mauer 44.8 WAR (2004-2015)

(11) Goose Goslin 42.2 WAR

(12) Tony Oliva 40.7 WAR (1962-1976)


On the ballot: It’s definitely strange to see Walter Johnson on top of the Twins’ WAR leaderboard because he, of course, played for the Washington Senators long before the team moved to Minnesota before the 1961 season. Because he never wore a Twins jersey, it will be interesting to see if the voting fans consider him a Franchise Four player. Johnson is fourth in career FanGraphs WAR, just behind Greg Maddux and ahead of Randy Johnson.

Harmon Killebrew was a Washington Senator for the first seven years of his career but then played another fourteen years as a Twin before one final year with the Royals. Killebrew led the American League in home runs five times as a Twin, including three years in a row when he hit 48, 45, and 49 bombs from 1962 to 1964.

Rod Carew led the AL in hitting seven times as a member of the Twins, including a stretch where he led the league in hitting six times in seven years. He also led the league in on-base percentage four times in five years.

Bert Blyleven had two stints with the Twins during his playing career and is third in wins all-time for the franchise. He’s also been an announcer for the team since 1996 (“Circle me, Bert!”) and was recently elected to the Hall of Fame. A teammate of Blyleven for four years in the early 1970s, Jim Kaat won the second-most games in Twins’ history. He played 15 of his 25 years with the team.

Kirby Puckett was a roly-poly fan favorite in the Metrodome through the last half of the 1980s and first half of the 90s. He was an All-Star in each of the last 10 years of his career and helped the Twins win two World Series Championships before glaucoma caused him to lose vision in his right eye, which ended his career. He hit .314/.379/.515 (123 wRC+) in his final year with the team.

Joe Mauer has played the first 12 years of his career with the Twins and is signed through 2018. He has three batting titles and an MVP award.

Finally, Tony Oliva was a Twins’ All-Star from 1964 to 1971 and led the league in hits five times.

Notable snubs: None.

My Franchise Four: Walter Johnson, Harmon Killebrew, Bert Blyleven, Kirby Puckett


Chicago White Sox (1901-2015)


(1) Luke Appling 72.7 WAR (1930-1943, 1945-1950)

(2) Frank Thomas 68.1 WAR (1990-2005)

(3) Eddie Collins 64.6 WAR (1915-1926)

(4) Red Faber 54.7 WAR

(5) Ted Lyons 54.6 WAR

(6) Billy Pierce 51.0 WAR

(7) Ed Walsh 49.2 WAR

(8) Nellie Fox 43.8 WAR (1950-1963)

(9) Minnie Minoso 41.8 WAR (1951-1957, 1960-1961, 1964, 1976, 1980)

(10) Mark Buehrle 40.1 WAR

(17) Luis Aparicio 32.0 WAR (1956-1962, 1968-1970)

(26) Harold Baines 24.5 WAR (1980-1989, 1996-1997, 2000-2001)

(28) Paul Konerko 23.6 WAR (1999-2014)


On the ballot: Luke Appling is the White Sox franchise leader in WAR, was named by the BBWAA as the greatest player in the history of the White Sox in 1970, hit .388/.474/.508 in 1936 and, to top it all off, hit a home run off Warren Spahn in the 1982 Old-Timer’s Game at the age of 75. Put that man on the White Sox Franchise Four, stat!

Frank Thomas had eight seasons with five or more WAR as a member of the White Sox and hit .307/.427/.568 with the team in his career. He led the league in on-base percentage four times in seven years from 1991 to 1997 and won back-to-back AL MVP Awards in 1993 and 1994.

Eddie Collins played the first half of his career with the Philadelphia Athletics and the second half of his career with the Chicago White Sox. As a member of the White Sox, Collins won the 1917 World Series and was a member of the 1919 World Series team that lost to the Cincinnati Reds in the “Black Sox” scandal that saw eight teammates, including Shoeless Joe Jackson, banned from baseball for life by the commissioner. Collins, of course, was not part of the “eight men out.”

Nellie Fox, Minnie Minoso, and Luis Aparacio were White Sox teammates in the 1950s and early 1960s. Fox was a 12-time All-Star and won the 1959 AL MVP award when the White Sox made the World Series. Like Fox, Luis Aparacio was another big part of the 1959 World Series team known as the “Go-Go Sox” because of their propensity to steal bases. Aparacio led the AL that year with 56 steals. Minnie Minoso was a four-time All-Star in nine seasons with the Sox. After his playing career ended he lived in Chicago for many years and represented the franchise as “Mr. White Sox” well into this century.

Harold Baines was a White Sox icon in the 1980s. In the middle of the 1989 season, the White Sox made a much-derided trade with the Rangers that saw Baines leave the team. This would become known as the “white flag” trade. In a bizarre twist, the White Sox retired Baines’ #3 about a month later, which is rare for an active player. Baines would go on to play another twelve seasons and would have his number unretired in two different stints with the team later in his career.

Paul Konerko is pretty far down on the White Sox WAR leaderboard but was part of the last White Sox team to win the World Series back in 2005 and was the MVP of the ALCS that year.

Notable snub: Among contemporary players, I would argue Mark Buehrle is a more deserving candidate for the ballot than Paul Konerko. Buehrle has 40.1 WAR as a White Sox player compared to 23.6 for Konerko and both were on the 2005 World Series championship team. Buehrle also has one of the two perfect games thrown by a White Sox pitcher.

My Franchise Four: Luke Appling, Frank Thomas, Nellie Fox, Minnie Minoso