The Fans Projections: Pitchers
Previously, I looked at the difference between the Fans projections and the Depth Charts projections for hitters. Now let’s look at the pitchers.
As with the hitters, the Fans projections are much more optimistic than the Depth Charts. Using the raw projections, the following table shows how much more optimistic the Fans are for pitchers. One note: because of the big difference in playing time and role for Tanner Roark, I eliminated him from consideration. The Depth Charts have Roark primarily pitching in relief (61 G, 6 GS, 95 IP), while the Fans have him as a starter (34 G, 29 GS, 184 IP).

For the average starting pitcher, the Fans are projecting eight more innings pitched, a much better ERA and WHIP, slightly more strikeouts, and 0.5 more WAR. Relievers have closer projections from the Fans and the Depth Charts, with the Fans projecting just 0.1 more WAR for the average reliever. For the entire set of pitchers, the Fans are projecting a 3.47 ERA and 1.21 WHIP, while the Depth Charts check in at 3.71 and 1.25.
The overall totals are useful to get a big-picture view, but the distribution of WAR can also be interesting. The graph below shows the difference between the Fans projected WAR and the Depth Charts projected WAR for starting pitchers in increments of WAR from -0.8 to 1.9. The players on the left are projected by the Fans for less WAR than the Depth Charts are projecting. The players on the right are projected for more WAR by the Fans. The black line is at a difference of 0.0 WAR.

The Fans projected more WAR for 80% of the hitters (previous article). It’s even more extreme for the pitchers: 83% of the pitchers are projected by the Fans for more WAR than the Depth Charts are projecting. The pie chart below shows this breakdown.

Again, that’s the big picture for starting pitchers. The individual pitchers at the extremes might be interesting to look at, so we’ll start with the nine pitchers with the biggest NEGATIVE difference between their Fans projection and their Depth Charts projection.

There are some good pitchers on this list. Given that the Fans project 83% of pitchers to have a higher WAR than the Depth Charts are projecting, it’s surprising to see Max Scherzer, Jose Fernandez, Hisashi Iwakuma, and Francisco Liriano on this list of starting pitchers the Fans like the least. In most cases, the Fans are projecting a better ERA than FIP and, because FanGraphs WAR is FIP-based, this explains some of the difference in WAR. Also, the Fans are projecting significantly fewer innings than the Depth Charts for some of these pitchers, which reduces their WAR.
Notes:
- The Fans like Masahiro Tanaka to perform well when he’s on the mound (3.14 FIP versus 3.37 FIP projected by the Depth Charts) but project him for 46 fewer innings than the Depth Charts are projecting, which accounts for his lower projected WAR.
- Max Scherzer is projected by the Fans for five more innings than the Depth Charts, but with a higher FIP, at 2.96 to 2.78, and a higher BABIP that results in a higher WHIP (1.12 to 1.07). He’s still the eighth-best starting pitcher per the Fans, while the Depth Charts have him at #5 among starters in WAR.
- Francisco Liriano is similar to Scherzer in that the Fans are in agreement on the number of innings pitched but project Liriano for a higher FIP (3.54 to 3.29) than the Depth Charts.
- Jose Fernandez and CC Sabathia are projected for fewer innings by the Fans than the Depth Charts. In the case of Sabathia, the deficit is 53 innings. As for production, the Fans and Depth Charts projections are quite similar for CC: 4.18 ERA, 3.93 FIP, 1.26 WHIP for the Fans, 4.12 ERA, 3.96 FIP, 1.26 WHP for the Depth Charts.
- After dropping his BB/9 to a microscopic 0.7 in 2014, the Fans and the Depth Charts both see regression in this area for Phil Hughes. The Fans expect Hughes’ BB/9 to more than double, from 0.7 to 1.6, while the Depth Charts expect Hughes to hold on to some of those gains, projecting a 1.2 BB/9. Hughes is projected for a very similar number of innings, but his higher FIP projection by the Fans results in a -0.6 WAR difference between the two sources.
- For John Lackey, the main difference in his Fans projection and his Depth Chart projection is a higher BB/9 (2.3 to 2.0). His career mark is 2.6, but he’s been better than that in each of the last two years (1.9 BB/9 in 2013, 2.1 BB/9 in 2014).
- Finally, the Fans are most pessimistic about James Shields, despite his move to Petco Park, also known as Pitchers Paradise (by me, I just made that name up, you’re welcome.). The Depth Charts project Shields for a higher strikeout rate (8.1 K/9 to 7.6 K/9) and to have fewer fly balls leave the yard (0.7 HR/9 to 0.9 HR/9). The result is a difference in FIP in favor of the Depth Charts (3.23 FIP to 3.47) and a 0.8 difference in WAR. Among starting pitchers, Shields is ranked 16th in WAR by the Depth Charts but 56th by the Fans.
On the other end of the spectrum, there are 21 starting pitchers for whom the Fans project a WAR that is at least 1.0 greater than the Depth Charts are projecting, with Jesse Hahn leading the way with a difference of 1.9 WAR. Here are the top 10 starting pitchers based on the greatest difference in their Fans projection and their Depth Charts projection.

All ten of these pitchers are projected for more innings and a better FIP by the Fans than by the Depth Charts. Many of these pitchers are younger pitchers or pitchers with only a year or two of major league experience.
Notes:
- The leader in the clubhouse is Jesse Hahn, projected for 1.9 more WAR by the Fans than the Depth Charts. Their innings projections are close, just a difference of 10, but the Fans expect Hahn to post a 3.27 FIP compared to the 4.25 mark projected by the Depth Charts. The Fans project a better strikeout rate, better walk rate, and lower home run rate. In 163 1/3 minor league innings, Jesse Hahn struck out 8.8 batters per nine innings. His K/9 was 8.6 in 73 1/3 major league innings last year. The fans are projecting more of the same, with a K/9 of 8.5. The Depth Charts see major regression, pegging Hahn for a 6.7 K/9.
- Cliff Lee is projected for 180 innings by the Fans and 106 by the Depth Charts. It looks like there’s a good chance he won’t achieve either mark in 2015.
- Drew Smyly is projected for significantly more innings by the Fans, along with a better FIP (3.41 to 3.63).
- The Mookie Betts of starting pitchers? That would be Carlos Carrasco. Carrasco’s projection for 4.2 WAR by the Fans ranks him 9th among all SPs, while the Depth Charts have him 28th. The Fans project Carrasco for a much higher K/9 (9.3 to 8.5) and a lower walk rate (2.2 BB/9 versus 2.6 BB/9), along with 29 more innings pitched.
- If you compare the strikeout and walk rate projections by the Fans for Nathan Eovaldi to his career strikeout and walk rates, it’s easy to see that they are quite optimistic for Eovaldi in 2015. The Fans project Eovaldi for a 7.0 K/9 versus a 6.3 career K/9 and a 2.3 BB/9 versus a career 2.9 mark. That gives him a forecasted 3.58 FIP. The Depth Charts have him with a 4.25 FIP and less than half as much WAR.
- Jake Odorizzi had a strong 2014 season and the Fans are optimistic that he can do it again in 2015.
- Jacob deGrom had a big jump in his strikeout rate after moving up to the big leagues last year. In 323 1/3 minor league innings, deGrom has a career 7.4 K/9, and his best single-season mark in the minor was 7.8 K/9 in 2012. Then he came up to the major leagues last year and struck out 9.2 batters per nine in 140 1/3 innings. The Fans are projecting deGrom for a K/9 of 8.8, while the Depth Charts have him down at 8.2. The difference in FIP is 3.03 for the Fans and 3.40 for the Depth Charts, which produces an overall WAR difference of 1.3. deGrom is ranked 58th among starting pitchers in WAR based on his Depth Chart projection but is 32nd based on the Fans projections.
- Both the Fans and the Depth Charts like Jordan Zimmermann quite a bit. The Depth Charts projection has Zimmermann with 3.4 WAR, which ranks him 12th among starting pitchers. The Fans projected WAR of 4.7 moves Zimmerman up to 6th.
Well wrap this up with a look at the individual relief pitchers at the extremes. First are the relief pitchers who are projected for much less WAR by the Fans than the Depth Charts.
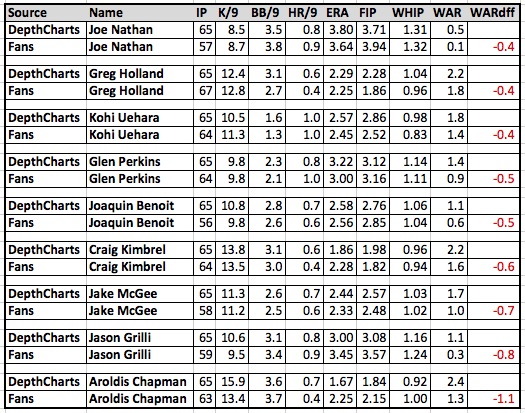
The three relievers who might be the top three closers in baseball are on this list, which is surprising (Aroldis Chapman, Craig Kimbrel, Greg Holland).
- Aroldis Chapman is projected for a 2.15 FIP but even that can’t compare to the 1.84 FIP projected by the Depth Charts. The Fans also project Chapman to have a 13.4 K/9 versus a 15.9 K/9 projected by the Depth Charts. The end result is a difference of 1.1 WAR, with the Depth Charts placing Chapman 1st in WAR among relief pitchers and the Fans projecting him 9th.
- When it comes to Greg Holland, Craig Kimbrel, and Koji Uehara, I’m not sure what is going on with their WAR projection from the Fans. Holland, Kimbrel, and Uehara are all projected for better FIPs by the Fans than the Depth Charts, and similar innings pitched, but less WAR.
- Jake McGee’s lower WAR projection is in part due to eight fewer innings being projected by the Fans.
Finally, we’ll look at the relievers with the most favorable difference in WAR based on the Fans projections versus the Depth Charts projections.

- Aaron Sanchez is very popular this spring. He was terrific in 33 innings out of the bullpen last year (1.09 ERA, 2.80 FIP). The Fans project him for a 3.36 FIP in 129 innings (43 games, 16 starts), while the Depth Charts are not so optimistic, with a 4.53 projected FIP in 111 innings (56 games, 11 starts). This combination of better pitching in more innings results in a difference of 1.9 WAR, tops among all relief pitchers.
- Yusmeiro Petit is similar to Sanchez, projected to have a better FIP (3.07 to 3.30) and more innings pitched (131 to 92) by the Fans.
- A couple of Seattle Mariners pitchers, Dominic Leone and Danny Farquhar, make this list based on their projection for many more innings by the Fans versus the Depth Charts. This is also true for Chase Whitley, Tony Watson, Jake Diekman, and Justin Wilson.
- The Fans projection for Jeurys Familia is closer to the Depth Charts projection for innings pitched (61 to 55), but the Fans project Familia to have a 2.97 FIP versus a 3.50 FIP projected by the Depth Charts.
Bobby Mueller has been a Pittsburgh Pirates fan as far back as the 1979 World Series Championship team ("We R Fam-A-Lee!"). He suffered through the 1980s, then got a reprieve in the early 1990s, only to be crushed by Francisco Cabrera in 1992. After a 20-year stretch of losing seasons, things are looking up for Bobby’s Pirates. His blog can be found at www.baseballonthebrain.com and he tweets at www.twitter.com/bballonthebrain.