Archive for May, 2017

Statistical Analysis of a Few College Hitters

As the 2017 MLB Draft quickly approaches, I thought it may be fun to analyze some of the best college hitters available.  On May 23, Eric Longenhagen released the 2017 Sortable Draft Board on FanGraphs.  This article looks at the statistics of each college hitter on the list.  In this article, I tried to not lean on literature and scouting reports of the players.  Rather, I decided to calculate some statistics to use as guides in building an outsider’s perspective of their offensive profiles.  This body of work does not include much information about attributes or skills not published on a school’s statistics page on their website.

Nobody real cares about the counting statistics of college players.  So, for my table of numbers to fit on a page, I left them out.  The statistics I focused on are a hitter’s slash line (AVG, OBP, and SLG), OPS, BABIP, ISO, RC, K% and BB%.  These are relatively easy to calculate and provide some sort of worth when evaluating prospects.  AVG, OBP, and SLG are simple and widely understood.  OPS provides a good gauge of a hitter’s overall offensive ability.  BABIP is an important indicator of a hitter’s talent at the plate, but can be inflated or deflated depending on the talent level of the different defenses faced by the hitter.  ISO is a good indicator of how well each hitter demonstrated their power and XBH ability.  Runs Created (RC) is a crude but effective measurement of total, individual offensive output.  K% and BB% give us some idea of how well the batter demonstrated their understanding of the strike zone and discipline at the plate.  For more information on each statistic, as well as how to apply it, I suggest checking out the Glossary tab.

Below is the table of numbers I made.  Even further below is where you will find a quick summation of each hitter discussed.

Name

AVG OBP SLG OPS BABIP ISO RC K%

BB%

Jeren Kendall

.306 .379 .570 .949 .333 .264 50.31 18.9%

20.8%

Adam Haseley

.400 .498 .688 1.186 .393 .288 70.21 7.7%

38.8%

Keston Hiura

.419 .556 .672 1.228 .486 .253 67.80 14.5%

40.3%

Pavin Smith

.348 .433 .581 1.013 .311 .233 53.78 3.2%

42.7%

Logan Warmoth

.336 .410 .562 .972 .374 .226 53.10 15.3%

20.8%

Jake Burger

.343 .459 .686 1.145 .319 .343 63.50 12.0%

35.1%

Evan White

.380 .454 .654 1.108 .414 .274 51.08 13.5%

17.3%

Brian Miller

.336

.412 .504 .917 .365 .168 49.78 11.7%

28.1%


Jeren Kendall (#9 on FanGraphs Sortable Draft Board)

Vanderbilt                   OF                   (B- L/ T- R)

Jeren Kendall is considered by many to be the best college hitter, outside of Louisville two-way player Brendan McKay.  Kendall showed some impressive pop out of center field this past year, knocking 15 balls over the fence in 235 at bats.  However, he also managed to record 50 strikeouts.  Kendall did manage to produce an excellent walk rate and ISO, but his total output was “middle of the pack” as far as the guys on this list go.  He should go off the board within the first 20 picks this upcoming draft.

Adam Haseley (#15 on FanGraphs Sortable Draft Board)

Virginia                       OF                   (L/L)

Hitting from the left side of the plate, Virginia outfielder Adam Haseley managed to put up the best statistical profile of any hitter on this list.  He comes into June’s draft with an impressive OPS (1.186) and an even more entertaining strikeout rate — a board-best 7.7% (only 19 punch outs in 205 ABs).  While Haseley’s power numbers may not translate at the next level, his affinity for driving the ball into deeper parts of the ballpark should make for a high doubles count at the next level.

Keston Hiura (#17 on FanGraphs Sortable Draft Board)

UC Irvine                     2B                    (R/R)

While Keston Hiura’s .486 BABIP may be a good indicator as to why his batting average is north of .400, it is also a good indicator of just how good he is with a bat in his hand.  He did not just hit singles — his 21 doubles come in second on the list.  He displayed an excellent walk rate, which contributed to the highest on base percentage on the shortlist.  While some teams may elect to take a prep shortstop over a college second baseman, Hiura still plays a premium position with solid presence at the plate and would fit in nicely in any class as a second to third-round pick.

Pavin Smith (#18 on FanGraphs Sortable Draft Board)

Virginia                       1B                    (L/L)

The second UVA Cavalier on our list slashed an impressive .348/.433/.581 this past season, and posted an impressive 3.2% strikeout rate.  While his numbers do not match those of his teammate Adam Haseley, Pavin Smith could very well be the first college first baseman off the board, assuming you do not count Brendan McKay as a first baseman.  His demonstrated knowledge of the strike zone, coupled with a list-best walk rate, are both very good indicators of a first baseman with a high ceiling.

Logan Warmoth (#20 on FanGraphs Sortable Draft Board)

North Carolina            SS                    (R/R)

Tar Heel shortstop Logan Warmoth, when compared to the rest of this list, does not really stand out.  However, he should be taken early, as he still has the best odds of being the first college shortstop off the board.  He hit well in the ACC this past season, compiling 18 doubles, 4 triples, and 9 home runs.  Though his demonstrated power will likely not follow him up the minors, any team would love to have a strong bat such as his at the most premium of all premium positions.

Jake Burger (#22 on FanGraphs Sortable Draft Board)

Missouri State            3B                    (R/R)

Our only hot corner prospect on the list is a power threat through and through, according to his numbers.  While his average will continually drop as he climbs the minors, Burger’s 20 homers showcased his raw power.  Although there may be some questions about his tendency to punch out, plus power paired with an excellent walk rate at a corner position are a recipe for success.  Everybody loves a little yak sauce on their Burger every now and then.

Evan White (#29 on FanGraphs Sortable Draft Board)

Kentucky                      1B                    (R/L)

A first baseman who hits from the right side is very common.  A First Baseman who hits from the right side but throws left is very uncommon.  A first baseman who hits from the right side but throws left with plus speed is downright unique.   Evan White legged out a list leading 23 doubles this past year, and posted all-around great offensive numbers.  He will be a very interesting draft choice, and his excellent statistics project a demonstrate a solid offensive background.

Brian Miller (#49 on FanGraphs Sortable Draft Board)

North Carolina            OF                   (L/R)

Rounding out our list is North Carolina outfielder Brian Miller.  Miller slashed a very impressive .336/.412/.504 line this past year, and should be a good mid-grade prospect in the upcoming draft.  His statistics do not lean to one type of offensive profile over another, but his high BABIP and excellent walk rate generate some reasons to believe his bat will continue to develop at the next level.

Again, this article is meant to simply provide a statistical overview of a few college prospects in the upcoming draft.  It should be looked at as a tool for anybody who cares enough to concern themselves with college statistics.


Theodore Hooper is an undergraduate student at the University of Tennessee in Knoxville.  He can be found on LinkedIn at https://www.linkedin.com/in/theodore-hooper/ or on Twitter at @_superhooper_
Fastball Confidence a Focal Point for Harvey

To express the extent of a player’s confidence is difficult, and using numbers to back up this assertion is even harder. When a player lacks confidence, it can be seen through a slew of on-field mannerisms that don’t always present themselves inside statistics. Instead, the numbers tell us the story of a pitcher, once of dominant form, who is struggling to get outs and display any sort of consistent performance. The statistics paint this picture about Matt Harvey. They tell us a tale of dominance, hindered and erased by injury and ineffectiveness. Although this story is told, it seems to be far from the truth. I believe in an alternate story. A story that displays a human being struggling with the confidence to throw his pitches and retire hitters. A lack of confidence stemming from a large set of off-field hindrances and a set of recent on-field struggles. A problem that will be moved past and put behind in the months to come, making it only a distant memory to both Matt and Met fans.

If we rewind back to September of 2015, we can see that Harvey is no stranger to hardships or headlines. After Tommy John surgery following his stellar 2013 campaign, he seemed back to form throughout 2015, culminating in an impeccable playoff start against the Cubs and a World Series game 1 nod. Throughout the season, questions about Harvey’s innings limit hovered around the Mets clubhouse, reaching its climax in early September. After a start against the Philadelphia Phillies where Harvey exited early due to dehydration, agent Scott Boras spoke about the doctor’s indication that Matt should not exceed 180 innings pitched that season. With Matt already at 166 1/3 innings, it seemed like the Mets organization was directly ignoring these suggestions.

This back and forth between the front office and Boras propelled Matt into the spotlight preceding his next start against Washington, who had become their rival in the midst of a pennant race. He pitched poorly, to the tune of 7 R (4 ER) in only 5 1/3 innings. This tough outing doesn’t hold a torch to his current struggles, but the difference in approach between this start and his recent starts form an interesting comparison.

Throughout this start in particular, and the entirety of the 2015 season, Matt Harvey was unafraid to throw his fastball to any hitter. He challenged hitters like Bryce Harper, in the midst of an MVP season, with fastball after fastball. In Harvey’s most recent start, he wouldn’t even challenge Manuel Margot with the same. Of his 74 pitches in that 2015 start, he threw 51 fastballs 95 and above, constantly pounding the zone. In his most recent start, Harvey nibbled around corners, he never challenged hitters, and he relied on his breaking ball (usually out of the zone) even when behind in the count. This tendency showed a lack of confidence to throw his fastball and challenge hitters, something that Harvey needs desperately to be successful. Overall, the dichotomy in approach between 2015 and 2017 for Matt is striking. Here are some of the numbers based on his position in the count:

2015, 2017
AHEAD
CU, CH: 22.3%, 19.7%
SL: 15.5%, 23.4%
FA, FT: 62.2%, 56.9%
BEHIND
CU, CH: 19.0%, 25.3%
SL: 16.5%, 21.7%
FA, FT: 64.6%, 53.0%
TOTALS
AHEAD% 32.6%, 20.8%
BEHIND% 20.8%, 25.9%

In 2015, when ahead in the count, Matt threw 62.2% fastballs. When behind, he threw even more, to the tune of 64.6% of the time. Because of his ability to pound the zone with his fastball, he spent 32.6% of his time ahead in the count while only 20.7% behind. This allowed him to control the pace of the at-bat and the expectations of the hitter. When he wanted to break off a curveball or a slider it became much more effective in relationship to his established fastball.

So far in 2017, he’s been unable to get ahead in the count or develop any rhythm with the pitch. His inability to challenge hitters has left him nibbling around the plate, leaving him ahead in the count only 20.7% of the time. This problem grows when behind in the count, as Harvey continues to throw off-speed pitches 47% of the time. His inability to command these pitches leads to even worse counts, and compounds the problem. Throughout his most recent start again San Diego, Harvey continued to nibble around the corners of the zone, seemingly afraid to challenge hitters with his fastball or throw off-speed pitches consistently in the zone.

This tendency, pointed out by Ron Darling during the SNY Broadcast, can be evidenced by his complete change in pitch usage as shown above. Although diminishing fastball usage is occurring league round, Harvey has to use his fastball more consistently to be more effective this season. By establishing his fastball early, he can play off of it, creating more effective offspeed pitches as well as more powerful fastballs. To be a Cy Young caliber pitcher, you have to trust your stuff and believe in your ability to dominate. As of now, Matt doesn’t believe in either.


Is the Lead-off Revolution a Bust?

2017 has been full of surprises so far. The Cubs were supposed to run away with the NL Central, but are struggling to stay above .500. The Backstreet Boys were supposed to drop an album sometime this year, but it’s May and we’ve heard squat from Nick Carter. And most intriguingly, this was the year we were supposed to see a radical change in who batted lead-off — but not much has changed.

Journalists were forecasting 2017 as the year of the slugging-lead-off hitter. Zach Kram of The Ringer boldly proclaimed “The Batting Order Revolution Will Be Televised” in explaining how more and more managers are batting sluggers, bonafide power bats like Kyle Schwarber and Carlos Santana, lead-off. This season seemed poised to be the year that we saw managers reaping the benefits of giving their best hitters more at-bats.

The folks over at The Ringer weren’t the only ones — 538, Fox Sports, and ESPN have all described the coming revolution. But there’s one small problem — the revolution isn’t having that big of an impact so far.

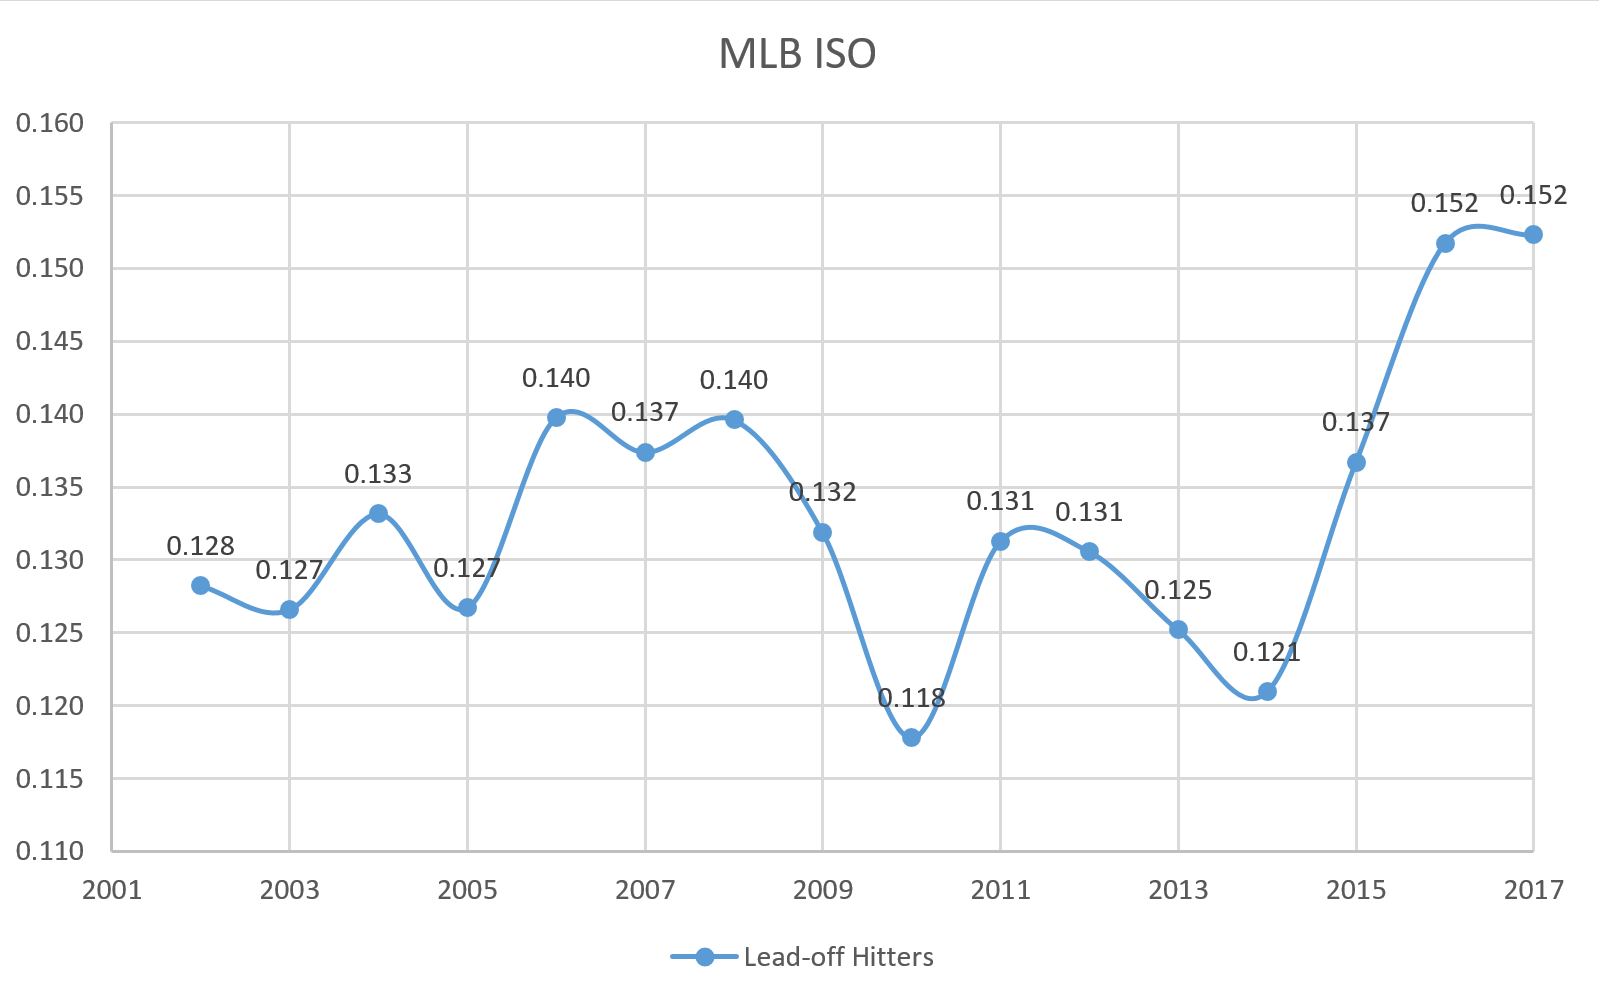
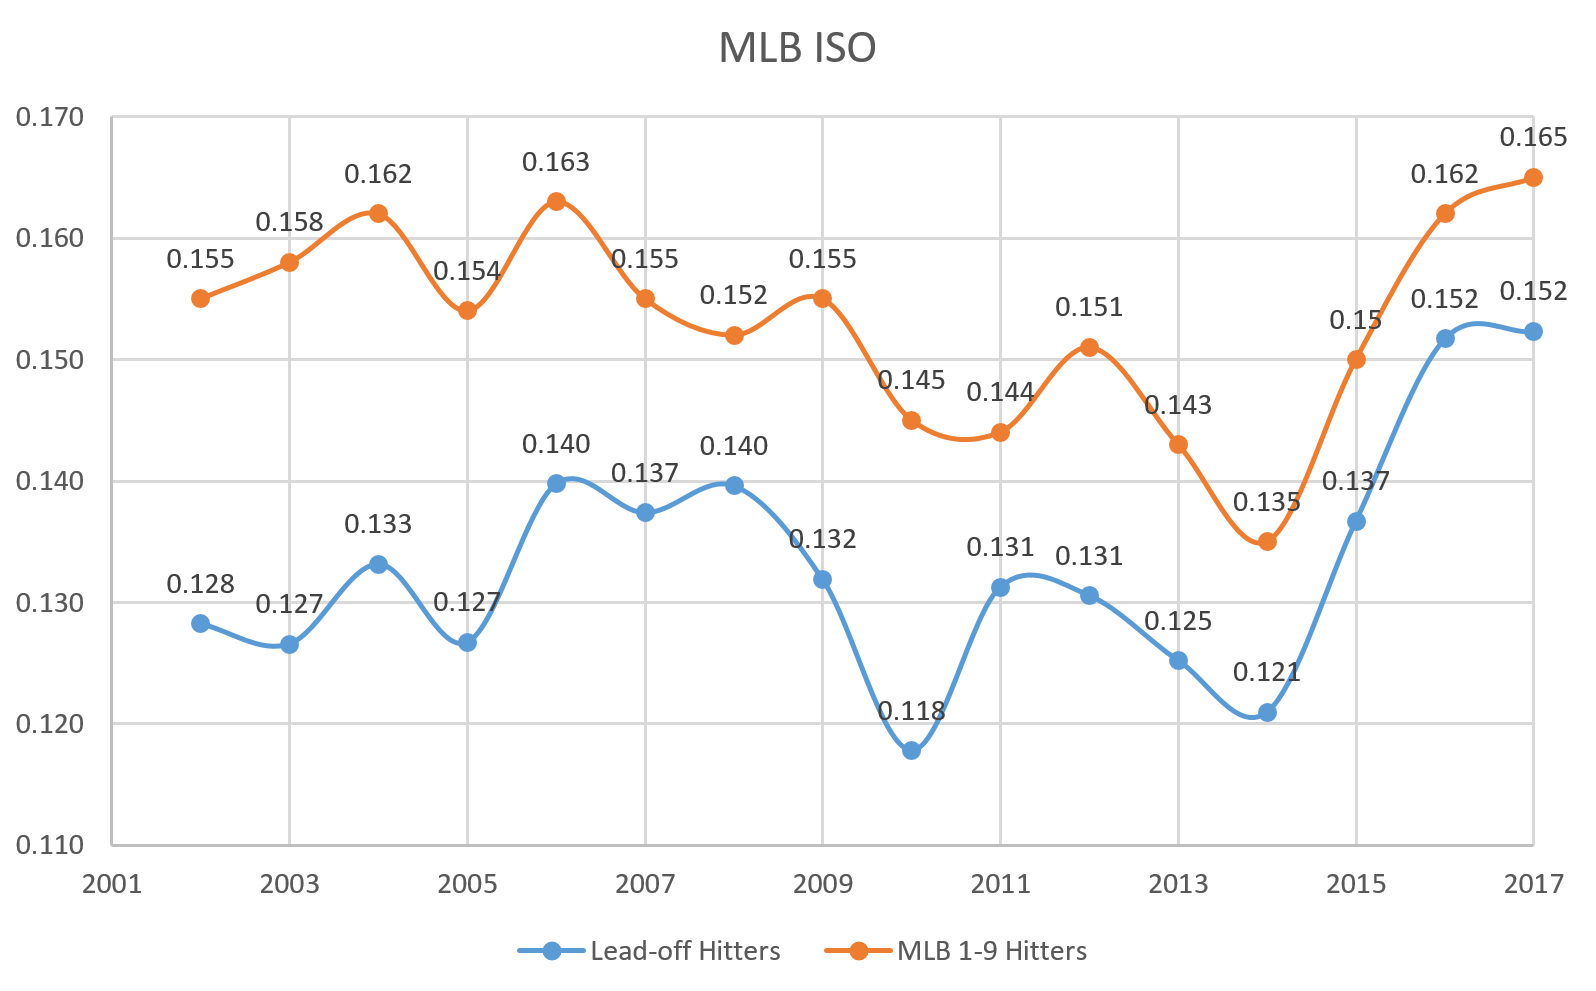
Okay, sure — lead-off hitters have, technically, hit for more power than they have in years past. League-wide, we have seen ISO for lead-off hitters in the past few years jump up faster than Bartolo Colon when he hears the words “unlimited buffet.”

MLB Leadoff Hitters ISO per year 2002-2017

What could be to blame for such a power surge from the leadoff spot? Hint: it has a lot less to do with the fact that managers are batting their sluggers in the lead-off position than you’d think.

Remember the league-wide power surge that the MLB encountered last season? Power across the league skyrocketed — curiously enough, in the exact same manner in which lead-off hitters’ power skyrocketed.

MLB Lead-off Hitters' ISO v. MLB ISO

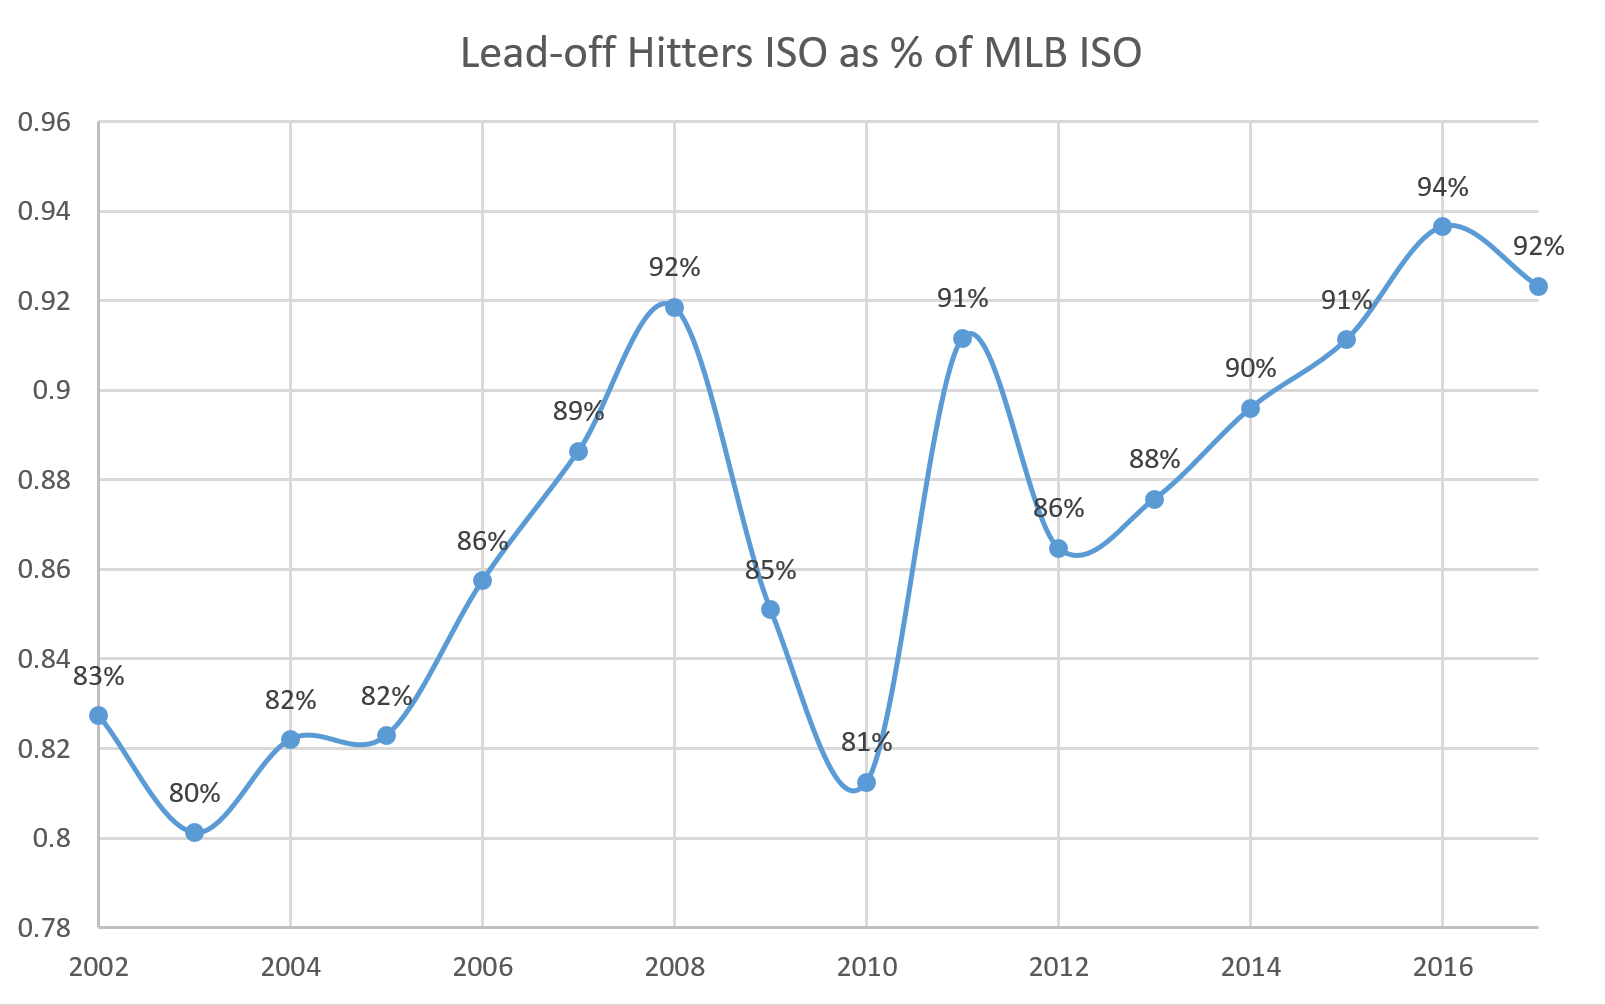
While there are some variations from 2002-2013, the recent power spike from lead-off hitters is almost entirely explained by the league-wide power spike. In fact, if we look at lead-off hitters’ ISO relative to league ISO, we find that lead-off hitters are hitting for less power than they did in 2016.

Lead-off hitters' ISO as a % of MLB ISO

This is not to say that there has been no power surge among lead-off hitters — as you can see above, adjusted ISO in the lead-off spot has risen steadily since 2012. Perhaps that is the result of batting sluggers as lead-off hitters. But the leaps and bounds in production from the lead-off spot as predicted above simply haven’t come to fruition. These lead-off hitters are power-surge imposters! It looks like they’re maintaining the same power from last year, when relative to the league, they’ve actually lost power.

The narrative of the power-hitting lead-off batter taking the MLB by storm seems legitimate on the surface, in no small part thanks to Michael Conforto‘s renaissance as a top-five hitter while starting off games, or Charlie Blackmon’s position atop the RBI leaderboards despite spending his season in the lead-off spot — and indeed, these players are providing additional value by leading off.

But these are only individual cases. The “lead-off hitter revolution” isn’t having as much of an impact league-wide as the revolutionaries might like to think — after all, Dee Gordon and Billy Hamilton still occupy lead-off slots with their .066 and .084 ISOs respectively, nevermind the fact that the poster-child of the revolution, Schwarber, is making up for the sophomore slump that he missed by being injured for all of 2016.

Lead-off hitters are technically hitting for more power, but so is everyone else. Blaming the huge spike in power in the lead-off spot on managers batting hitters lead-off is to ignore significant league-wide trends, and miss the big picture. Maybe there is a small impact caused by the new lead-off philosophy, but it certainly is not bringing unheralded power and production to the lead-off slot. The revolution might not be a bust (yet), but it still has long ways to go in order to make an impact.


The Case for Kolten Wong to Lead Off

Up until Wednesday’s game, the Cardinals offense had been struggling, or as Bernie Miklasz described it: “snoring.” As a result, the Cardinals went 1-5 over six games despite a rotation ERA of 1.28. In the same article, Bernie highlights some of the reasons this team has a “mediocre” record with the best starting pitching in baseball (3.06 ERA). Namely, a low on-base percentage from the leadoff hitter. How low you might ask? It’s at .302, which is good for 26th in the league.

Dexter Fowler

Mike Matheny has used only three different players in the top spot of the order: Dexter Fowler (35 games), Kolten Wong (7 games), and Greg Garcia (1 game). Without question, when Dexter Fowler is playing well, he should lead off. After all, that’s what he was signed to do (in one of the biggest FA deals of the offseason). Not only did he play a key role in leading a Cubs team that combined for well over 200 wins in 2015 and 2016, but he also had an OBP of .393 last year — second only to Mike Trout (who might end up being better than Mickey Mantle). This year, Fowler’s OBP has dropped to .305 and his wRC+ has fallen from 129 in 2016 to 89 (For those unfamiliar with wRC+, 100 is average).

I’m not the only one thinking it might be time for a change; Matheny has hinted at it too. But he’s not ready to make a decision just yet. Here’s why he should be.

Kolten Wong is quietly putting together a solid campaign. In one of the early surprises of the season, with a slash line of .281/.376/.422, Kolten has provided more value than Fowler thus far. If we look at a recent, albeit smaller sample size, the results are even more shocking.

UVizuk4.0.png

These results paint a clear picture: Wong has been the better player for the entire month of May. Although not an enormous difference, Wong’s 15 wRC+ advantage over Fowler is significant. As the splits become smaller, the difference only increases. This illuminates Kolten’s recent success and Dexter’s struggles.

While some may say Fowler is a natural leadoff hitter and Kolten is not, these two players have very similar plate-discipline profiles for 2017. Both players swing at about 26% of pitches out of the strike zone. To give these values some context, Matt Carpenter swings at 17% of pitches outside the strike zone, while Randal Grichuk swings at 35% of pitches outside the zone (plate-discipline profiles can be found here).

These next two tables show two things: the consistency with which Fowler has struggled, and the consistency with which Wong has excelled.

pzlogR3.0.png

Fowler has been an average hitter against the four-seam fastball. Against all other pitches, he isn’t hitting above the Mendoza line. When we examine the same data for Wong, we see a different kind of consistency.

QmNm3AI.0.png

Kolten has excelled against most pitches. This is the profile of a complete major-league hitter. Of course, this isn’t the largest sample size. But a quarter of the way through the season, I’m sure many of you are as surprised as I was to see how consistent Kolten has been. Sure, he’s struggled with the sinker and doesn’t hit for much power, but I would argue that the Cardinals only need their leadoff hitter to get on base. In fact, Fowler’s pop would be a welcome addition with runners on base lower in the lineup.

The Cardinals have a few options for the leadoff position. The three players that have been used thus far (Fowler, Wong, Garcia), as well as Matt Carpenter. Because his power is needed in the 3-spot, Carpenter isn’t an option with this roster. Garcia isn’t an everyday player, so that option is not realistic either. And when it comes down to Fowler and Wong, the outfielder’s struggles have opened the door for the young infielder. It’s up to Matheny now.


The Reds Hit the Unhittable Bullpen

Prior to the 2016 trade-deadline acquisition of Andrew Miller, the Indians had a strong bullpen. Dan Otero was in the midst of a terrific year and was arguably a top-10 reliever in baseball. Cody Allen, Bryan Shaw and Zach McAllister compiled a strong relief core that was a huge strength for the American League Champion. They finished the season 7th in the league in total WAR at 5.0, aided by Andrew Miller’s 1.1. Miller instantly added a new dynamic to the bullpen and the Indians were able to ride them through all the way to Game 7 of the World Series. Ever since then, Cleveland’s relievers have been nearly unhittable.

Up until May 21, just before the Indians and Reds series began, the Tribe bullpen was spotting an ERA of 1.97 through 146 innings, which was first in the league with a .184 batting average against and a .248 opponent wOBA. As a unit they had converted all 18 save opportunities they had been given, never relinquishing a lead from the 7th inning on.

The Indians’ opponent for the next three days happened to be the Cincinnati Reds, who, believe it or not, currently lead the majors in WAR for position players, while also sitting 5th in OBP, 5th in SLG and 6th in wOBA. They have four players with double-digit home-run totals, the only team in the league that can boast that. Zack Cozart leads all shortstops in AVG, OBP, SLG, wRC+ and WAR. They also have a former MVP who is slashing .351/.510/.608/.1.118 for the month of May. While they might not be on everyone’s radar, this offense has been one of the league’s best so far in 2017.

The Reds hitters showed they are the real deal in the battle of Ohio, particularly against the very stingy Cleveland bullpen. In 7.1 innings in three games against the Reds, the Indians’ pen allowed 5 earned runs and gave up 10 hits and 2 walks while striking out 8. It’s not the worst line for a three-game stretch by any means, but given their performance prior to this series it can certainly be classified as surprising. All of the run-scoring damage took place during two at-bats: Eugenio Suarez’s game-tying home run against Bryan Shaw and Zack Cozart’s go-ahead single against Cody Allen.

Suarez’s home-run in the bottom of the 7th inning took the Reds’ chances of winning from 18.4% to 55%, easily the most impactful play in terms of WPA for each player this season. While the Indians ended up coming out on top, it was still the first blown save for the Indians this year.

Cozart’s 9th inning, go-ahead single the following night would prove even more significant as it came in the Reds’ final out of the game and added a whopping .648 to their win probability. It quickly became the second blown save in as many nights and ultimately resulted in a Reds win. The one caveat about this play is that Billy Hamilton’s speed had quite a significant impact. He may be the only player in the league that scores from first base in that scenario, which greatly affected the WPA for both Cozart and Allen. Nonetheless, Allen still got pegged for a loss in his worst outing of the year so far.

Going forward, this series will mostly likely come to be insignificant for the Indians. Andrew Miller still turned in dominant performances and Shaw and Allen are likely to remain the strong, reliable setup men they have proven to be. For the Reds, this series is more evidence that the lineup is up and down very much improved from last year, when they posted 15.4 WAR (they are currently at 10.1 in 2017) and an 89 wRC+. With Joey Votto continuing to put himself in the discussion at the best hitter in the game and a young group of players eager to prove themselves, this Reds offense could manage to surprise some more people down the stretch.


Tommy Joseph Learns the Value of Patience

While Phillies first-base prospect Rhys Hoskins spent April on the Triple-A leaderboards, his big-league counterpart, Tommy Joseph, was among the least productive everyday players in the majors. Through the first month of the season, Joseph hit for a dreadful .179/.222/.254 slash line, along with a .211 wOBA and 25 wRC+. While a BABIP of .234 didn’t do him any favors, Joseph’s 27.8 K% and 5.6 BB% suggested that the 26-year old was simply being outmatched at the plate. All in all, despite passable defense at first base, Joseph’s lack of offensive output was enough for him to accumulate -0.7 WAR, tied for the third-lowest in the league.

It didn’t take long for the local media to start calling for Joseph’s spot in the starting lineup. Hoskins, who Eric Longenhagen rated in February as the Phillies’ ninth-best prospect, ended the month with six home runs and a .338 batting average — numbers that look even better when compared to Joseph’s disappointing output. By the last week of April, some Phillies writers were suggesting promoting Hoskins to the big-league starting lineup in favor of Joseph. Even the sports section of the city’s largest newspaper demanded the team make the switch. As longtime Philadelphia Inquirer columnist Bob Brookover wrote in the first week of May, Hoskins “[c]utting into Joseph’s playing time when he’s hitting below the Mendoza Line would not cause nearly as much turmoil as [Joseph cutting into Ryan Howard’s playing time] did a year ago.

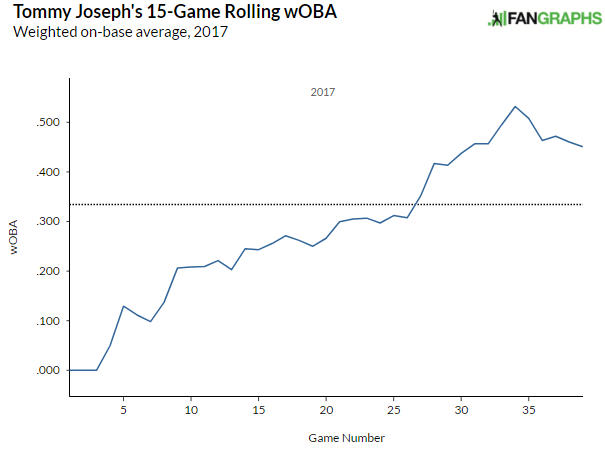
Since the beginning of May, though, the cries to replace Joseph in the lineup have, for the most part, been quieting down. This trend can be attributed to the fact that, surprisingly enough, Tommy Joseph has been one of Major League Baseball’s best hitters this month. Since the beginning of May, Joseph’s 185 wRC+, .459 wOBA, and .344 ISO rank eighth, eighth, and twelfth, respectively, among nearly two hundred qualifying batters. Take a look at how drastically his rolling wOBA has shifted throughout the first two months of the season:

rollingwOBA

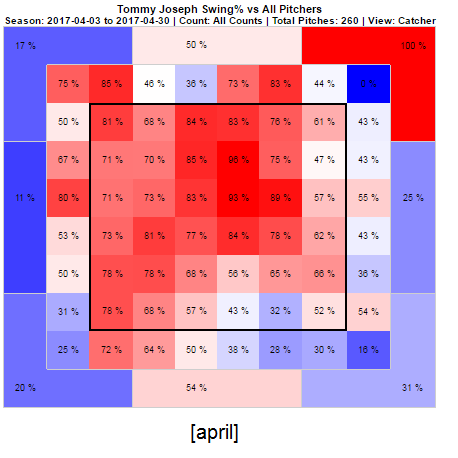
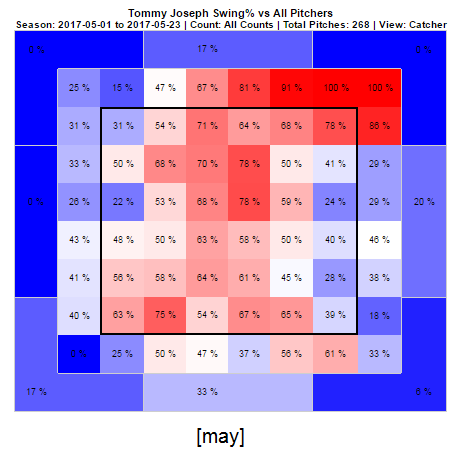
Among qualifying batters, Joseph’s improvement in wOBA from April to May was the largest such increase in the league. Such a change seems unlikely to organically occur, although luck certainly can play a part (I would be remiss not to mention Joseph’s .390 May BABIP). I expect, however, that there’s a more concrete explanation for Joseph’s recent success. It doesn’t take a very long look at Joseph’s numbers to get an idea of how he altered his approach. Put simply, Joseph stopped swinging at everything in and around the strike zone. Compare the following two heat maps, one from April and one from May:

swing pct - april

swing pct - may

On April 30, Tommy Joseph had an O-Swing%, Z-Swing%, and overall Swing% of 38.8, 78.8, and 56.2, respectively. If those percentages sound high, it’s because they are; they ranked eighth, fifteenth, and eighth highest in the majors. May, on the other hand, has been a different story. While Joseph has still been chasing up-and-away pitches, he’s become far more adept at laying off of pitches on the inner half of the plate (even though he’s seen ten percent fewer fastballs), and has cut down his swinging rate in virtually every other section of the strike zone. With a May O-Swing% of 27.2, Z-Swing% of 63.9, and Swing% of 41.9, one of the majors’ most free-swinging hitters has been playing like one who, while not exactly Joey Votto, is far less extreme, relative to the rest of the league, than he was in April.

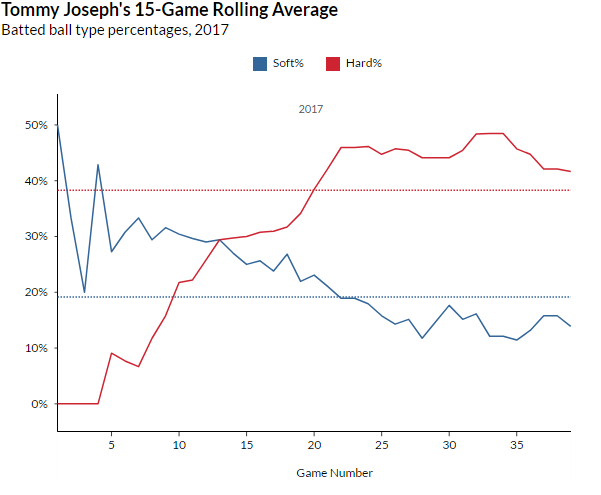
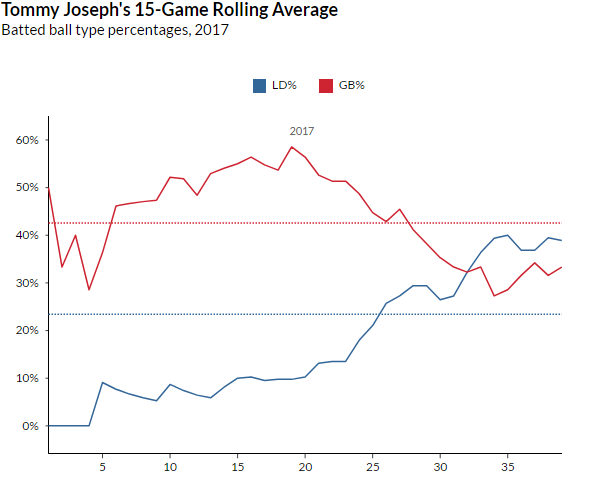
Interestingly, Joseph’s contact rates haven’t significantly changed since he started taking a more patient approach at the plate. We would, however, expect an improvement in the quality of his contact. His hard- and soft-hit percentages have trended in opposite directions since the beginning of the month, as have his line drive and ground ball rates:

rolling HardSoft - Copy

rolling GB-LD

While Joseph’s improvements must be encouraging for a Phillies team that has struggled mightily as of late, it’s still hard to imagine Tommy Joseph being a key contributor on the next contending Phillies team. As mentioned earlier, Joseph has had a .390 BABIP this month, and, even with his more refined approach at the dish, his 22.5 K% and 9.9 BB% in May shouldn’t exactly reassure anyone that he’s anything more than a solid placeholder while the team rebuilds. If Joseph can continue exhibiting patience at the plate, though, he might just put up numbers impressive enough to curb the antsiness of the more impatient members of the Philadelphia fandom. Phillies supporters shouldn’t necessarily give up on the idea that Rhys Hoskins, if he keeps mashing in Triple-A, could reach the majors this year — especially if Joseph gets injured — but as a rebuilding team, the Phillies have no need to rush any of their promising young prospects to Philadelphia. And if Joseph’s discipline changes are for real, they might find themselves with a better placeholder at first base than they may have been expecting.


Vince Velasquez Needs a New Approach, and He Knows it

When the season started I said that Vince Velasquez would be the future of the Phillies…if he could wrangle his fastball usage.

He hasn’t. And after only the first quarter of the season, that might not seem quite newsworthy. His last start was pretty much exactly what we’ve come to expect from him: 6 strikeouts, 2 walks, and 5 earned runs in 5.1 innings. But after the game Velasquez said, “I don’t know. I’m just clueless right now. I’m just running around like a chicken without a head.”

Those are the comments of a player worn down by his own consistent, tepid performance like running water does to the sides of a canyon. Manager Pete Mackanin had his own thoughts after the game. Per Corey Seidman of CSN Philly:

“He just has trouble commanding his secondary pitches,” Mackanin said. “He needs to command his secondary pitches. Once he does that, hitters can’t sit on his fastball. He’s got a real high swing-and-miss percentage on his fastball. I think he’s second to (Max) Scherzer.

“Players don’t square up his fastball but when you can’t command or show the command of your secondary stuff, then they just keep looking for the heater. And if you make mistakes with it, it gets hit. So his challenge is to start gaining better command of his breaking balls.

“If he throws a slider to a hitter and he swings and misses at it and it’s out of the strike zone, he’s got to have the ability to throw another one in the same location instead of just throwing a fastball.”

As of this writing, the Phillies have lost 19 of the last 23 games. They’re in the middle of a rebuild, a phase where they’re expecting the first wave of the next generation to start producing. Velazquez is a critical piece. With how the big picture and current moment are swirling, Mackanin’s comments are worth examining.

image

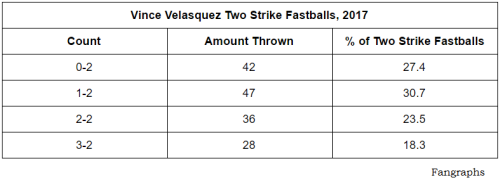
Yes, Velasquez needs to throw less fastballs. His approach is nearly identical to last year. In fact, with two strikes, he’s throwing the heater more often. Given that, even having command of his secondaries may not influence his results much.

And we may not be in a position to say he’s not confident in his secondary offerings because he’s thrown them so irregularly. He’s employed his fastball at least four times more than all of his secondary pitches in two-strike counts this year.

image

The relaxed environment built by the team seems to have enabled certain guys to grow into, or maybe even outgrow, expectations. Freddy Galvis, Odubel Herrera, and Cesar Hernandez all fit that description. But Velasquez could require additional structure. There might already be a successful player in the league to use as a template, too: Chris Archer.

Archer is mostly a two-pitch pitcher. His fastball (used 47.4% of the time this season) and slider (45.1%) account for nearly every pitch he’s thrown in 2017. He sprinkles in a changeup (6.6%) as the game goes on to keep hitters honest when they see him a second and third time. He’s used his slider in two-strike counts this year just about as much as Velasquez has used his fastball, so there’s already some semblance of a formula Velasquez knows that could help him transition his mental approach.

By movement, Velasquez’s slider is basically a flatter, faster version of his curveball. It hasn’t been effective. He’s thrown it less this year than last, but further reducing its use would leave him with an electric four-seamer, a sharp curve, and a solid changeup.

The repertoire would be different from Archer’s, and the effectiveness of its differences could be debated, but the goal would be straightforward: simplify Velasquez’s game, so that when he does find himself in a two-strike count, his fastball could play up like Archer’s slider. Get him out of his head and let his stuff do the talking because it is capable of speaking for itself.

Once he feels comfortable with this strategy, Velasquez could add to the velocity gap between his fastball and changeup, which could provide some much-needed guile to his game. And while it might seem foolhardy to think of step two of a plan for a struggling player before they even start step one, it’s vital, because he’s never had more than one step to his approach.

It’s been apparent for some time that Velasquez throwing only the fastball wouldn’t be enough, no matter how good it is. Now we know he knows it, too, and we’re all waiting for the next step.


Is Launch Angle Having a Contact Cost?

This is for now the final article of my launch angle series (Sorry Carson, or whoever edits all those articles).

Alan Nathan wrote an article that suggested that a steeper attack angle (upward swing angle of the bat) produces more extra-base hits but has a cost in power.

That makes sense since the average pitch only has a downward angle of like 5-10 degrees and if you swing up at 20 degrees you are on plane with the pitch for a shorter time.

Unfortunately, we don’t have attack angles for pro players in games, because there are cheap bat sensors that measure that now but they have only been used in ST and futures games (suggesting attack angles of like 8-15 in most cases I have seen), but I will assume that the average exit angle over a long sample should be pretty similar to the attack angle, or at least correlate closely.

For that, like in my last post, I looked at guys that had at least 500 ABs in 2015-2016.

I looked at LAs of <7, 7-9, 9-11, 11-13, 13-15, 15-17 and >17 degrees.

LA <7  7-9 9-11 11-13 13-15 15-17 >17
K% 18.2 18.2 20.7 19.7 20.3 19.3 20.7

I did not really find very big differences. Below 9 degrees it was about 2 percent lower than at the higher angles, but after that there isn’t a big change. Even looking at the small sample above 19 degrees, it was only elevated to 21.6%, which is higher but not spectacular (and it was a small sample of only seven batters).

To look further I looked at exit velo. If I looked at the batters above 91 mph they averaged 23% Ks, vs 19.1% for the below-91 group.

So there may be some penalty for swinging hard, but there also might be a selection bias, since low-power swing-and-miss guys are weeded out while power hitters with bad contact skills produce more and stay in the league longer.

Overall, looking at those data, I would say that contact is mostly a skill that is separate from launch angle. In my prior articles I have shown that there is a punishment for  angles that are too high, but it seems to come more in the form of pop-ups and routine fly outs and thus lower BABIP, and not in the form of whiffs. Now we know there are some high-LA, high-whiff guys like Chris Davis for example, and those guys do trade BABIP for ISO with higher LAs to get the most out of their contact, but the more extreme uppercut likely isn’t the source of their whiffs but an attempt to compensate for them by trying to strengthen their strength while “punting” their weakness.


Should You Be Buying Into Zack Cozart?

No, you shouldn’t. Well, that was easy. I’ll be moving on to my “Why Haven’t You Bought Jeff Samardzija Yet?” article now.

OK, so it’s not quite that simple and I suppose you want some things like facts, charts, numbers, etc, etc.  You FanGraphs readers are all the same.

Zack Cozart has been a bit of a fantasy darling early this year. Writers have pointed out his 13%+ walk rate to begin the year. His improved .230+ ISO. His .340+ batting average (I hope this is still valid by the time we go live, because it probably won’t be). Because you’re FanGraphs readers, I also know you’ve already looked at his .400 BABIP and processed the fact that he’ll likely regress, but how far? To what level? Will he be 12-team mixed relevant? 10-team? I’d like to take a shot at answering those questions.

First of all, it’s not all bad news with Cozart. As Travis Sawchik would say, Cozart has joined the merry band of fly-ball revolutionaries, as evidenced by his increased fly-ball rate from 2013 to 2016, and he was on my list of possible value picks coming into auction season. His overall value in home-run leagues is capped by his HR/FB%, but I play in quite a few TB leagues so I wanted to keep an eye on him.

Zack Cozart FB% & HR/FB% By Year
Year FB% HR/FB%
2013 31.6% 8.1%
2014 37.7% 2.5%
2015* 42.2% 12.9%
2016 39.9% 10.5%
2017 40.7% 17.4%
* 53 games

I have a tool I like I built in Excel years ago to monitor BABIP-inflated statistics, and to regress the triple slash lines based on expected normalish-BABIP for ROS.

While Cozart is currently sporting a triple slash line of .348/.428/.585, his .394 BABIP says that he should have approximately 10-13 fewer hits than he’s accumulated this far. It’s ~10 hits if you assume a league-average BABIP and ~13 hits if you assume his career .281 BABIP. What this means for you is that Cozart’s talent level right now is only supporting a .251/.331/.528 triple slash, or .274/.354/.541 if you believe he’ll overachieve his career BABIP.

You may be thinking, okay, that’s great, sign me up, but there’s just one more outlier caveat on Cozart’s amazing start to this season. Did you spot it?  He has four triples already! Unless you’re an extremely speedy player, and Cozart is not, triples basically come down to batted-ball or fielding luck. Hit it in just the right spot, or have a fielder take a bad run at a ball, and voila, you’ve got a triple (when you’re not fast).

If we were forecasting Cozart’s triples for the rest of the season, based on his lifetime triples output, he might accumulate three more triples over the course of the final ~125 games, and we should probably have expected him to have only one or two thus far this season. If we correct for this we can adjust his SLG to somewhere between .485-.495, or another way to look at it is via his ISO which I’d forecast to be somewhere around .170-.185.

Overall, if we’re projecting Cozart out over the rest of the season, I think it would be safe to bank on something in the range of .260/.340/.490, which isn’t a bad player and allows for some of his HR/FB% luck to stick in his projection. For those of you playing in OBP leagues, you can monitor the walk rate and perhaps you’ll get some new-found value there this year. With the growth we’ve seen in Cozart’s fly-ball rate, along with his corresponding doubles and home-run output over the past three years, he should safely set career highs in SLG and WAR.


Miguel Sano Is the Three True Outcomes Hitter We’ve Been Waiting for

The idea of a “three true outcomes” (TTO) hitter, a batter whose plate appearances typically end in a walk, strikeout, or home run, is nothing new — Rany Jazayerli proposed the idea all the way back in the forgotten year of 2000, when the Backstreet Boys dropped their latest hit album “Black & Blue” and Dora the Explorer debuted.

In that article, Jazayerli describes how the Rob Deer Fan Club (of which I am a card-carrying member) had just discovered the newest prophet for the gospel of TTO — Russell Branyan, who seemed poised to demonstrate the TTO philosophy on the big stage, had just been named the Indians’ top prospect by Baseball America.

While Branyan lived up to the TTO promise, it appears as though he may have been a false prophet — Branyan struggled to stay in a starting role, jumped around the majors for a bit, and never made a significant impact while he played.

Worry not, for the Rob Deer Fan Club (or as it is otherwise known, the RDFC) was not without a champion during the 2000s. I present to you our holy savior, Adam Dunn. Dunn surpassed Deer as the king of the TTO, finishing his career with a TTO% (HR+BB+SO/PA) of 49.9% to beat Deer’s 49.1% figure. Dunn clubbed 462 home runs, drew 1317 walks, and struck out 2379 times — finishing 35th, 42nd, and 3rd respectively all-time despite only playing 14 seasons. He out-Deer’d Deer!

Nevermind the fact that the RDFC was blessed with the presence of Jack Cust, who set the TTO% single-season record in 2007 with a TTO% of 58.2% (among qualified players). Or Jim Thome, who in his quiet and humble way, finished his career 4th in TTO%. How about Mark Reynolds? Or Ryan Howard? Or Pat Burrell? All of them are worthy disciples of the school of TTO.

But it has been years since we’ve seen someone live up to the TTO promises of Mark McGwire’s 1998, where he finished with a TTO% of 56.8% and a wRC+ of 205. Why did the gods of TTO forsake us?

Mercifully, our prayers have been answered, in the form of Miguel Sano. Sano is on pace to the be the first player since McGwire to finish with a TTO% of 55% or more and with a wRC+ of 150+. In fact, Sano is on pace for the highest TTO% ever: 59.4% entering Monday.

This raises the question: how is Sano doing this?

Sano has a few things going for him, namely his contact. Sano is seemingly no longer hitting balls softly — end of story. Not only is Sano posting the lowest Soft% ever (3.9%, besting Joe Mauer and Briant Roberts’ 2006 figures of 5.1%), but he’s also second in the majors in Hard%. Sano is leading the average exit velocity charts by 3.6 MPH — our lord Rob Deer must be smiling down upon him.

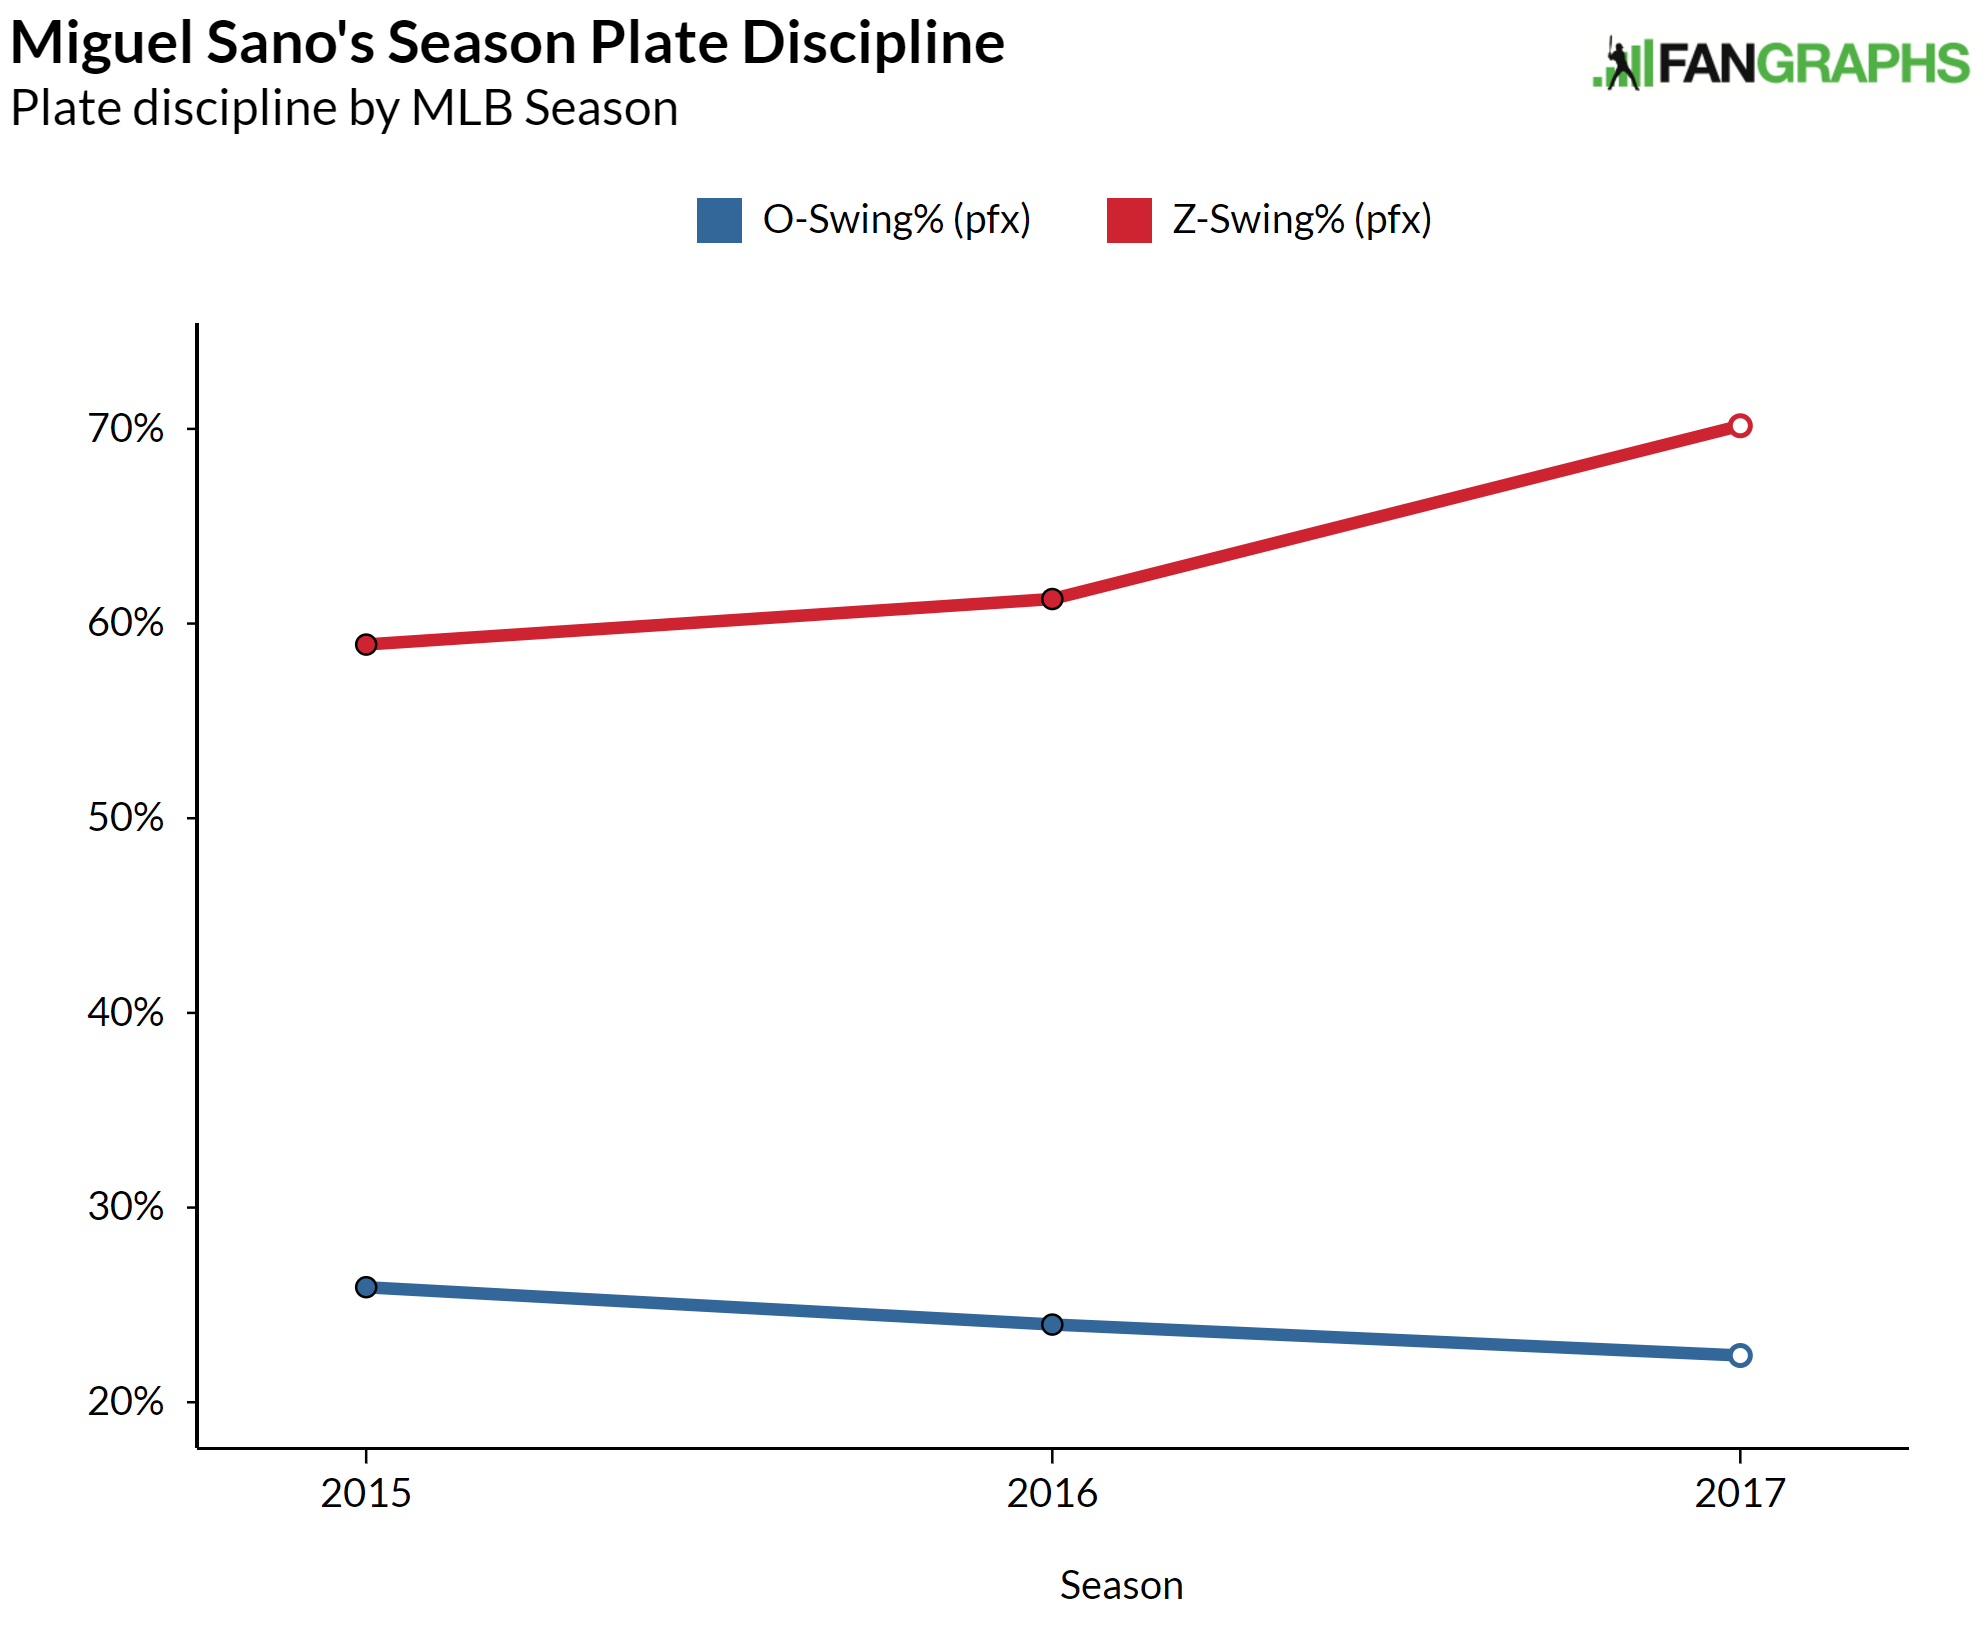
Sano’s plate discipline has also quietly improved. This season represents the high mark for his Z-Swing%, and the low mark for his O-Swing%. This is crucial to executing the TTO philosophy — by swinging less at pitches out of the zone, Sano draws more walks, and by swinging at pitches in the zone, Sano avoids taking strikes.
Miguel Sano Z-Swing% vs. O-Swing%

Sano is still striking out at the same rate that he’s done in his career — his 35.2% figure for 2017 is roughly in line with his career 35.7% figure. But by improving his discipline, Sano has managed to bolster the weakest portion of his TTO game — walks. Sano has seen his BB% skyrocket from 10.9% last season to 18.2% this season. Furthermore, Sano made an adjustment to his swing this offseason that may have sent his swing from one of the hardest in the game to the hardest in the game — by miles.

We are only a quarter of the way through the season, which means that we still have three-quarters of the season left to see players regress, get injured, fall into old habits, etc. But it also means that we’ve seen Sano sustain being the best TTO hitter since McGwire for an entire quarter of the season.

Sure, Sano is hitting with a .463 BABIP and a 28.6% HR/FB%. But he’s also making the best contact of anyone that FanGraphs has ever measured — so such a crazy high BABIP and HR/FB% might not be as unsustainable as you think.

Regardless of how Sano finishes the season, I and my fellow Rob Deer Fan Club members are thanking the holy trinity of Home Runs, Walks, and Strikeouts (hallowed be thine names) for blessing us with Sano, who stands to be a treat to watch for the foreseeable future.