Archive for May, 2016

xHR%: The Finale

This is the final part of a six-article series on xHR%, a metric devised rather unoriginally by myself. If you feel so inclined, you can look at the other parts here: P.1, P.2, P.3, P.4, P.5.

It’s always nice when things mostly work out. More often than not, when someone devotes countless hours to some pet project, whether it’s a scrapbook of some variety or an amateur statistical endeavor, it doesn’t work out terribly well. From there, one often ends up spending nearly as many hours fixing the project as they did on putting it together in the first place. The experience is incredibly frustrating, and it’s something we’ve all gone through at one time or another.

Luckily, my “quest” went much better than that of Juan Ponce de León.  While I didn’t find the fountain of youth, I did find a formula that works moderately well, even though I can only back it up with one year of data at this point. The only thing Señor Ponce de León has to brag about is being arguably the second most important explorer in colonial history. Somehow those things don’t compare particularly well.

Nonetheless, things do look quite good for xHR% v2. I culled data from a variety of sources, but mainly from FanGraphs and ESPN’s selectively responsive HitTracker. I used FanGraphs for FB%, HR, AB, and strikeout numbers (in order to find BIP, I subtracted strikeouts from at-bats). On the other hand, HitTracker was used just for home run distance numbers and launch angle data. I studied all players with at least 1200 plate appearances between 2012 and 2014 in order to ensure some level of stability for the first sample taken.

And so, without further ado, take a few seconds to look at some relatively interesting graphs (I forgot to title the first one, but it’s xHR vs HR).

Here, it’s fairly easy to discern that there’s a strong relationship between expected home runs and home runs. It doesn’t take John Nash to figure that out. What is fairly interesting, however, is that the average residual is quite high (close to 2.5), indicating that the average player in the sample hit approximately +/-2.5 home runs than he should have. That difference comes from a number of factors which the formula attempts to account for. They include home ballpark, prior performance vs. current performance, and weather. One of the issues, and this was bound to be a problem because of the sample size, is that there aren’t enough data points for players who hit 40+ home runs, so it’s hard to say how accurate the formula actually is as a player approaches that skill level.

This is a slightly zoomed-in version of expected home run percentage vs home run percentage. Clearly, there’s a much stronger relationship between HR% and xHR%, due in large part to the size of the digits and because the formula was written to come out with a percentage, not a solid number. But I won’t waste too much time on xHR% because, quite frankly, it’s far less interesting and understandable than actual home run numbers.

For the interested and worldly reader, here are the equations for each:

xHR: y=.0019x²+.9502x+.1437

xHR%: y=1.0911x²+.9249x+.0007

If either of these equations gets used at all, I expect it will be xHR because home run numbers are far more accessible than home run percentage numbers. Frankly, I regret writing the formula for xHR% for that very reason. This is supposed to be a layman’s formula, so its end result should be something understandable to the average baseball fan. It should be self-evident and easy to comprehend.

Thank you for following along as the formula developed over time. Obviously, it isn’t done yet and it requires some changes, but it’s close enough to where it needs to be. It’s very similar to getting to the door of the room where the Holy Grail is, shrugging, and turning around with the intention of coming back in a few weeks (although in this case it must be noted that the Holy Grail isn’t the real one, but a plastic one covered in lead paint). Expect a return under a different name and a better data set.

You’ll notice that I didn’t include very much statistical analysis at all. I figured that was rather boring to write about, but you can feel free to contact me for the information if you would like a nice nap.


The Danger of Fly Balls

Last year, I suggested that Wilson Ramos might want to try hitting the ball in the air more.

It turns out, there is a Washington National who appears to have made an effort to put the ball in the air more, but that is not Wilson Ramos. It is their soon-to-be-erstwhile shortstop, Danny Espinosa.

Last year, Espinosa rode a hot start to a .240/.311/.409 line at the end of the season, good enough for a 94 wRC+. It was his first offensive season since 2012 that you would accept from a starting middle infielder, and you’d be excused for seeing it as a sign that he might be back to his 3-win form of 2011 and 2012.

This year, however, Espinosa is scuffling to a .201/.307/.288 line that has been inflated by five intentional walks. Overall his wRC+ is down to 58.

One might look at his 23% strikeout rate and note that, while poor, it is still better than his 27.5% career mark or 25.8% 2015 rate. (His plate discipline numbers are indeed better this year than last.) One might notice a .250 BABIP compared to his .296 career number and expect improvement there. Also noticeable is a 7.0% HR/FB rate when his career mark is 12.9%. So perhaps we could expect something more like his 86 career wRC+ going forward? Or at least his Steamer projection of 79? (That is, if Trea Turner weren’t highly likely to be called up shortly.)

Possibly, but there is something else about Espinosa’s numbers that create pause: he has become a fly ball hitter. Entering this season, Espinosa had never posted a full-season GB/FB ratio lower than 1.12, but this year he has hit 37 grounders and 43 flies for a 0.86 rate.

If you hit a lot of fly balls, your BABIP is going to suffer. If those flies don’t turn into home runs, it’s a double whammy, and Espinosa is certainly getting whammed pretty good by that combination.

This is the danger of fly balls. And they could become even more dangerous if you try to hit them.

I can’t read any player’s mind, so perhaps Espinosa just happens to be hitting the ball in the air more. But ground ball and fly ball rates stabilize pretty quickly, and how you hit the ball is one of the more controllable aspects of hitting (it’s where the ball goes that’s the rub).

Espinosa has had above-average power, so why not try to convert that into extra home runs by hitting more flies?

Another way to look at hitting grounders vs. hitting flies is the target launch angle. So another way to interpret “hit more fly balls” is “hit the ball at a higher angle.” Espinosa is hitting the ball at too high an angle, and it follows that if you intend to hit more fly balls, they may well on average end up launching at a higher angle than in the past.

Monday night was the clearest example yet of this problem: Espinosa hit fly balls at 56, 59, and 61 degrees in his three plate appearances, and all three were easy outs to left field. As for the exit velocity, his contact in the air spent much of this season around 95-96 mph, which is good, but that hasn’t done any good without the right launch angle, and now he’s also down to 94.5 mph on the season when he hits the ball in the air, with Monday’s 86, 89, and 92 velocities contributing to that decline.

This turned into an analysis of why Espinosa has been struggling even more than the most pessimistic might have imagined. Perhaps there is a general lesson as well, however, beyond the well-established fact that fly balls without home runs are nigh useless.

Some players might want to pick one approach and stick with it to improve as much as possible. This is especially true if that hitter isn’t a great one, because they might not get the results they are hoping for by changing things up. Although you could argue the potential rewards for a below-average hitter are worth the risk and it just hasn’t worked out for Espinosa, one might counter that the likelihood of the change working for a less-talented hitter is quite low. (And the risk in this particular case was even higher with the hot prospect on his tail, limiting the time he had available to work things out.)

Take Ramos, a better hitter than Espinosa over the course of their careers, but not a spectacular one either. He hasn’t changed a thing in ground/fly ball terms: his 2016 GB/FB ratio is basically identical to his 2015 ratio, but his BABIP has gone from .256 to .370 and he is hitting .333/.385/.512. That won’t continue, but his ROS projected wRC+ has improved to the 90’s, when his actual wRC+ in 2015 was just 63.

Consistency in approach can produce better results with time. If you want to change things up, beware the risks. You may end up with the worst of both worlds.

You could also end up succeeding, as Leonys Martin has.


The Evolution of Xander Bogaerts

Since dominating the Dominican Summer League as a 17-year-old shortstop, Xander Bogaerts has been considered one of the elite young talents in the game, heralded for his on-base ability, and specifically his power.  After being promoted to start the 2011 season in Greenville, the Aruban native continued to rake, proving his skills at every rung of the organizational ladder.  At each full-season minor league level, Bogaerts never ran a wOBA below .366, and his lowest ISO was a very respectable .169.  It seemed as if he were destined to inherit the throne left vacant in Boston since Nomar Garciaparra departed in 2004; fans drooled over his future as the Red Sox’s franchise cornerstone, anchoring the heart of the Boston lineup while playing a premium defensive position.

On August 19, 2013, with Stephen Drew mired in a slump and the Sox struggling, Bogaerts was promoted from Pawtucket and joined the team in San Francisco, thus beginning his tenure in Boston.  Bogaerts appeared in 18 games down the stretch, hitting only 1 home run and watching his K% balloon to 26%.  However, his struggles were mostly ignored as the team wrapped up the division, and all concerns were quieted by the maturity he demonstrated after being inserted into the Sox’ starting lineup on baseball’s biggest stage, as evidenced by his .386 wOBA during the postseason run culminating with a title.  At the tender age of 20, Xander Bogaerts was a World Series champion, appearing poised for a Rookie of the Year campaign in 2014.

Unfortunately, Bogaerts failed to meet expectations in 2014, posting his worst season as a professional by far.  After a hot start, he collapsed in the second half.  He continued to strike out in nearly 25% of his plate appearances, his 6.6 BB% was a career worst at the time, and he finished with a disappointing 82 wRC+.  Bogaerts’s struggles were driven by his inability to hit right-handed pitching, as he posted a measly .105 ISO against righties coupled with a 71 wRC+.  The following image should help to explain the decline:

After getting ahead in the count, righties attacked Bogaerts down and away, leading him to chase breaking balls and expand the strike zone.  In fact, on a per-pitch basis, the rookie shortstop was the fifth-worst hitter in baseball against the slider.  With his confidence shattered after a poor performance at the plate along with Boston’s decision to sign Stephen Drew midseason, outsiders questioned whether Bogaerts could recover from his prolonged slump, while some predicted that he would be the next big prospect to bust.

After admitting that 2014 was probably the “toughest season [he] ever had,” Bogaerts entered 2015 once again as Boston’s starting shortstop, hoping to recapture the stroke that propelled him to the big leagues so rapidly.  Although he collected a Silver Slugger and seemingly accomplished his goal, Bogaerts exhibited a vastly different approach, one in stark contrast with his minor-league track record.  While he retained his high on-base ability, rather than selectively punishing mistakes, Bogaerts became a more restless slap hitter, sacrificing power in exchange for contact.  He boosted his Swing% by almost four points, offering at nearly half of the pitches he seen, but his ISO fell to a career worst .101.  This change can be attributed to his increased willingness to use the entire field; Bogaerts boosted his Oppo% by 13 points but showed nearly no power when going to right field as evidenced by a Hard% of only 14.5.  He also become an above average hitter on a per-pitch basis when challenged with sliders, improving upon perhaps what was his biggest weakness.

This more aggressive approach resulted in a significant drop in Bogaerts’s K%, coupled with a smaller decline in his BB%.  He finished the year with a much-improved 109 wRC+, certainly playable when coupled with league-average defense at shortstop, yet he left much to be desired in the minds of talent evaluators around baseball.  Rather than demonstrating the power he had exhibited throughout his minor-league career, Bogaerts instead resembled a weak middle infielder.  Once destined for stardom, Bogaerts had been relegated to an average shortstop, definitely a valuable piece on a contending team, but not the player many had projected him to be.

Now over 40 games into the regular season, despite capturing success in 2015, rather than settling, it appears that Bogaerts has once again evolved.  A quick glance at his numbers may suggest his improved offensive performance can be chalked up to luck, as evidenced by his high BABIP, but a deeper look at his underlying peripherals indicates that Bogaerts may have once again altered his approach at the plate.  First, he is proving that the decrease in K% is legitimate; Bogaerts is once again running a strikeout rate below 16%, nearly five points better than league average.  This year, it also appears that he has developed better command of the strike zone, as the has cut down his swing rate while boosting his BB%, both to nearly league-average levels.  More important than these, however, may be the reemergence of Bogaerts’s power.  Through 40 games, Bogaerts is running an ISO of .157, a level that he never once reached during his miserable 2015 season.

Unlike other unsustainable power surges, it seems as if Bogaerts’s may be viable.  His HR/FB has risen by nearly six percentage points, yet it still falls below the league average.  Statcast also seems to confirm our findings, as Bogaerts’s average exit velocity has risen by three miles per hour since the end of last season, although this data is still relatively new and cannot be considered a perfectly reliable indicator of future performance.  The majority of Bogaerts’s damage this season has come to the pull side, as his wRC+ has jumped by almost 100 points, and it seems as if he is making a concentrated effort to elevate more of the balls that he hits to left, as his FB% to the pull side has increased by nearly four points.  His bloated wRC+ will almost certainly fall, as a 44.4% HR/FB ratio to left field is absolutely ridiculous, but Bogaerts’s new offensive approach suits him well.

As seen in the table, Bogaerts is also demonstrating more power going the other way, and although his solid contact has still not resulted in any home runs to right field, the singles of 2015 have transformed into doubles this season.  Although he still sees the same number of percentage of pitches in the strike zone, it seems as if pitchers are approaching Bogaerts with more trepidation because of his newfound power, as he is seeing fewer fastballs this season than at any point during his major-league career.

The projections are a bit skeptical, as they forecast a fall in both BABIP and ISO, but if Bogaerts is able to maintain his current level of production, or really anything near it, 2016 will be his most successful season in the major leagues, by far.  He has undergone a major transformation at the plate, yet he has essentially reverted to the hitter he was as a prospect shooting through the minor leagues.  The strikeout-prone 2014 Xander Bogaerts gave way to the slap-hitter 2015 version, which then evolved into the more selective and powerful current manifestation of the young shortstop.  Perhaps most intimidating, however, is the fact that Bogaerts remains only 23 years old, and his evolution may not be complete.  Overshadowed prior to this season by the likes of Carlos Correa, Francisco Lindor, and Addison Russell, Xander Bogaerts appears set on mashing his way back into the conversation as the best young shortstop in baseball.


Exploring Uncharted Territory with Leonys Martin

Edit: Since this piece was submitted (May 23), several developments in the Martin narrative have arisen, notably some more astute analyses than mine (namely Jeff Sullivan’s great piece on Martin’s batted-ball profile & an extremely in-depth look at his swing mechanics by Jason Churchill over at ProspectInsider, do go check him out) as well as this walk-off dinger against the Oakland A’s. 


A lot has gone right for the Seattle Mariners in new GM Jerry Dipoto’s first season. At time of writing, they sit in first place in the AL West with the third-best record in the American League and the best road record in baseball. One potential factor in Seattle’s success that has, until recently, taken a backseat to Robinson Canó‘s resurgence and Dae-Ho Lee’s power-hitting heroics is the sudden onset of what could turn out to be an offensive breakthrough for outfielder Leonys Martin.

The Mariners’ acquisition of Martin and Anthony Bass in exchange for Tom Wilhelmsen, James Jones, and a PTBNL (Patrick Kivlehan) is one of several moves last offseason that seem to follow a common guiding principle: bring in players who’ve struggled in recent seasons but demonstrated real value in seasons past. This category includes the likes of Steve Cishek and Chris Iannetta, both of whom seem to have (thus far) rebounded from uninspiring 2015 campaigns.

Meanwhile, Leonys Martin is having the best season of his life. This is mostly remarkable due to the fact that his hitting isn’t, and has never really been, the source of his value. He’s never topped 89 wRC+ in any season, and his career high for home runs in a year is eight. He’s also been historically abysmal against left-handed pitching. From 2012-15, Martin slashed .233/.274/.298 with 53 wRC+ against southpaws; no outfielder in baseball posted fewer wRC+ in that same span (min. 300 PAs). His poor performance in the second half of 2015 (.190/.260/.190 with 22 wRC+ after the All-Star break) earned him a demotion in early August. That lackluster second half, coupled with the emergence of Delino Deshields Jr. as a capable replacement, made it a lot easier for the Rangers to part with him in the offseason (incidentally, DeShields was demoted in early May and Wilhelmsen has been the worst reliever in the majors this year by fWAR, so that’s something).

Going into this season, Steamer projected him for around 492 PA with a .241/.292/.350 slash line and 79 wRC+, in addition to eight homers and 22 stolen bases, putting him on course for 1.2 fWAR. While not exceptional, this likely would have been an adequate season for Jerry Dipoto given the cost, especially at Martin’s $4,150,000 salary, but Martin’s already managed to match that mark, posting 1.4 fWAR as of May 23rd, and he’s providing a great deal of that value with his bat.

Martin seems to have shook off a bit of whatever seemed to be plaguing him at the tail end of 2015. He’s slashing .252/.331/.467, which would, over a full season, leave him with a career-best OPS of .798 and 124 wRC+. He still hasn’t been able to hit lefties, but that’s what platooning is for. But by far the most eye-popping aspect of Martin’s game this year is what looks like a sudden influx of power. Martin’s mark of .215 ISO is easily the best of his career — his eight home runs have already matched his career-best single-season total — and it’s not even June yet. With no context, one could look at Martin’s line thus far and notice that he might be on pace to post a 30 HR/30 SB season, if not for the slight inconvenience called “At No Point In His Career Has Martin Demonstrated That He Might Even Touch 30/30”. And yet this is baseball, and this is 2016, the Year of the Bartolo Colón Home Run. Anything is possible.

So — what’s changed for Martin? And perhaps more importantly, where the heck did all these home runs come from?

We turn first to Martin’s batted-ball profile. For the last two-and-some seasons, Martin’s fly-ball percentage has actually increased. His 2015 mark of 33% was actually a career-best at the time, especially considering it was brought down by his abysmal second half. He’s picked it back up in 2016, with a gaudy 45% fly-ball rate. Of course, the sustainability of this figure is questionable (one might also point out Martin’s likely inflated HR/FB rate of 20.5% — opposed to a current league average of 12.1%), but at no point in his career has Martin hit fly balls with such consistency:

Other indicators of improved power add credence to this positive trend. Martin’s quality of contact also seems to have improved this year, as his hard-hit ball rate of 34.4% is vastly superior to his pre-2016 range of about 23 – 25%. It’s also true that home/road splits affect the narrative somewhat, as only one of his eight home runs occurred at Safeco Field. But I suspect that there may be more to Martin’s offensive resurgence than just hitting balls harder.

One of the feel-good narratives of this season is the positive influence that new hitting coach Edgar Martínez has introduced to the Mariners offense, which currently ranks 2nd in the AL in runs scored. Martinez was brought in to replace Howard Johnson in June 2015, hoping to fix an anemic Mariners offense that struggled early and often. To date, that new appointment has been received with praise from Seattle media and fans, but more importantly from the players themselves. Could it perhaps be the case that Edgar’s tutelage, along with Jerry Dipoto’s promise to mold the 2016 Mariners to fit his “Control the Zone” philosophy, has brought about a positive change in the way Leonys Martin approaches hitting?

Overall, Martin’s plate discipline metrics show that his approach at the plate hasn’t changed too drastically from last season. If anything, his 70.4% contact rate is his lowest since 2012. One other thing sticks out here, namely that Martin seems to be more patient on pitches out of the zone and more aggressive on pitches in the zone. Compare the percentage of pitches he swings at in 2015 (left) to 2016 (right), courtesy of BrooksBaseball.net:

There is a relatively noticeable difference here, especially on high and outside pitches. According to PITCHf/x, his O-Swing% of 27.9 is easily the lowest of his career. Likewise, his Z-Swing% of 67.0 is his highest since 2012. These are generally good indicators that Martin is seeing the ball better or, at least, cut down on his tendency to chase pitches out of the zone.

And then there’s the matter of his batting stance.

Take a look at his stance for this home run on May 27, 2015, facing off against Scott Atchison:

Now check out his stance almost a year later, on May 22, 2016 in this at-bat against John Lamb.

An important thing to note about these stills is that I picked them mostly because of their similar camera angles. Martin’s foot position in other highlights is often obscured by the pitcher, or the pitcher is already in the middle of his wind-up, giving Martin time to square up before the pitcher’s delivery (as is slightly apparent in the at-bat against Lamb). But the vast majority of video evidence from this season is consistent with the idea that Martin has generally closed off his stance and now begins pretty much every at-bat with his feet squared to the pitcher. Now, I am aware that the batting stance is a rather fluid component of any baseball player’s oeuvre and can change for a number of reasons, not all of them being deliberately engineered to improve performance. I can’t seem to find anything about Martin having changed his stance online, aside from this ESPN piece from February of this year — but the focus of that article is on a legal issue Martin dealt with over the offseason, and the only comments offered on Martin’s approach seem to indicate that his stance hadn’t actually changed:

Martin also worked with a hitting instructor during the offseason in Miami. He altered his approach at the plate — his stance remains the same, he said — and he was pleased with the results when he faced pitchers in winter ball.

The most significant changes I’ve noticed as a result of comparing film from 2015 to film from 2016 are the aforementioned foot positioning and the fact that his hands are a little bit closer to his body this year. Generally speaking, though, it’s hard to really quantify the connection between a player’s stance and his performance. If this change in stance is deliberate, we can only really speculate as to the reasoning behind it. There are certainly good reasons to make the adjustments Martin has made. Bringing the hands closer to the body is often a nice starting point for a player who wants to make his swing a little more compact and less erratic. As for the foot positioning, there are a few benefits to batting with an open stance, especially for a left-handed hitter. One is that it enables left-handed hitters to see the ball better, especially when facing a left-handed pitcher. Another is that it eliminates the problem of the front foot stepping away from the plate on the swing, as batting from an open stance requires you to bring your front foot towards the plate in order to square up to hit the ball. It’s hard to say if Martin has previously had this issue in the past, but the fact that he’s changed from an open stance to a square stance likely indicates to me that whatever advantage he gained from an open stance may no longer be necessary. We don’t know if Martin has made these adjustments for the reasons listed above or if he has made them for any real reason at all, but he’s still made them all the same, and as it happens, they’ve been working out quite nicely for him.

That said, let’s not go overboard about a quarter-season of statistics just yet. Though Martin is posting career bests in almost any meaningful batting metric, there is still reason to believe he might still turn out to be an average or below-average hitter for the rest of the season. His on-base record is rather inflated by recent performances, he strikes out too much, and he continues to sport uninspiring numbers against left-handed pitching. All the same, his eight home runs this season aren’t going away, even if his fly-ball rate might. It’s unlikely, barring injury, that he’s not going to hit any more home runs for the rest of the year, so 2016 will most likely be a career year for him in the power department, and if his BABIP mark of .302 this year can regress back to his 2013-14 average of .326 rather than his poor 2015 mark of .270, 2016 may turn out to be a career year for him across the board. Martin’s offensive production has certainly been a pleasant surprise for the Mariners, and it would be interesting to know if altering his batting stance was a deliberate factor in producing an improved approach at the plate. If the Leonys Martin we’ve seen so far this year is anything like the Leonys Martin we’re going to see for the rest of the year, Jerry Dipoto may have stumbled upon a surprisingly high return on what was initially a low principal investment.


Are the Rays Swinging Harder?

The Rays are known as one of the most sophisticated organizations in the MLB, mostly thanks to an advanced analytics department. They have been first adopters of some of the now prevalent advanced baseball strategies today. They perennially are winners with annually low payrolls.

The Rays sometimes blow me away with the strategies discovered and implemented by their analytics departments. One of the most fascinating strategies they implemented at the beginning of last year was getting their pitchers to throw fastballs with more rise high in the zone, causing pitchers like Drew Smyly and Matt Moore to make drastic improvements in their results. Now I believe they are having their hitters implement a new strategy.

Swinging hard.

I cannot be positive they are telling their hitters to swing harder, but there is some evidence to lead me to believe this is true.

The Rays strike out a lot. Almost all their players have strikeout rates above their ZiPS and Steamer projections and they currently have one of the highest strikeout rates in baseball. A strikeout is the worst outcome possible for a hitter, so at first glance the Rays appear to have a lot of hitters who have gotten a whole lot worse. It’s clear looking at the data this isn’t just variance. Across the board for the Rays, the contact rates of their hitters have been much worse this season than the previous, an average decline of about 5%.

There are a few possibilities that come to mind that could explain the decreased contact rates. The first one is luck. It is possible most of the Rays contact rates have decreased because of chance alone. This is certainly possible, but also unlikely. The 5% decrease in team contact rate is by far the highest margin in the league.

Because of the degree of the contact rate change, it’s unlikely that the Rays’ worse contact rates are happening purely by chance. That leaves two possibilities in my mind. One possibility is the Rays have advised some or all of their hitters to take more of an uppercut swing. A steeper or uppercut attack angle of the bat theoretically should lead to less contact, so this is a possible explanation. If this were true, we would expect the Rays to have more fly balls from their hitters. And they do. Their fly ball rate is up about 3% from last year

But the increase in fly ball rate is only the sixth highest in the league, and can mostly be accounted for by the addition of extreme fly ball hitter Steve Pearce and the loss of extreme groundball hitter John Jaso. I’m also skeptical that a team would try to drastically change all their players’ swing planes. I can’t rule out this possibility though.

That leaves us with the explanation I believe to be true: The Rays have adopted a grip it and rip it mindset. The Rays currently have the highest ISO in baseball, meaning they hit for power better than every other MLB club, a 30% improvement year to year. They also have a large increase in hard contact percentage across the board, an average of about 5% per player, by far the highest increase in the league.

Hitting for power and hitting the ball hard are not unrelated. With MLB Statcast data, we can now see their is a clear and strong relationship between hitting for the ball well and hitting the ball hard. The harder you swing, the harder the ball will be hit. That is if you make contact at all.

2015_exit_velo_woba_qlqbqaxy_l47u9kzb

If contact wasn’t an issue, swinging hard would be a no-brainer. But there is a trade-off here. While a home run is the best outcome for a hitter, the strikeout is the worst. If you hit the ball in play, you can advance runners and get on base. With a strikeout, neither of those things will happen.

But is the increased power really worth increased strikeouts? The Royals would beg to differ. They won the World Series last year with historically good contact and strikeout rates. However, no one would argue that hitting was the biggest reason for the Royals success. On the contrary, it was really their bullpen and defense that carried them to a championship.

I can only imagine that the Rays have done the math and have decided: Yes, it’s worth the trade-off. Hitting the ball high and hard is good, and the Rays are doing that better than practically everyone else in the majors. Yes they are getting less contact, but the Rays do not have an abundance of talent in the batting department, so given their results I would have to say this change in approach has been a success.


Will the Real Tyler Goeddel Please Stand Up?

Similarly to a large portion of the FanGraphs community, I am a Philadelphia Phillies fan.  I was born in South Jersey just 20 minutes away from the stadium and grew up watching every game.  I was there for the tough times in the late 90’s / early 2000’s, and I was there for the glory days of 2007-2011.  After an abysmal last few seasons of baseball in Philadelphia, we have finally seen some promise this season leading us to believe that better days are coming soon.  One of the bright spots on the team so far this year has been Rule 5 pick, Tyler Goeddel.

After being selected in the first round of the 2011 MLB Rookie Draft, Tyler Goeddel began his professional career with the Tampa Bay Rays.  Goeddel was drafted out of high school as a third baseman and for the first three years of his minor league career that would be the only position he played.  In 2015, however, the Rays decided to move Goeddel to the outfield.  His athleticism allows him to play all three outfield positions and that type of versatility is very sought after by big league clubs.  While defense was never his problem, Goeddel’s bat didn’t develop as quickly as the Rays had hoped.  He was a career .262 hitter with 31 home runs across four full seasons in the minor leagues.  Ultimately the Rays made a tough decision and left him off their 40-man roster, knowing there was a great chance another team would select him in the Rule 5 Draft.  Shortly after, the Phillies did just that and selected Goeddel with the first overall pick of the 2015 Rule 5 Draft.

The Philadelphia Phillies have historically been excellent in finding talent in the Rule 5 Draft.  (2004 – Shane Victorino, 2012 – Ender Inciarte, 2014 – Odubel Herrera).  In the early going, I (like most Phillies fans) was very skeptical as to whether or not Goeddel could follow in the footsteps of players like Shane Victorino and Odubel Herrera and become a valuable contributor to our big league team.  Goeddel had a mediocre spring training but with no other serious competition in the corner outfield spots, there was no harm in keeping him around for a rebuilding year and seeing what the kid could do.

The beginning of Tyler Goeddel’s major league career could not have gone much worse.  Take a look below at his stats through his first nine games:

4:6 - 4:19 Stats

In only 16 at-bats, Goeddel recorded only one hit (a single), and struck out a whopping eight times!  Now obviously this is a VERY small sample size, and we should expect some struggles while adjusting to big league pitching.  Up until this point, Goeddel has never seen pitching above the Double-A level.  Now let’s take a look at his plate discipline stats over the same time frame:

4/6 - 4/19 Plate DisciplineO-Swing % – Percentage of time a batter swings on pitches outside the strike zone
Z-Swing % – Percentage of time a batter swings on pitches inside the strike zone
Swing % – Percentage of time a batter swings at a pitch, regardless of location
O-Contact % – Percentage of times a batter makes contact with a ball when swinging outside of the strike zone
Z-Contact % – Percentage of times a batter makes contact with a ball when swinging inside of the strike zone
Contact % – Percentage of times a batter makes contact with the ball when swinging
Zone % – Percentage of overall pitches thrown to batter that were in the strike zone

There is nothing noteworthy about his swing percentages as they are all just about equal to the league averages, but the contact percentages are quite alarming.  Through his first nine games, Goeddel only made contact 53% of the time he swung his bat.  Rather than just writing this off as a rookie being over-matched by big league pitching, I decided to dig deeper into these stats and figure out exactly where Goeddel was struggling.  Check out the video below that I put together which basically sums up the beginning of Goeddel’s career in 30 seconds:

Whether or not you realized from watching the above video, every one of these swing and misses came on a fastball.  They all also came in the upper portion of the strike zone.  Just by watching Goeddel’s at-bats through this point of the season, it was clear as day to see opposing pitchers were attacking Goeddel with fastballs up in the zone.  The chart below shows every fastball that was thrown to Goeddel over his first nine games.  It is broken up by hot and cold zones and shows his contact percentage versus the fastball at every portion of the strike zone:

4:6 - 4:19 Contact % vs Fastball

This chart verifies for us what we saw in the video…Goeddel really struggled to hit fastballs up in the zone to begin the season.  At this point, everyone was frustrated.  Tyler Goeddel was frustrated because he knew he was much more talented than his results thus far have showed.  The Phillies organization was frustrated because they had such high hopes for Goeddel entering the season.  And most importantly, the Phillies fans were frustrated and began questioning what the Phillies could possibly see in this guy.  (Search for Tyler Goeddel’s name on Twitter and read old tweets from this time period if you don’t believe me!!)

An important thing to remember while looking at these stats, is that up until this point of his career Goeddel has been an every-day player.  Not only is he adjusting to big league pitching, but he is also trying to adjust to not having consistent at-bats.  Since the Phillies unexpectedly got off to such a hot start, an important decision needed to be made.  On one hand, they have this young promising player who will need consistent at bats in order to show his true potential.  But on the other hand, this team is surprisingly in the hunt in the NL East and may not want to allow Goeddel to go through his growing pains while they are competing for the division title.  Eventually, a decision was made and manager Pete Mackanin started to put Goeddel in the every-day lineup. Below are some quotes from Goeddel at this time speaking of the decision:

“Getting regular playing time and the confidence [from that] is huge, but I try to get started a little earlier on my swing so I can be on time with the fastball. You need to hit the fastball if you want to play up here, obviously. I feel like I’ve made that adjustment and it’s been a huge help.” – Tyler Goeddel

“I didn’t play how I wanted to play in April.  And I’m glad he’s (Pete Mackanin) giving me a chance, because I really didn’t play my way into a chance; he just gave it to me. So I’m trying to make the most of it.” – Tyler Goeddel

The video below (from 4/23/16) summarizes Goeddel’s early season struggles and the decision to give him more playing time:

The Phillies coaching staff deserves a lot of credit.  They recognized early on that Goeddel was struggling with fastballs up in the zone and prior to this game really worked with him in that area and promised him more playing time moving forward.  Here is a video of his next at bat in the game, where the pitcher tries once again to attack Goeddel with some high heat:

Goeddel responds with another base hit and his first RBI of the season.  Take a look below at how his stats over his next seven games compare to his stats from his first nine games.

4:23 - 5:6 Stats

4:23 - 5:6 Contact %

You can very easily see that Goeddel drastically improved his contact percentage over this time frame, which resulted in a huge drop in his strikeout rate.  The video below is from 5/8/16, right after the stretch of stats we just evaluated.  Goeddel had a big hit late to tie the game for the Phillies and later came in to score the winning run.

As you could see, the hit came on a high fastball.  A few weeks ago, Goeddel could not touch this pitch…but all of a sudden he is beginning to prove that he can.  The next video is from after that game.  Tyler discusses the adjustments he has made and also how playing every day has contributed to his recent success:

This hit was the start of a new Tyler Goeddel.  Pitchers continued to attack him with fastballs up in the zone and Goeddel really started to make them pay.  This is what he did to a Brandon Finnegan fastball just a few days later:

Ever since that hit on May 8th against the Marlins, Goeddel has been the player the Phillies could have only hoped he one day would become.  He has flashed signs of brilliance in just about every game since that have Phillies fans drooling over what the future outfield could look like.  Even though he has made adjustments and is seemingly now catching up to big league fastballs, opposing pitchers continue to test him.  Check out the video below that I put together showing what Goeddel has done to fastballs in the upper portion of the strike zone over the last few weeks.

As you can clearly see, this is a different player than we saw early on in the season.  Take a look at how his recent stats compare to those early on:

5:6-5:20 Stats

5:6-5:20 Contact %

Goeddel’s contact percentage over his first nine games was only 53%.  Over his last 10 games, it is 91%.  That is an incredible difference and clearly his adjustments are paying off.  In turn, his improved contact has led to a strikeout percentage of only 5.4% over his last 10 games.  The chart below shows how Goeddel has fared against the fastball since he noted his adjustments on April 23, 2016.

4:23 - 5:20 Contact % vs Fastball

Now go back up to the top of the article and compare this chart to what it looked like at the beginning of the season.  More consistent at bats have clearly translated into him catching up to the fastball and the results thus far have been phenomenal.  I have to admit that I was a doubter early on, but I am now completely on board the Tyler Goeddel bandwagon.  This kid is only 23 years old and the fact that he was able to so quickly make an adjustment like this and immediately see results is remarkable.  Now that he is having some success, opposing pitchers will start to change their game-plan against him.  While the pace he is on now may not be sustainable over the course of a full season, I am confident that Goeddel will continue to make the necessary adjustments and help this Phillies team continue to find ways to win ball games.  Although the video below doesn’t exactly relate to his success at the plate, I had to throw this in here and it is a must watch if you have not seen it already:

The last video I will show features Goeddel’s post game interview after this throw:

Recent Quotes:

“It’s exciting.  Coming to the field everyday I’m expecting to see myself in the lineup. That’s a feeling I didn’t have last month. It’s a lot more relaxing, less stressful.” – Tyler Goeddel

“It was definitely a big adjustment, going from playing everyday my whole career to having a specific role, and then not performing well in my role, it was a little tough.  But, you know, they’re giving me an opportunity now and I feel like I’m playing better, which is nice. I’m happy for myself. I always knew I could play up here, but I needed some results to prove it to myself. I’m glad, finally, there are some results to show.” – Tyler Goeddel

I love how confident Goeddel is when he speaks of his game and I am so glad the numbers back him up.  I continue to be blown away watching him play every day, especially due to the fact that he has only been playing the outfield for one year.

Lastly, I want to show a few graphs.  The first one shows a rolling total of Goeddel’s strike out percentage so far this season.  The statistics earlier show you that it has decreased, but this graph makes it much easier to see his progression:

Rolling K%

The next graph is another rolling total showing how Goeddel’s wRC+ has progressed throughout the season.  For those of you who are unfamiliar with the stat, wRC+ stands for weighted runs created plus.  It attempts to quantify a player’s offensive value in terms of runs.  An average wRC+ is 100.  Check out how Goeddel’s wRC+ has improved throughout the season:

Rolling WRC+

What do you think, Phillies fans?  Can Tyler Goeddel keep this up?  Is the Tyler Goeddel that we have seen over the last few weeks the real Tyler Goeddel?  Are you ready to hop on the bandwagon yet or do you need to see more from him to believe?  Only time will tell, but I’m buying into the hype and am excited to see what the future holds for this promising young player.

Twitter – @mtamburri922


A New Hitter xISO, Now with Exit Velocity

Over the last few years, Alex Chamberlain has published a series of posts exploring the concept of xISO. Like the most commonly known xFIP, this metric is supposed to be an “expected” ISO, based on batted ball metrics. Nobly, Alex kept his model quite simple, using only statistics available on the FanGraphs player pages: Hard%, FB%, and Pull%.

I have very little formal training in statistics, most of it is self-taught to help me in my day job, so I’m also going to keep things simple. Inspired by Alex’s work, I began to experiment with improving the xISO model. I started building linear models including more predictors, and even introduced higher order and interaction terms. While these all improved the model slightly, I didn’t feel that the added complexity was worth the slight improvement. Along the way, I noticed that, although Chamberlain makes mention of the correlation between first half xISO and end of season ISO, if I calculated first half xISO and compared to second half ISO, I would find the initial xISO model to be a worse predictor of second half ISO than the actual first half ISO.

As I was running these calculations, I also became acquainted with the publicly available Statcast data through Daren Willman’s Baseball Savant site. Although the gathering of input data becomes a bit more tedious, surely some combination of exit velocity and launch angle information would improve an xISO model, and perhaps produce something which produces a better correlation between first and second halves. Let us see!

First things first, since Statcast is so new, we only have one full season of data. Ideally, we could use multiple years of data to build the model, but for now, we’ll stick with 2015 full season to train the model. As it turns out, the Statcast parameter that correlates best with ISO is the average exit velocity for line drives and fly balls (LDFBEV). This makes sense, right? It also makes sense that we can exclude ground ball exit velocity in an ISO predictor. Launch angle seems to have some relationship with ISO, but it’s relatively weak.

So, we’ll hang our predictive hats on LDFBEV and see what else can help. After constructing various models, we can pretty quickly see that Pull%, Center%, and Oppo% don’t add much additional explained variance between model and data, nor do Soft%, Med%, and Hard%. This isn’t surprising, since we already have an objective hard contact measure. Ultimately, the one traditional batted ball statistic that helps is GB%. In fact, in the final regression, adding GB% nets us about 18% more explained variance between model and data. This also makes sense. It’s pretty hard to hit a ground ball double or triple, and really hard to hit a home run.

So we’re down to two predictors, GB% and LDFBEV. If we ran a regression with only these two predictors, we would undersell the players who hit the ball really hard. To solve this, we’ll simply include another term in the regression, simply the square of the exit velocity. Throw in a constant term, and we’re ready to run the regression using all 2015 qualified hitters (141 of them). Here’s what comes out:

xISO Model Regression

First things first, we see an R-squared value of 0.75. This is pretty decent; it means our really simple model explains 75% of the variance of of the ISO data. The regression coefficients are as follows.

xISO = -0.358973*(GB) – 0.108255*(EV) + .00066305*(EV)^2 + 4.66285

With this equation, one can look up the relevant data on FanGraphs and Baseball Savant, and calculate the current xISO for any given player. We’ll get to that, but first, I think it’s important to check whether the new xISO model can do a better job predicting future performance than a player’s current ISO. One could also check how quickly xISO stabilizes, compared to ISO, but I won’t attempt that here. What I will do is produce the necessary splits for GB%, LDFBEV, and ISO from FanGraphs and Baseball Savant, calculate 2015 first half xISO for all qualified, and compare to second half ISO. Unfortunately, the number of qualifying players common to the first and second half in 2015 was only 109, but this is what we have:

First Half Second Half

It’s hard to see from the plot, but the R-squared values tell the story: first half xISO does a better job than actual first half ISO at predicting second half ISO. Interestingly, it seems that several players significantly increased second half ISO compared to first half xISO or ISO, and relatively fewer saw a large decrease. I don’t know why this is, but perhaps it is related to the phenomenon detailed by Rob Arthur and Ben Lindbergh on the sudden power spike in 2015.

Having roughly demonstrated the predictive power of our new xISO, let’s show its utility by looking at a few interesting 2016 performers, as of May 22nd:

Trevor Story: ISO = .327,  xISO = .272

Domingo Santana: ISO = .142,  xISO = .238

Troy Tulowitzki: ISO = .190,  xISO = .182

Chris Carter: ISO = .349,  xISO = .355

Christian Yelich: ISO = .205,  xISO = .201

One of the first half’s great surprises, Trevor Story has a slightly inflated ISO, but he does hit the ball pretty hard, and does not hit many ground balls. While he probably won’t sustain an ISO north of .300, he’s a good bet to beat his Steamer ROS projected ISO of .191. Santana and Yelich are two guys who hit the ball hard, but are are held back by their ground ball tendencies. Chris Carter currently leads the pack in LDFBEV, and is a deserved second in ISO. Troy Tulowitzki fans: sorry, but it appears his days of .250 ISOs are a thing of the past.

So that’s it! We’ve got a cool new tool to use. Perhaps not surprisingly, I’ll be mostly using it for fantasy. Dedicated FanGraphs readers will also note that Andrew Perpetua has been doing work with Statcast data on “these electronic pages” recently as well. His use of launch angles introduces more sophistication into the models, but also more complication. My intent here is to present something which can be evaluated by anyone with a few clicks and a calculator. Please reach out with any qualms, criticisms, or suggestions for improvement!


Hot Starts and Cool Finishes

When a Major League hitter gets off to a particularly good start it’s tempting to think he’s figured something out and has reached a new level of offensive performance. We want to believe. We had heard all of the “best shape of his life” stories in the spring or how a hitter is committed to using the whole field this year or how he may be working on his plate discipline. If it’s not a new level of performance we can believe in, perhaps this hitter is destined for a career year. We have hope that the good times will continue.

On the flip side, when a hitter gets off to a terrible start we worry that he’ll never figure it out. If he’s older, we may think age has finally caught up to him and this is the beginning of the end. Perhaps he can no longer hit the good fastball. Or he has to cheat to hit the fastball, so he’s susceptible to an offspeed pitch. If he’s a young player, we worry that the league has adjusted to him and he needs to adjust back. We’re pessimistic and wonder if he’ll ever come around.

The reality in most cases is that a particular player is just off to a hot or cold start and will revert back to the player he was expected to be. It’s usually best to trust the projections. FanGraphs has projections from Steamer and ZiPS that are updated on a daily basis based on new information. During the 2015 season, I used the Steamer projections to find out what we can learn about a hitter getting off to a particularly hot or cold start.

Let’s use Bryce Harper as an example. Before the 2015 season began, Harper was projected by Steamer to hit .279/.361/.487, for an OPS of .848. Through one-fourth of the season (I used May 25th, roughly the one-quarter point), Harper was hitting out of his mind: .333/.471/.727/1.198 OPS (in 191 plate appearances). The updated Steamer projection called for Harper to hit .283/.378/.515 (.893 OPS). Harper’s projected *OPS increased by .045 based on an incredible 191 plate appearances.

*I intended to use wOBA for this exercise, but I didn’t save all of the necessary stats to calculate wOBA for each time period I used last season, so OPS it is.

So what did Harper do from that point forward? He was even better than his updated projection. He hit .329/.455/.617 (1.073 OPS) after May 25th. Bryce Harper absolutely torched his updated projection. In his case, it all came together and he appears to have reached a new level of performance (he was projected for a .974 OPS heading into this season, an increase of .126 points of OPS from last season’s pre-season projection).

Of course, what is true for Bryce Harper is not necessarily true for other humans. Joc Pederson came into the 2015 season as a highly-regarded young prospect and got off to a very good start. Unlike Harper, Joc Pederson did not continue to rake. Whatever the opposite of rake is, that’s what Joc Pederson did. In fact, Pederson’s impressive first 179 plate appearances (he was hitting .250/.388/.556, with a .944 OPS through May 25th) increased his Steamer projection from a .702 OPS in the pre-season to a projected .729 OPS for the rest of the season. He actually had a .685 OPS after May 25th (hitting .193/.327/.357). In the case of Joc Pederson, you would have been better off looking at his pre-season projection than his rest-of season projection despite the additional very good early-season plate appearances.

Bryce Harper and Joc Pederson are just two of many MLB hitters. I wondered if there were any trends we could learn from this exercise, so I accumulated the necessary data during the 2015 season. I started with hitter projections from Steamer during the pre-season, then saved actual hitter statistics through May 25th, which was roughly the one-quarter point of the season for MLB teams. At the same time, I also saved the Steamer rest-of-season projections for May 26th and beyond. These projections would be compared to the actual rest-of-season statistics for each player from May 26th on.

I knew sample size would be an issue. This is just one season, after all. Also, I wanted a player to have a good number of plate appearances in the first one-fourth of the season for the Steamer projections to incorporate into the new projection. I also wanted a good number of plate appearances after the one-fourth point. I decided to use 100 plate appearances through May 25th and 100 plate appearances after May 25th as my admittedly arbitrary cutoff points in determining the sample of hitters. This left 238 hitters.

I divided these 238 hitters into three groups based on how well they hit through May 25th. There were 79 hitters who got off to very good starts, meaning their OPS through May 25th was at least .066 higher than their pre-season Steamer projection. These guys are the “Hot Starters.” The middle group of hitters consisted of 80 hitters who had an OPS through May 25th that was between -.047 and +.065 of their pre-season projection. These guys are the “Predictables.” The final group of 79 hitters had an OPS through May 25th that was -.048 or worse than their pre-season projection. These are the “Cold Starters.”

The chart below shows the pre-season OPS projection from Steamer, along with each group’s actual OPS through May 25th, and the difference between the two.

One thing to note is that all 238 players in this sample combined were projected for a .736 OPS, but had a .748 OPS through May 25th. For reference, all hitters in MLB had a .700 OPS in 2014 and .721 OPS in 2015, so the level of offense increased in baseball from 2014 to 2015 (and these hitters were selected based on playing time so are likely to be better hitters than the league as a whole). It appears that Steamer projected hitters for a lower level of offense than what actually occurred.

The Hot Starters group was very hot, with a combined OPS that was +.137 better than their pre-season projection. This group included the aforementioned Bryce Harper, along with other hot starters from last year such as Nelson Cruz, Stephen Vogt, Adrian Gonzalez, and Brandon Crawford.

As a group, the Predictables came in close to where they were projected, with a group OPS of .736 versus a predicted OPS of .730. Players who were almost spot on with their pre-season projection included Jean Segura, Kevin Kiermaier, Will Middlebrooks, and Steven Souza, Jr.

The Cold Starters group combined for an OPS that was nearly .113 worse than projected. Guys like Victor Martinez, Jayson Werth, Carlos Gonzalez, and Christian Yelich were among the biggest offenders in this group.

So how much did the rest-of-season projections change for each group? The chart below shows the same information as above in the first two columns, then adds the updated projection for each group, along with the difference between the pre-season projection and updated projection.

Notice that the Hot Starters were initially projected for the lowest OPS of the three groups and the Cold Starters were projected for the highest. After one-fourth of the season had been played, the Hot Starters group saw their projected OPS increase by .014, while the Cold Starters saw their projected OPS decrease by .011. Even after this update, the Cold Starters (with a combined .638 OPS at this point) were still projected to be nearly as good as the Hot Starters (with a combined .864 OPS through May 25th). The Cold Starters had started with a higher projection. Their lack of production through one-fourth of the season brought them down a notch, but the difference in rest-of-season projections for the hottest and coldest hitters was negligible.

As it turned out, the entire group of hitters in this sample outperformed their updated projections by .020 from May 25th on. This is not surprising when we realize that in 2015 MLB hitters did improve as the season went on, so it makes sense that the entire group of hitters would do better than Steamer projected because Steamer was likely projecting based on a lower offensive environment. MLB hitters hit even better in the second half than the first half of 2015. Here are the monthly OPS totals for MLB hitters in 2015:


April: .705 OPS

May: .712 OPS

June: .713 OPS

July: .719 OPS

August: .736 OPS

September: .737 OPS


As for the three groups of hitters in this study, the Hot Starters averaged an OPS of .767 as a group after May 25th, compared to their .741 rest-of-season projected OPS, an increase of .026, which was the largest increase of the three groups. The Predictables outperformed expectations by .017, and the Cold Starters were better by the least amount, at .014.

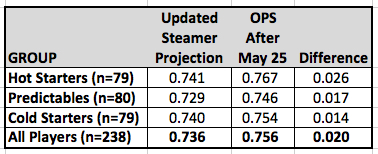
At this point, it looks like early-season hot hitters are more likely to beat their updated rest-of-season projection going forward. In this case, the Hot Starters and Cold Starters were given rest-of-season projections that were very similar (.741 and .740), but the Hot Starters out-produced the Cold Starters by .012 points of OPS. We might be on to something here. Before we dive further into this, let’s check up on our old friend “regression to the mean.”

The following table shows what percentage of players from each group improved after May 25th and what percentage performed worse after May 25th.

As you would expect, the majority of the Hot Starters (82%) couldn’t keep up their hot hitting. Notable exceptions included Joe Panik, A.J. Pollock, and Lorenzo Cain. Panik was projected to have a .641 OPS in the pre-season. Through May 25th, his OPS was .773, which made his updated projection .657. Instead of coming back down to earth, Panik took his offense to another level, producing an OPS of .875 after May 25th. A.J. Pollock was similar, but at an even higher level of production.

While the majority of Hot Starters couldn’t keep up their torrid pace, most of the Cold Starters (78%) turned things around after May 25th. Three who did not improve were some of the biggest hitting disappointments in 2015—Mike Zunino, Pablo Sandoval, and Wilson Ramos. All three started poorly and didn’t get any better over the last three-fourths of the season.

In the Predictables group, the king of consistency was Buster Posey. Posey was projected for an OPS of .840. Through May 25th, his OPS was .850. This increased his rest-of-season projection to .845. He produced an OPS of .849 after May 25th. Buster Posey was a human metronome in 2015.

Okay, let’s go back. I had arbitrarily divided these hitters into three groups and came up with these initial results that appear to show that hot hitters stay hotter than their updated projection would expect. What happens if I divide them into four groups?

Oh.

The column on the far right of the top chart is key here. Based on my results when the hitters were divided into three groups, I expected the Scorching hot hitters in this sample to stay hotter than the other three groups, meaning I expected them to outperform their updated rest-of-season projection by the largest amount. They did not. The Hot and Chilly hitters both improved on their updated rest-of-season projections by a greater amount than the Scorching hitters. The Chilly group of hitters were the worst of the four groups through the one-fourth point of the season (a combined .629 OPS), but actually had the highest OPS over the final three-fourths of the season.

On the bright side, the second chart came out as expected. The hitters who started out the year the hottest were the least-likely to improve after the one-quarter mark. The second-hottest hitters were the second-least likely to improve. The pattern follows for the Cool and Chilly hitters.

I did one final check with just two groups—those who had a higher OPS through May 25th than they were projected for in the pre-season and those who had a lower OPS through May 25th than they were projected for in the pre-season. That chart is below:

The Above Projection group started the year with a projected OPS of .731. Through May 25th, these hitters combined for an .823 OPS. Their updated projection was .739. After May 25th, they had a .761 OPS, which was .022 higher than their updated rest-of-season projection. The Below Projection Hitters ended up .015 higher than their updated rest-of-season projection.

This shows a slight trend towards the early season hot hitters outperforming their projection, but the difference is just .007 points of OPS and if Bryce Harper is removed from the Above Projection group, the difference drops to .005. If there is a trend, the difference is small. The important takeaway, as the second chart shows, is to trust that most of those who start out hot will cool down and most of those who start out cold will heat up.


Hardball Retrospective – What Might Have Been – The “Original” 1908 Cardinals

In “Hardball Retrospective: Evaluating Scouting and Development Outcomes for the Modern-Era Franchises”, I placed every ballplayer in the modern era (from 1901-present) on their original team. I calculated revised standings for every season based entirely on the performance of each team’s “original” players. I discuss every team’s “original” players and seasons at length along with organizational performance with respect to the Amateur Draft (or First-Year Player Draft), amateur free agent signings and other methods of player acquisition.  Season standings, WAR and Win Shares totals for the “original” teams are compared against the “actual” team results to assess each franchise’s scouting, development and general management skills.

Expanding on my research for the book, the following series of articles will reveal the teams with the biggest single-season difference in the WAR and Win Shares for the “Original” vs. “Actual” rosters for every Major League organization. “Hardball Retrospective” is available in digital format on Amazon, Barnes and Noble, GooglePlay, iTunes and KoboBooks. The paperback edition is available on Amazon, Barnes and Noble and CreateSpace. Supplemental Statistics, Charts and Graphs along with a discussion forum are offered at TuataraSoftware.com.

Don Daglow (Intellivision World Series Major League Baseball, Earl Weaver Baseball, Tony LaRussa Baseball) contributed the foreword for Hardball Retrospective. The foreword and preview of my book are accessible here.

Terminology

OWAR – Wins Above Replacement for players on “original” teams

OWS – Win Shares for players on “original” teams

OPW% – Pythagorean Won-Loss record for the “original” teams

AWAR – Wins Above Replacement for players on “actual” teams

AWS – Win Shares for players on “actual” teams

APW% – Pythagorean Won-Loss record for the “actual” teams

Assessment

The 1908 St. Louis Cardinals 

OWAR: 29.2     OWS: 247     OPW%: .375     (58-96)

AWAR: 13.5       AWS: 146     APW%: .318   (49-105)

WARdiff: 15.7                        WSdiff: 101  

Despite a dismal effort and last-place finish, the “Original” 1908 Cardinals bested the “Actual” Redbirds by a 9-game margin and a confounding Win Shares differential of 109. “Turkey” Mike Donlin (.334/6/106) tallied 198 base knocks, pilfered 30 bags and recorded a career-high in ribbies. Fellow outfielder Charlie “Eagle Eye” Hemphill swiped 42 bases and batted .297 for the “Original” Cardinals. Red Murray supplied a .282 BA with 48 stolen bases for both the “Original” and “Actual” Redbirds.

Mordecai Brown ranks twentieth among pitchers according to Bill James in “The New Bill James Historical Baseball Abstract.” “Original” Cardinals teammates listed in the “NBJHBA” top 100 rankings include Ed Konetchy (48th-1B) and Mike Donlin (52nd-CF).

  Original 1908 Cardinals                             Actual 1908 Cardinals

LINEUP POS OWAR OWS LINEUP POS AWAR AWS
Charlie Hemphill LF/CF 3.11 25.83 Joe Delahanty LF -0.89 13.78
Red Murray CF 2.92 25.78 Red Murray CF 2.92 25.78
Mike Donlin RF 5.8 31.2 Al Shaw RF/CF -0.3 10.83
Ed Konetchy 1B 1.65 16.9 Ed Konetchy 1B 1.65 16.9
Chappy Charles 2B -2.75 2.31 Billy Gilbert 2B -1.13 3.61
Freddy Parent SS 1.89 11.89 Patsy O’Rourke SS -1.02 0.64
Bobby Byrne 3B -1.61 3.31 Bobby Byrne 3B -1.61 3.31
Art Hoelskoetter C -0.24 2.21 Art Hoelskoetter C -0.24 2.21
BENCH POS OWAR OWS BENCH POS AWAR AWS
Joe Delahanty LF -0.89 13.78 Shad Barry RF -0.53 4.25
Al Shaw CF -0.3 10.83 Chappy Charles 2B -2.75 2.31
Al Burch LF 0.18 10.72 Jack Bliss C 0.12 2.18
Spike Shannon LF -0.85 7.58 Bill Ludwig C -0.02 1.4
Jack Bliss C 0.12 2.18 Wilbur Murdoch LF -0.21 1.3
Bill Ludwig C -0.02 1.4 Champ Osteen SS -0.81 0.41
Wilbur Murdoch LF -0.21 1.3 Charlie Moran C -0.44 0.28
Patsy O’Rourke SS -1.02 0.64 Walter Morris SS -0.65 0.25
Art Weaver C -0.1 0.33 Doc Marshall C -0.07 0.18
Charlie Moran C -0.44 0.28 Tom Reilly SS -0.58 0.13
Walter Morris SS -0.65 0.25 Ralph McLaurin LF -0.14 0.09
Tom Reilly SS -0.58 0.13
Ralph McLaurin LF -0.14 0.09
Simmy Murch 1B -0.06 0.06

Mordecai “Three-Finger” Brown, in the midst of six straight seasons with 20+ victories, furnished a 29-9 record with a 1.47 ERA and a career-best WHIP of 0.842. He completed 27 of 31 starts and saved 5 contests in 13 relief appearances for the “Original” Cardinals. Billy Campbell contributed 12 wins with a 2.60 ERA and a 1.116 WHIP in 221.1 innings. “Actuals” ace Bugs Raymond suffered through a 15-25 campaign despite a 2.03 ERA and 1.021 WHIP. Johnny Lush (11-18, 2.12) endured similar results as the Redbirds rotation was unable to overcome a lackluster offense.

  Original 1908 Cardinals                            Actual 1908 Cardinals

ROTATION POS OWAR OWS ROTATION POS AWAR AWS
Mordecai Brown SP 6.62 31.34 Bugs Raymond SP 1.97 21.04
Billy Campbell SP -0.96 10.38 Johnny Lush SP 0.26 14.3
Art Fromme SP -1.45 3.61 Fred Beebe SP -2.13 5.63
Slim Sallee SP -1.61 3.19 Ed Karger SP -1.87 3.69
BULLPEN POS OWAR OWS BULLPEN POS AWAR AWS
Jake Thielman RP -0.34 3.78 Art Fromme SP -1.45 3.61
Irv Higginbotham SP -0.9 3.1 Slim Sallee SP -1.61 3.19
Charlie Rhodes RP -0.05 1.67 Irv Higginbotham SP -0.9 3.1
Stoney McGlynn SP -1.16 1.23 Charlie Rhodes SP 0 1.4
O.F. Baldwin SP -0.46 0 Stoney McGlynn SP -1.16 1.23
Buster Brown RP -0.39 0 O.F. Baldwin SP -0.46 0
Fred Gaiser RP -0.13 0 Fred Gaiser RP -0.13 0

Notable Transactions

Mordecai Brown

December 12, 1903: Traded by the St. Louis Cardinals with Jack O’Neill to the Chicago Cubs for Larry McLean and Jack Taylor.

Mike Donlin

Before 1901 Season: Jumped from the St. Louis Cardinals to the Baltimore Orioles.

Before 1902 Season: Released by the Baltimore Orioles.

August, 1902: Signed as a Free Agent with the Cincinnati Reds.

August 7, 1904: Traded as part of a 3-team trade by the Cincinnati Reds to the New York Giants. The New York Giants sent Moose McCormick to the Pittsburgh Pirates. The Pittsburgh Pirates sent Jimmy Sebring to the Cincinnati Reds.

Charlie Hemphill

March 2, 1901: Jumped from the St. Louis Cardinals to the Boston Americans.

Before 1902 Season: Signed as a Free Agent with the Cleveland Bronchos.

June, 1902: Released by the Cleveland Bronchos. (Date given is approximate. Exact date is uncertain.)

June 4, 1902: Signed as a Free Agent with the St. Louis Browns.

August 23, 1905: Purchased by the St. Louis Browns from St Paul (American Association). (Date given is approximate. Exact date is uncertain.)

November 5, 1907: Traded by the St. Louis Browns with Fred Glade and Harry Niles to the New York Highlanders for Hobe Ferris, Danny Hoffman and Jimmy Williams.

Honorable Mention

The 1983 St. Louis Cardinals 

OWAR: 54.8     OWS: 310     OPW%: .517     (84-78)

AWAR: 36.1     AWS: 237     APW%: .488   (79-83)

WARdiff: 18.7                        WSdiff: 73 

The “Original” 1983 Cardinals seized the National League Eastern Division flag by a single game over the Expos. The flock featured left fielder Jose Cruz (.318/14/92), the NL leader with 189 base hits. “Cheo” reached the 30-steal mark for the fifth time in his career. Terry Kennedy (.284/17/98) registered a personal-best in RBI. Keith Hernandez earned the sixth of eleven consecutive Gold Glove Awards. John Denny (19-6, 2.37) merited the NL Cy Young Award. Larry Herndon notched personal-highs in batting average (.302), hits (182), doubles (28) and RBI (92). Ted “Simba” Simmons delivered a .308 BA with 39 two-baggers and 108 ribbies. Steve “Lefty” Carlton whiffed 275 batsmen and fashioned a 3.11 ERA. George Hendrick (.318/18/97) received his fourth All-Star invitation and posted a career-high in batting average for the “Actual” Redbirds.

On Deck

What Might Have Been – The “Original” 1975 Astros

References and Resources

Baseball America – Executive Database

Baseball-Reference

James, Bill. The New Bill James Historical Baseball Abstract. New York, NY.: The Free Press, 2001. Print.

James, Bill, with Jim Henzler. Win Shares. Morton Grove, Ill.: STATS, 2002. Print.

Retrosheet – Transactions Database

The information used here was obtained free of charge from and is copyrighted by Retrosheet. Interested parties may contact Retrosheet at “www.retrosheet.org”.

Seamheads – Baseball Gauge

Sean Lahman Baseball Archive


Where Art Thou, Yan?

It seems that more and more often, we as baseball fans are constantly trying to “diagnose” the cause of a specific player’s struggles, and give our two cents on if everyone should — in the words of Aaron Rodgers — relax, or be concerned about the player’s deficiencies. I am not sure what it is; maybe it’s because talking about other people’s problems makes us forget about our own. Maybe it’s because we as humans simply like to tell other people how to do their jobs, because it makes us feel important. No one will truly ever know the exact answer to that question. With that being said, however, I am going to do exactly what I just talked about the previous four sentences; I am going to try to explain what is going on with Yan Gomes. In his first two seasons with the Tribe (223 games total), he accumulated 7.8 WAR, won a Silver Slugger award in 2014, and drew positive reviews for his framing abilities according to Baseball Prospectus (ranked 17th out of 417 catchers in 2013 and 32nd out of 382 in 2014 in the Framing Runs statistic). Framing runs essentially shows how many runs a catcher saves throughout a given season based on how many extra strikes they are able to get their pitchers from their framing abilities. The Indians, seeing a young and talented player still required to go through the arbitration process for several more years, locked Gomes up to a six-year, 23-million-dollar contract before the 2014 season. Taking a look at this chart, the Indians’ felt they were in for a huge bargain.

Year Age Salary (in millions) WAR est. $/WAR Value (in millions)
2014 27 0.6 3.5 7.6 26.6
2015 28 1 3.15 8.2 25.8
2016 29 2.5 2.84 8.8 24.9
2017 30 4.5 2.55 9.4 24.0
2018 31 6 2.17 10.0 21.7
2019 32 7 1.84 10.6 19.5
Total 23 (includes 0.5 million signing bonus) 142.6
Surplus Value 119.6 M


To briefly explain my methodology, I used the estimates for dollars per WAR (which adjusts for inflation) from an article by Matt Swartz from Hardball Times, and adjusted Gomes’ overall WAR per year by the generally accepted decline rates laid out by Dave Cameron of FanGraphs a few years back. Players on average perform at 90% of their previous year’s WAR output through age 30, 85% from 31-35, and 80% from 36 and up. When the Indians signed Gomes, he was coming off a 3.3 WAR season. Considering he was going into his age-27 season, he was probably nearing his peak year in terms of WAR. Therefore, right or wrong, I believe his true-talent level (and what the Tribe were expecting from him) in 2014 was right around 3.5 WAR. I adjusted his yearly totals accordingly until his contract expired — I did not incorporate team options for 2020 and 2021 into this. The Indians receive roughly 120 million dollars in surplus value for the length of Gomes contract, which would be an incredible deal for a small-market team.

Obviously, Gomes went out in 2014 and produced a 4.5 WAR season, even further increasing the bargain for the Tribe in the early goings of the deal. Since 2014, however, Gomes hasn’t been the same player at the dish. His defense still grades out favorably according to many defensive metrics, but his bat appears to have taken a big step back. It isn’t fair to judge him on 2015, considering he was injured early on in the season and never fully recovered. This year, there isn’t an injury excuse — that we know of anyways. Gomes is slashing a dismal .167/.204/.353 at the plate, and has been worth just 46 wRC+, meaning his hitting has been 54% worse than league average. Few things of merit before jumping into a more detailed analysis: he is running a .174 BABIP, which is tremendously lower than his career average of .302 and upon regression will raise his average. His walk rate is about the same, and he is only striking out 3% more than his “peak” season of 2014. While a 3% rise in strikeout percentage isn’t minuscule, Gomes has always been known as a free swinger (over the last four years, he is in the 75th percentile in swinging strikes and 83rd percentile in swing percentage).

So, the big question here is, what specifically is causing Gomes’ struggles? I am going to try to be as systematic as possible here, so that everything kind of builds upon itself. To quickly summarize his plate discipline statistics — because I don’t think there are really any surprises here — his out of zone, zone, and overall swing percentages in comparison to his career have increased, and his out of zone and overall contact percentages have decreased. I am not sure why his Z-Contact% has increased, but I don’t think that is of much consequence. It is clear that Gomes is swinging more, and making contact less.

Turning to his batted-ball statistics, there are several important changes that start to paint a better picture of why Gomes is struggling. For ease of communication, I have split the information into two tables below.

Season Team GB/FB LD% GB% FB% IFFB%
2012 Blue Jays 1.28 14.9% 47.8% 37.3% 8.0%
2013 Indians 1.12 17.8% 43.5% 38.7% 11.2%
2014 Indians 0.93 24.0% 36.7% 39.4% 9.6%
2015 Indians 0.84 26.4% 33.6% 40.0% 11.3%
2016 Indians 0.76 18.9% 35.1% 45.9% 14.7%

Notice how in all of Gomes’ professional seasons, his groundball-to-fly-ball ratio has gone down. This could be considered a good thing, since he does possess a ton of raw power, and everyone knows you can’t hit home runs on the ground — okay, technically you can, but Gomes doesn’t have Dee Gordon speed. The next thing that jumps out is his 14.7% pop-up rate, which is good for 25th highest out of 192 qualified hitters. His increased fly-ball rate, coupled with his bloated IFFB%, could explain why his BABIP is so low — balls in the air are caught more often than balls on the ground. More importantly, though, it seems that there could be a pitch-recognition problem, considering his isn’t quite squaring up balls as consistently as he has in the past. To go into this concept further, let’s take a look at the next chart.

Season Team Pull% Cent% Oppo% Soft% Med% Hard%
2012 Blue Jays 52.9% 31.4% 15.7% 7.1% 62.9% 30.0%
2013 Indians 42.2% 31.7% 26.1% 14.3% 53.5% 32.2%
2014 Indians 42.6% 30.2% 27.2% 16.4% 52.6% 31.0%
2015 Indians 37.4% 37.0% 25.7% 16.6% 55.5% 27.9%
2016 Indians 44.6% 40.5% 14.9% 20.3% 54.1% 25.7%

Gomes is pulling the ball more than he ever has in his entire career — excluding the cup of tea he had in the bigs in 2012. Not to mention, he has basically abandoned taking the ball the other way. Looking at his quality of contact stats, he is hitting the ball “hard” less often than he typically has throughout his career, too.

Sure enough, Gomes has been below the league average in exit velocity for the majority of the season. So, to recap what I have already found, Gomes is hitting a ton of fly balls and pop-ups, is pulling the ball more and taking it the other way less, and is hitting the ball softer than usual. What does this all mean? I think it illustrates that Gomes is struggling with breaking balls.

Looking at Gomes’ spray angles against hard, breaking, and offspeed pitches, it appears that he is not recognizing breaking balls well this season.

For those that aren’t familiar with Brooks Baseball’s spray angle data, it essentially shows the average direction which balls are hit on the field. So, a positive spray angle (as depicted on the graph) means that the hitter tends to pull that pitch, and a negative spray angle means they tend to take it the other way. A recent FanGraphs Community Blog post by an author named Brad McKay explained the significance of spray angle well, in my opinion. He surmised that similar spray angles for different pitch types suggests that a player “was able to recognize and wait back equally well for both pitch types,” something that I happen to agree with. Looking at Gomes’ Silver Slugger Award winning year, it appears that Gomes tracked and hit fastballs and breaking balls at a similar spray angle, while also hitting offspeed pitches almost identical as well. This shows that Gomes was picking up the ball well in 2014. Fast-forward to 2016, and you can see that those angles have changed, and Gomes is now pulling breaking balls more than he does against fastballs. This suggests that something isn’t right with Gomes’ pitch recognition. He has almost reverted back to more of what he was in 2013. Interestingly enough, Gomes hit really well that season in 88 games played. The difference from then to now, however, is the pitch sequencing.

The approach against him has done a complete 180. The lefties — who used to pound him with fastballs when ahead in the count — now go to their breaking balls, while the righties — who used to pound him with breaking balls when ahead in the count — now attack him with fastballs. Essentially, the way pitchers (both lefties and righties) attacked Gomes in 2013 is consistent with how one would traditionally pitch to an aggressive, right-handed power bat. Here’s what I think has happened now. Pitcher’s have realized that Gomes is not picking up breaking balls the way he was in the past, causing him to have to sit breaking ball on the majority of pitches. He does this with the hopes of picking up the breaking ball early enough to decide whether to swing or not swing. With this in mind, right-handed pitchers know that because Gomes is sitting breaking ball, he will have a harder time catching up to the fastball many times. Simultaneously, left-handers know that they can attack him earlier with their fastballs (which are generally a pitch righties see well from lefties) to get ahead in the count, and then try to put him away with the breaking ball. In a sense, Gomes is completely and utterly discombobulated at the plate. Here are his heat maps vs. righties, broken down into “hard stuff” and “breaking balls.”As expected, the “hard stuff” is up, while the breaking balls are started over the middle of the plate and break down and away. Next, the lefties.

Lefties have attacked him with fastballs low, and inside, and use this to set up the breaking ball on Gomes’ back foot, which is incredibly difficult to hit (especially for someone not picking up those types of pitches well). Gomes is hitting .177 against the 55 sliders he’s seen this year, and is hitting .000 against the 35 curveballs he’s seen. His averages against harder pitchers are not much better.

Now that we have identified the problem, is there a way to fix it? I don’t know what Gomes is doing behind the scenes, but in my opinion there are three different ways to go about this. For one, I think Gomes should study the way pitchers are attacking him (which I would assume he is already doing). Using this knowledge, I think Gomes could benefit from being a little more patient at the plate. Instead of swinging out of his shoes all the time, he might be better suited remembering how pitchers are attacking him, and waiting on a pitch he not only can drive, but knows is most likely coming (helping to eliminate the guessing game he is playing right now). Lastly, I think he could simply practice recognizing pitches on the pitching machines teams have in the clubhouse. Gomes could spend time every day tracking a set amount of pitches, working to improve his ability to discern spin on the baseball upon its release. Then, he could put that pitch recognition to the test by actually attempting to hit the pitches when they are thrown. These are pretty simplistic solutions, and I am sure Gomes is working tirelessly trying to break out of his slump already. These are just my best guesses on how to improve this deficiency in Gomes’ game going forward in 2016.

I still believe in Yan Gomes, and so should you. He has proven he can be a successful big-leaguer, and one of the top catchers in the league. Catchers are judged more on their defense than on their bat, and catchers who can do both are considered a premium. In other words, Gomes could still be considered a solid MLB catcher, even if he doesn’t ever regain his old form at the plate. It is my opinion, however, that we should not sell him short at the plate. The ability is there, it just needs a little refining right now. For the sake of Indians’ fans everywhere, let’s hope Gomes can unleash his inner “Yanimal” sooner rather than later; the fate of the Indians season depends on it.


References

http://www.fangraphs.com/statss.aspx?playerid=9627&position=C

http://www.brooksbaseball.net/h_landing.php?player=543228&time=year&startDate=01/01/2016&endDate=01/01/2017&s_type=13

http://www.brooksbaseball.net/h_landing.php?player=543228&time=year&startDate=01/01/2016&endDate=01/01/2017&s_type=13

http://www.fangraphs.com/blogs/the-cost-of-a-win-in-the-2014-off-season/

https://baseballsavant.mlb.com/player?player_id=543228&pos=2&player_type=batter

http://www.fangraphs.com/community/the-tulowitzki-hypothesis/