A New Hitter xISO, Now with Exit Velocity
Over the last few years, Alex Chamberlain has published a series of posts exploring the concept of xISO. Like the most commonly known xFIP, this metric is supposed to be an “expected” ISO, based on batted ball metrics. Nobly, Alex kept his model quite simple, using only statistics available on the FanGraphs player pages: Hard%, FB%, and Pull%.
I have very little formal training in statistics, most of it is self-taught to help me in my day job, so I’m also going to keep things simple. Inspired by Alex’s work, I began to experiment with improving the xISO model. I started building linear models including more predictors, and even introduced higher order and interaction terms. While these all improved the model slightly, I didn’t feel that the added complexity was worth the slight improvement. Along the way, I noticed that, although Chamberlain makes mention of the correlation between first half xISO and end of season ISO, if I calculated first half xISO and compared to second half ISO, I would find the initial xISO model to be a worse predictor of second half ISO than the actual first half ISO.
As I was running these calculations, I also became acquainted with the publicly available Statcast data through Daren Willman’s Baseball Savant site. Although the gathering of input data becomes a bit more tedious, surely some combination of exit velocity and launch angle information would improve an xISO model, and perhaps produce something which produces a better correlation between first and second halves. Let us see!
First things first, since Statcast is so new, we only have one full season of data. Ideally, we could use multiple years of data to build the model, but for now, we’ll stick with 2015 full season to train the model. As it turns out, the Statcast parameter that correlates best with ISO is the average exit velocity for line drives and fly balls (LDFBEV). This makes sense, right? It also makes sense that we can exclude ground ball exit velocity in an ISO predictor. Launch angle seems to have some relationship with ISO, but it’s relatively weak.
So, we’ll hang our predictive hats on LDFBEV and see what else can help. After constructing various models, we can pretty quickly see that Pull%, Center%, and Oppo% don’t add much additional explained variance between model and data, nor do Soft%, Med%, and Hard%. This isn’t surprising, since we already have an objective hard contact measure. Ultimately, the one traditional batted ball statistic that helps is GB%. In fact, in the final regression, adding GB% nets us about 18% more explained variance between model and data. This also makes sense. It’s pretty hard to hit a ground ball double or triple, and really hard to hit a home run.
So we’re down to two predictors, GB% and LDFBEV. If we ran a regression with only these two predictors, we would undersell the players who hit the ball really hard. To solve this, we’ll simply include another term in the regression, simply the square of the exit velocity. Throw in a constant term, and we’re ready to run the regression using all 2015 qualified hitters (141 of them). Here’s what comes out:
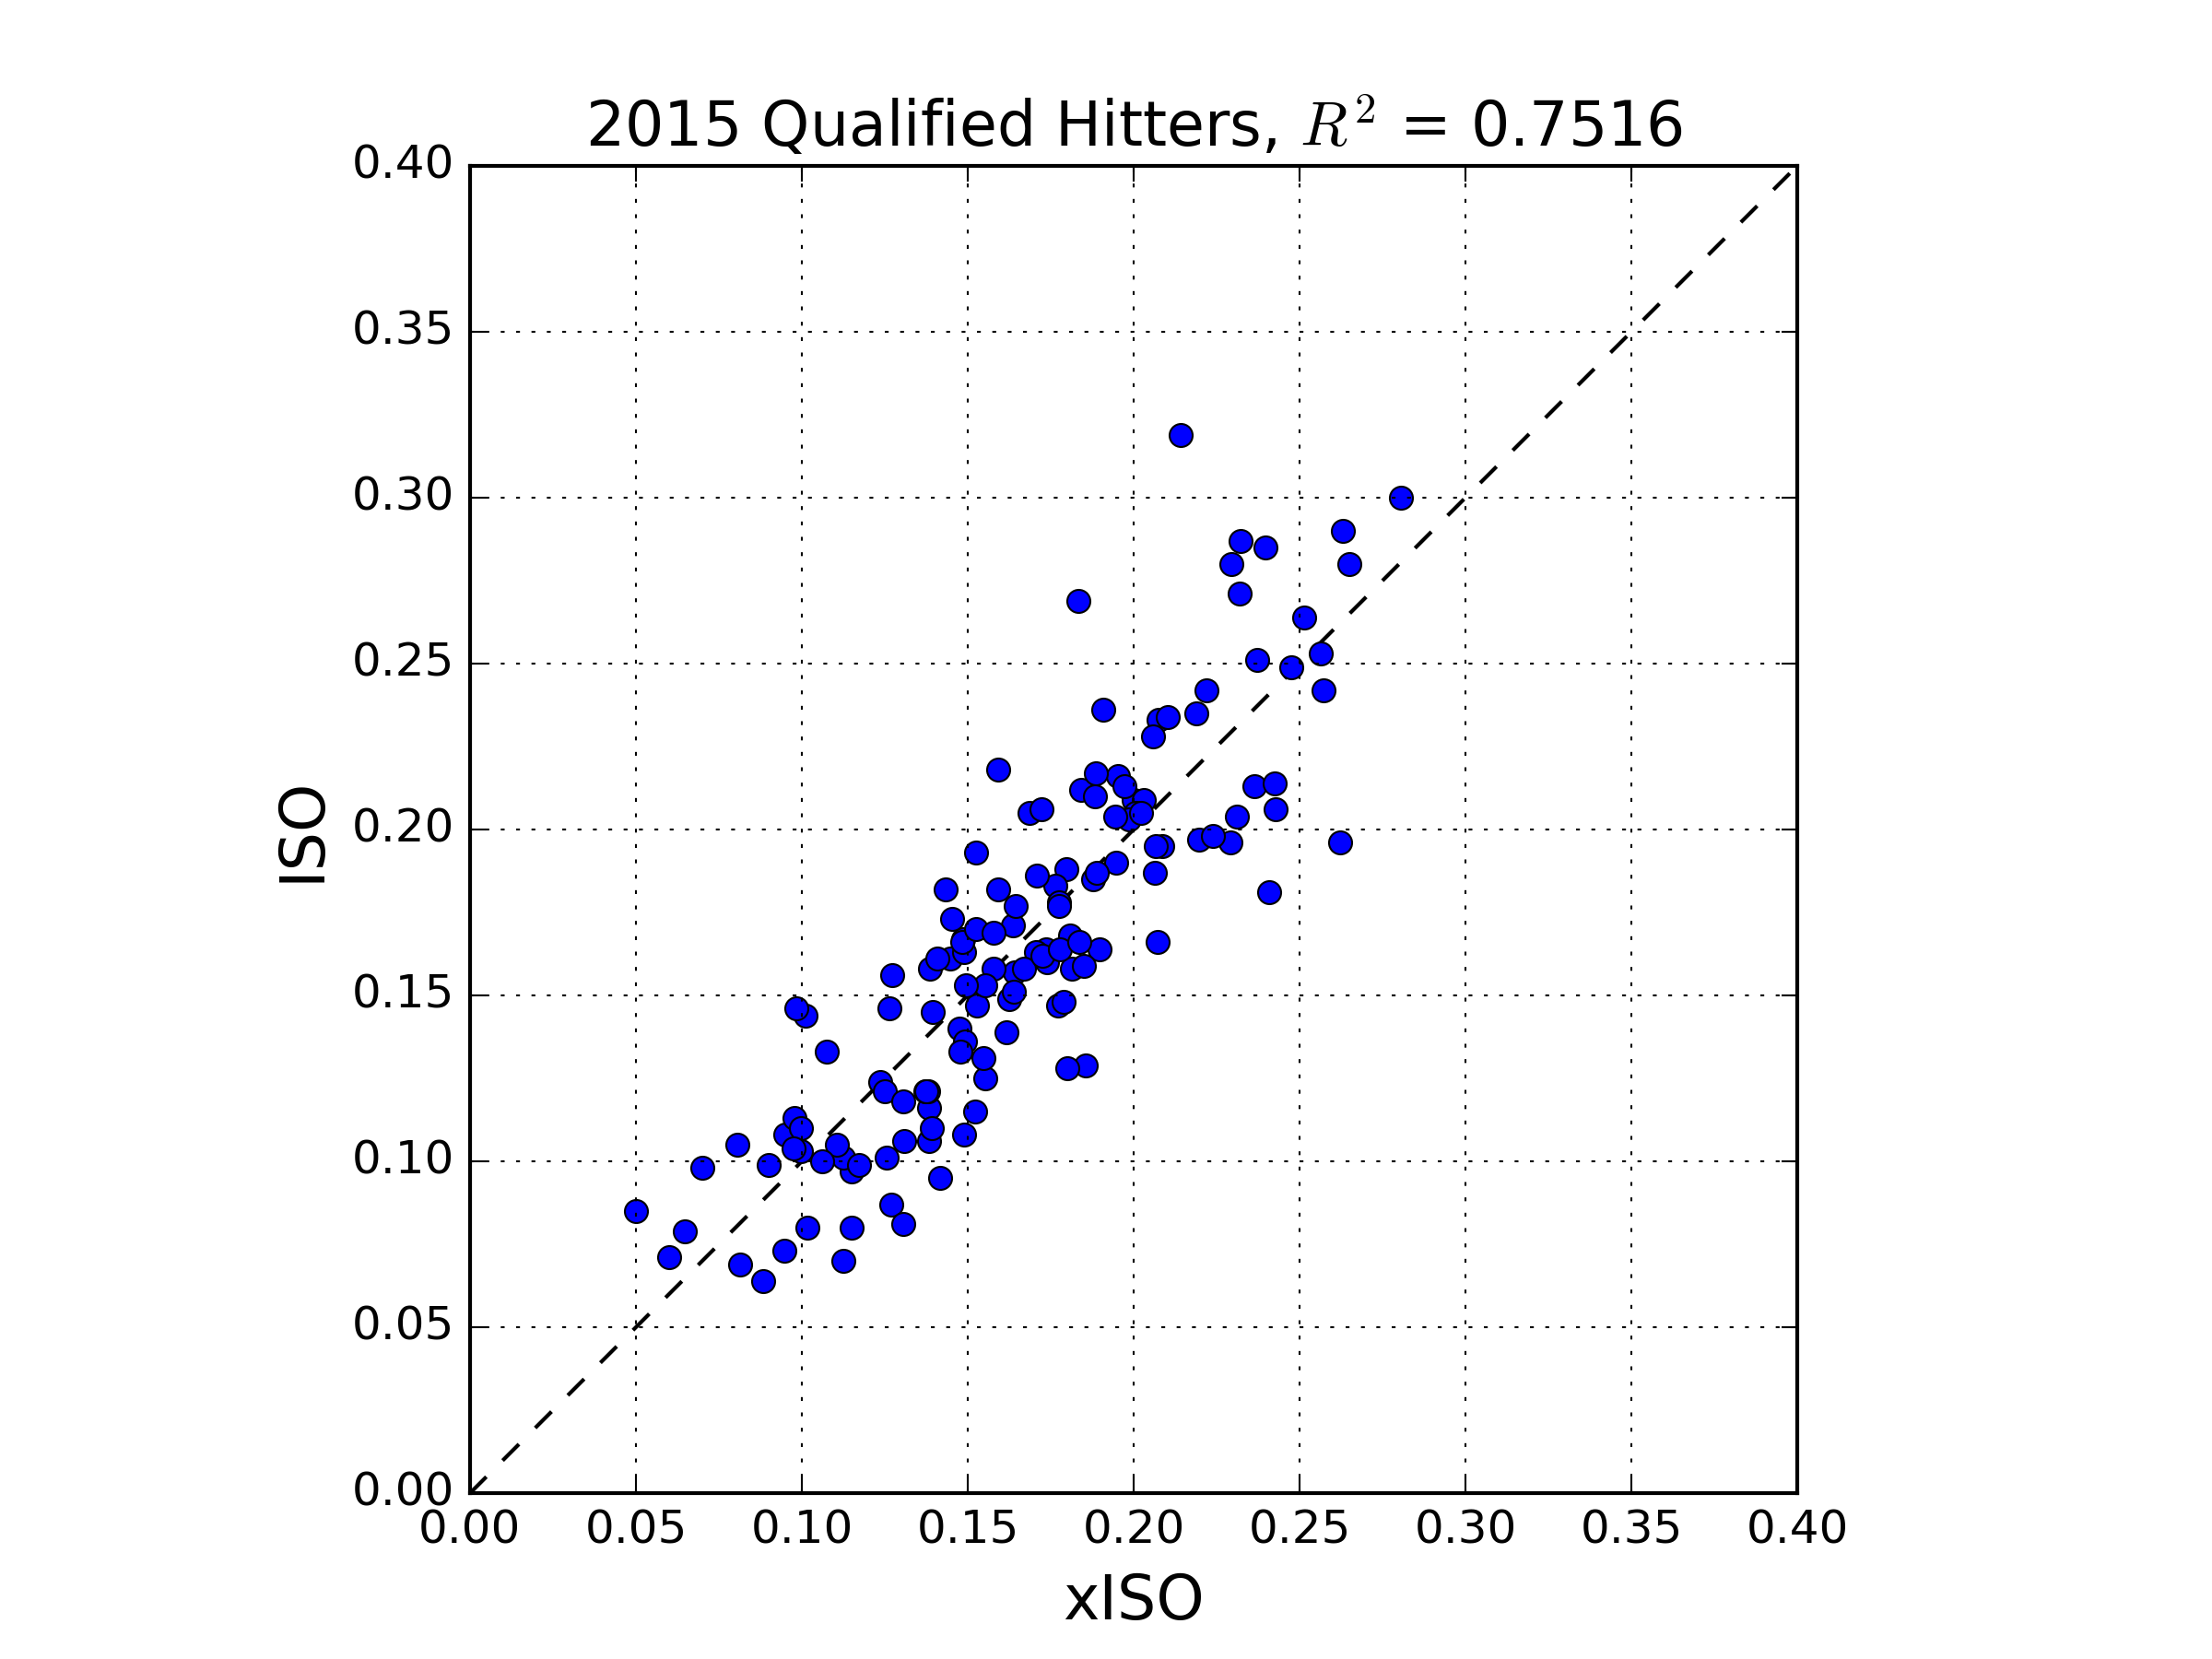
First things first, we see an R-squared value of 0.75. This is pretty decent; it means our really simple model explains 75% of the variance of of the ISO data. The regression coefficients are as follows.
xISO = -0.358973*(GB) – 0.108255*(EV) + .00066305*(EV)^2 + 4.66285
With this equation, one can look up the relevant data on FanGraphs and Baseball Savant, and calculate the current xISO for any given player. We’ll get to that, but first, I think it’s important to check whether the new xISO model can do a better job predicting future performance than a player’s current ISO. One could also check how quickly xISO stabilizes, compared to ISO, but I won’t attempt that here. What I will do is produce the necessary splits for GB%, LDFBEV, and ISO from FanGraphs and Baseball Savant, calculate 2015 first half xISO for all qualified, and compare to second half ISO. Unfortunately, the number of qualifying players common to the first and second half in 2015 was only 109, but this is what we have:
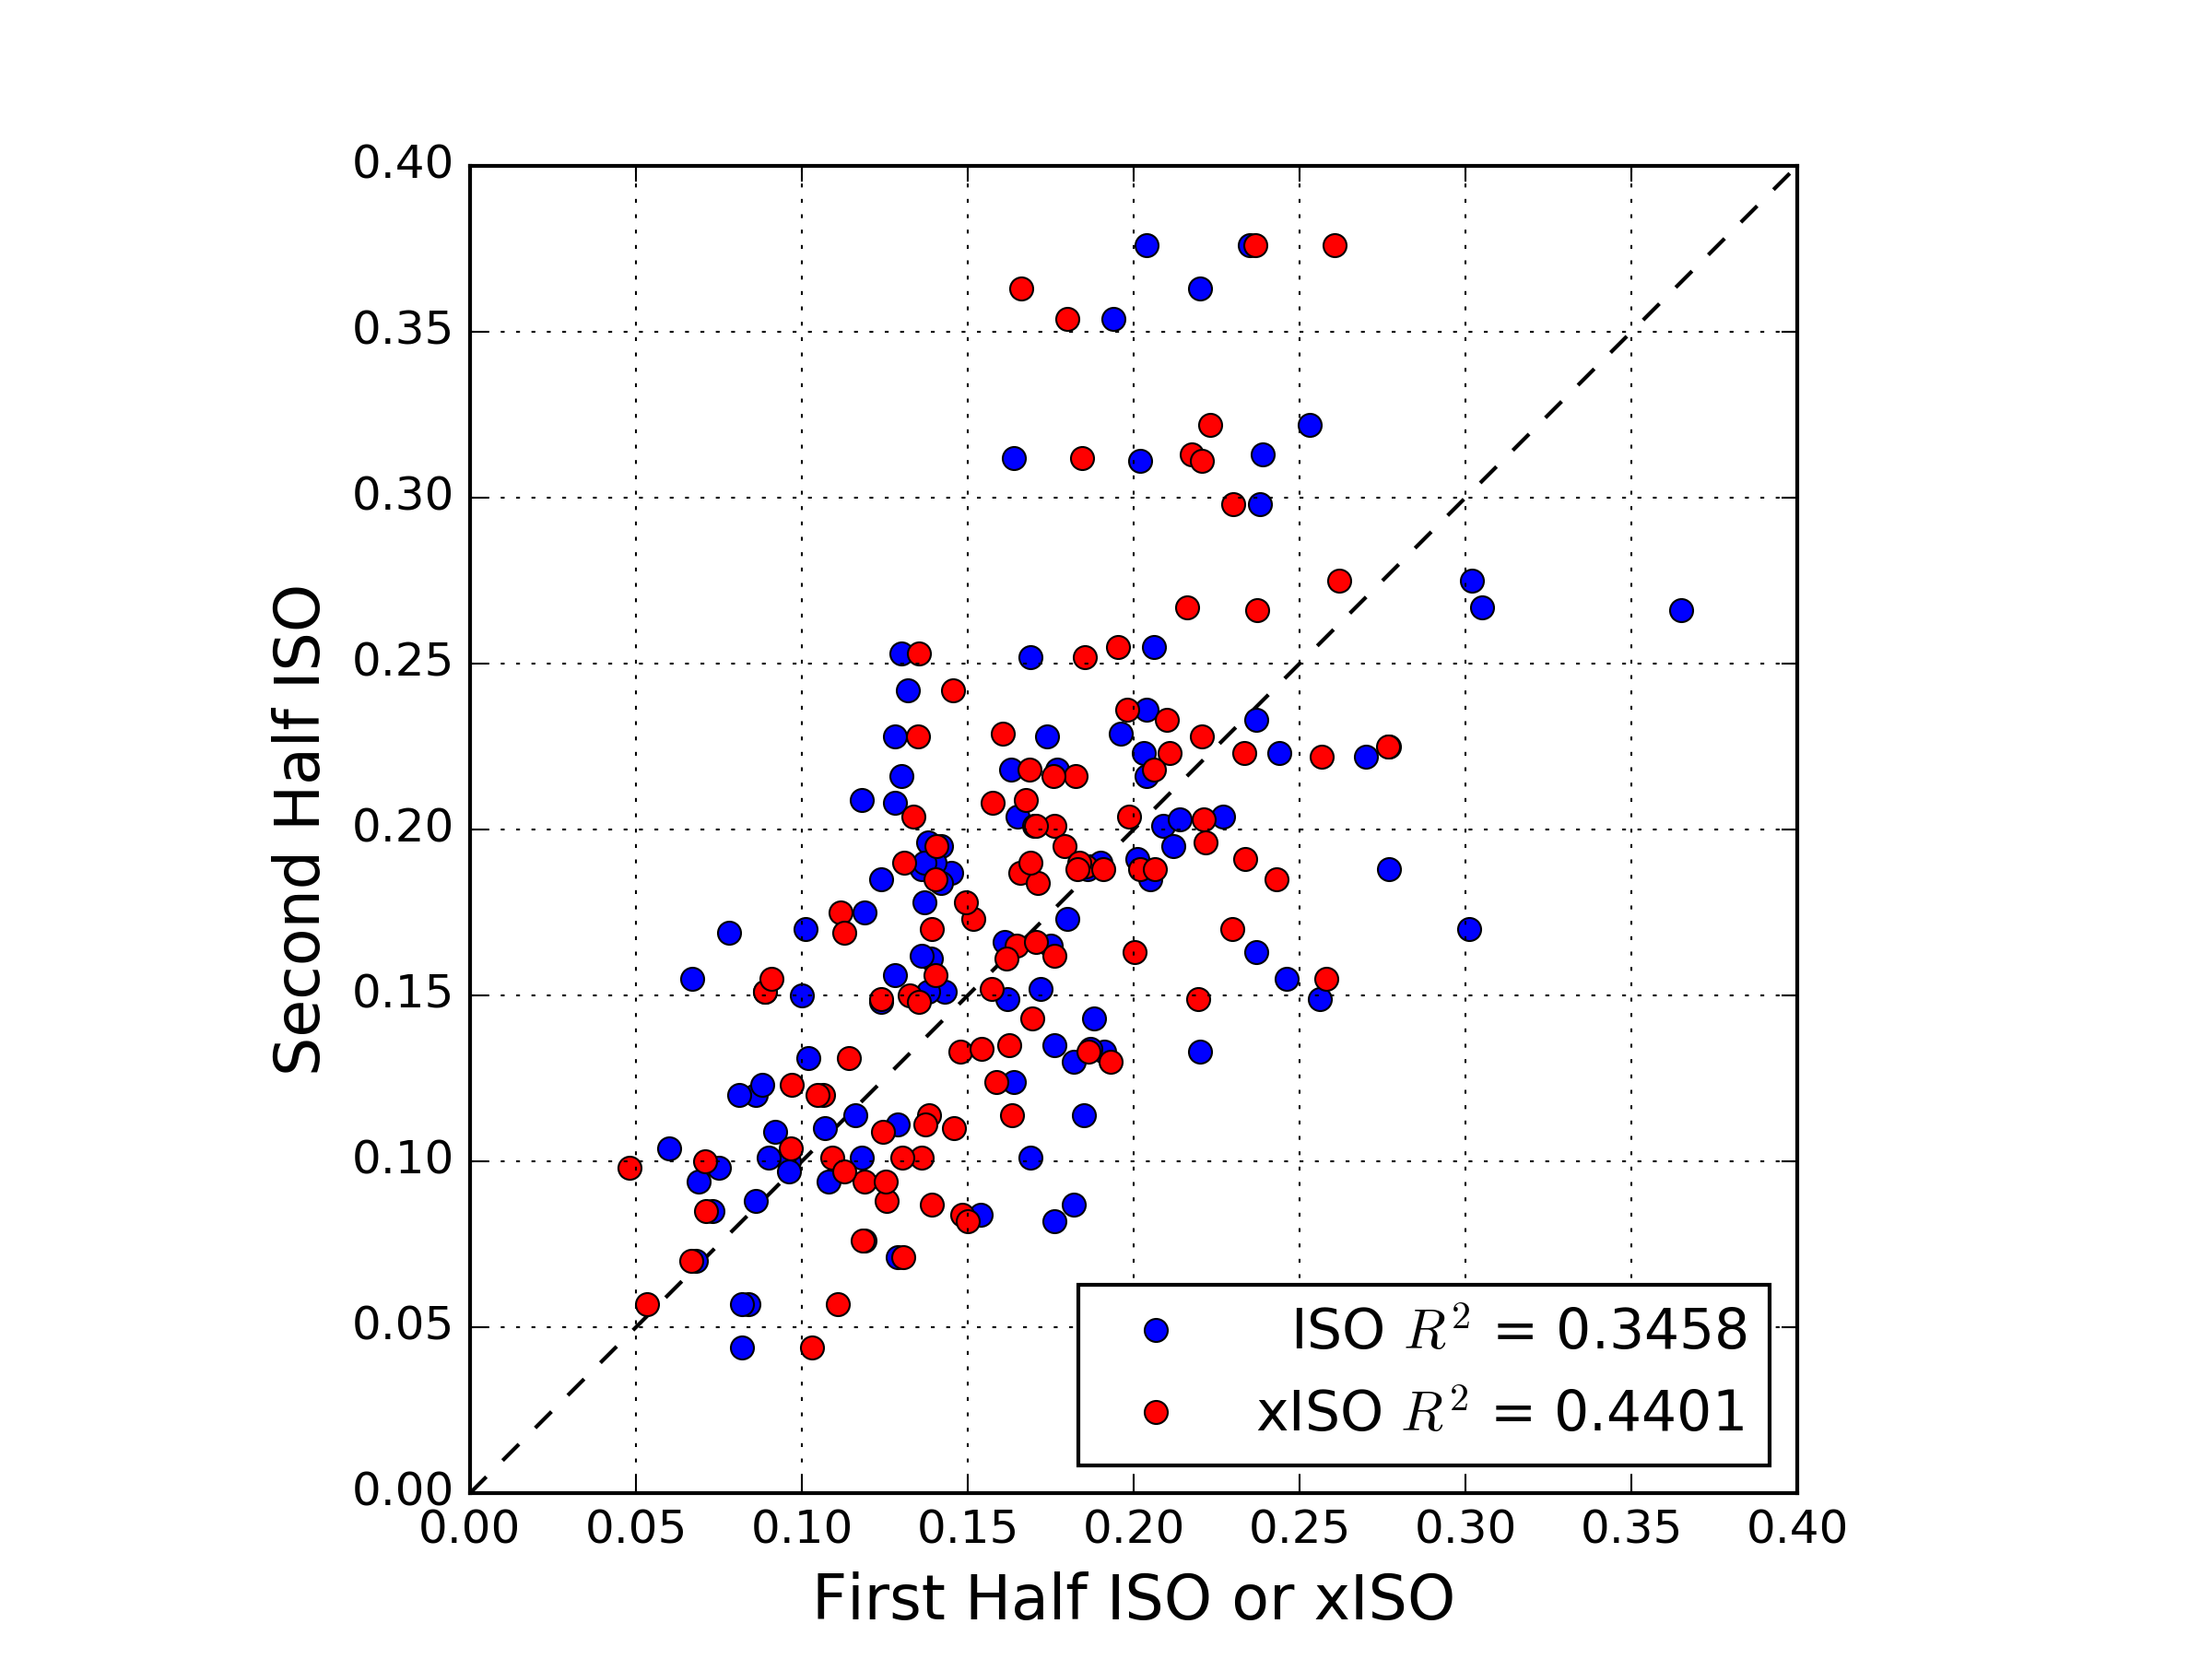
It’s hard to see from the plot, but the R-squared values tell the story: first half xISO does a better job than actual first half ISO at predicting second half ISO. Interestingly, it seems that several players significantly increased second half ISO compared to first half xISO or ISO, and relatively fewer saw a large decrease. I don’t know why this is, but perhaps it is related to the phenomenon detailed by Rob Arthur and Ben Lindbergh on the sudden power spike in 2015.
Having roughly demonstrated the predictive power of our new xISO, let’s show its utility by looking at a few interesting 2016 performers, as of May 22nd:
Trevor Story: ISO = .327, xISO = .272
Domingo Santana: ISO = .142, xISO = .238
Troy Tulowitzki: ISO = .190, xISO = .182
Chris Carter: ISO = .349, xISO = .355
Christian Yelich: ISO = .205, xISO = .201
One of the first half’s great surprises, Trevor Story has a slightly inflated ISO, but he does hit the ball pretty hard, and does not hit many ground balls. While he probably won’t sustain an ISO north of .300, he’s a good bet to beat his Steamer ROS projected ISO of .191. Santana and Yelich are two guys who hit the ball hard, but are are held back by their ground ball tendencies. Chris Carter currently leads the pack in LDFBEV, and is a deserved second in ISO. Troy Tulowitzki fans: sorry, but it appears his days of .250 ISOs are a thing of the past.
So that’s it! We’ve got a cool new tool to use. Perhaps not surprisingly, I’ll be mostly using it for fantasy. Dedicated FanGraphs readers will also note that Andrew Perpetua has been doing work with Statcast data on “these electronic pages” recently as well. His use of launch angles introduces more sophistication into the models, but also more complication. My intent here is to present something which can be evaluated by anyone with a few clicks and a calculator. Please reach out with any qualms, criticisms, or suggestions for improvement!
Andrew is a research engineer from Waltham, Massachusetts. He has contributed to the FanGraphs Community blog, presented at Saberseminar, and appeared as an analytical correspondent on Japanese television. He can be found on Twitter @ADominijanni, where he'll happily talk science, sports, beer, and dogs.
Can we please get this added to player pages and leaderboards. Specifically the L/R splits for xISO would be amazing!!!
Thanks for reading! I’d love to convince the RotoGraphs guys to add it to their new xStats omnibus.
Nice work. I did the calculation for Nomar Mazara and I got .202 xISO vs actual .180 ISO
oops, my bad! i mis-transcribed. the equation should be:
-0.358973*(GB) – 0.108255*(EV) + .00066305*(EV)^2 + 4.66285
Well then now I get xISO of .154 which is disappointing.
Sorry! If you’re asking for advice though, don’t sell Mazara. If you’re buying, bank more on him beating his AVG projections than his ISO
No worries! I’m not selling, I have him in Keeper and he is gold. His FB%, Hard Hit% and Pull% all went up in May vs April, so I think his stats have not normalized yet. And anyway, he is so young that these metrics will continue to improve over time.
Stupid question, where are you finding the exit velocity for ld/fb? Looking on baseballsavant right now and having trouble figuring it out haha
Here’s the leaderboard:
https://baseballsavant.mlb.com/statcast_leaderboard
it’s the column with heading: “AvgFB/LD EV”
Is there somewhere on Baseball Savant to get the numbers for all hitters, not just the leaderboard? Perhaps in a format that’s possible to copy/paste or download? I’m having a devil of a time getting the numbers into a spreadsheet in any kind of useable form outside of doing them one at a time.
EDIT: Nevermind, I was just dumb! 😀
If you execute something like the following search:
https://baseballsavant.mlb.com/statcast_search?hfPT=&hfZ=&hfGT=R%7C&hfPR=&hfAB=&stadium=&hfBBT=1%7C3%7C&hfBBL=&hfC=&season=2016&player_type=batter&hfOuts=&pitcher_throws=&batter_stands=&start_speed_gt=&start_speed_lt=&perceived_speed_gt=&perceived_speed_lt=&spin_rate_gt=&spin_rate_lt=&exit_velocity_gt=&exit_velocity_lt=&launch_angle_gt=&launch_angle_lt=&distance_gt=&distance_lt=&batted_ball_angle_gt=&batted_ball_angle_lt=&game_date_gt=&game_date_lt=&team=&position=&hfRO=&home_road=&hfInn=&min_pitches=0&min_results=50&group_by=name&sort_col=pitches&sort_order=desc&min_abs=0&xba_gt=&xba_lt=&px1=&px2=&pz1=&pz2=#results
you can click the disk button and download a CSV.
Or you can drag/copy from the leaderboard
Hmmmm, is the formula missing any parentheses? I ran this for all qualified hitters and the xISO marks are wayyyyy too high. The unweighted average of 181 hitters is .228, versus an ISO of .174. There’s no way that Chris Carter’s ISO should be .406!
I just noticed this after Francis’ comment. I’m checking my code right now.
Indeed, just a typo, the equation should be:
-0.358973*(GB) – 0.108255*(EV) + .00066305*(EV)^2 + 4.66285
To whom do I appeal to edit the post?
I have asked Eno to work his magic. If he can’t, he’ll surely ask someone who does have access!
Thanks! What a rookie mistake!
Alright y’all, my code, and the numbers for the guys in the post are correct. What I messed up was transcribing the equation.
I should have used more digits too:
-0.358973*(GB) – 0.108255*(EV) + .00066305*(EV)^2 + 4.66285
Great post. One pretty significant issue you are overlooking, however, is park effect. Exit velocity and GB rate (the inputs to xISO) are almost entirely unaffected by park, wheres actual ISO is hugely affected. E.g., Story’s predicted ISO for rest of season should be well above his xISO since he plays half his games at Coors.
Overall, I love the work you have done. But for fantasy purposes, xISO is going to lead to some erroneous expectations unless you adjust it for park effects.
Also, some component of ISO is driven by turning base hits into doubles/triples — i.e., speed. Were you able to test anything like Spd rating to see if it helps the predictive accuracy of in-season xISO?
Thanks for reading! You’re absolutely right, park will play a big role. I actually had brief discussion of that in a “what’s missing” section that i ultimately cut for length (and the Story example made more sense, whoops!). I haven’t thought of a great, simple way to incorporate that yet, but i’m open to suggestions.
As for speed, that’s a great point too. One of the 2015 negative outliers was Miguel Cabrera (ISO significantly less than xISO). I *suspect* this has a lot to do with him settling for singles on hard hit balls that might be doubles for faster players. I’ll see if i can incorporate that too.
The largest positive outlier (highest blue dot on the first figure) was…Bryce Harper! It’s hard to say he beat his xISO because of speed, but it could be related to his launch angles. This is where a more refined approach like Andrew Perpetua’s could be more accurate (though he doesn’t directly calculate xISO).
Thanks again for reading, and for the suggestions!