Author Archive

Aaron Judge Among 25-Year-Old Rookies

The phenomenon that was Aaron Judge’s first half was indeed a sight to behold. Thirty home runs before the All-Star break? Get in line for some hardware.

As some have noticed, as impressive as Judge’s power display has been, he is still a 25-year-old rookie. Now, it used to be that holding rookie status at 25 was perfectly fine, but Trout, Harper, Correa & Co. have jacked up rookie expectations a bit. Players as good as Judge has been at 25 are increasingly often almost this good at 22 or even younger.

But that’s not the point today.

The point today is this: Aaron Judge is on track to have an unprecedented season for a 25-year-old rookie.

Judge’s season already ranks 5th in home runs and 4th in WAR since 1901 for players with rookie status at 25 years of age. Even if he comes down to earth in the second half, he could — should — easily clear first place in both measurements. He only needs six home runs and 0.8 WAR do so. Additionally, his wRC+ has 30 points of leeway for him to maintain first place in that stat as well.

So, it will be a disappointment if Judge does not end up with the best 25-year-old rookie season ever.

Let’s not end the story there. I’d like to examine the full careers of some of those players who still, for now, rate ahead of Judge by wRC+ and home runs. We’ll keep things in the expansion era and stick to three: Tony Oliva in 1964, Mitchell Page in 1977, and Ron Kittle in 1983.

Tony Oliva, 1964 Minnesota Twins (32 HR | 148 wRC+ | 6.2 WAR)

Oliva never hit 30 home runs again and only once more exceeded a 148 wRC+, but he put together a terrific career for the Twins, with 41 WAR, 220 homers, a 129 wRC+. So he gives hope that even if Judge never hits for this much power again, he can still have a very fruitful career. This statement seems very modest now, but Page and Kittle weren’t so fortunate as Oliva.

Mitchell Page, 1977 Oakland Athletics (21 HR | 157 wRC+ | 6.2 WAR)

Page radiated brilliance as a rookie, competence as a sophomore, and was then roughly replacement level for the remainder of his career. I can’t tell you much about what happened to Page, but this newspaper article is an interesting one. Injuries and a dispute with infamous owner Charlie Finley may well both have played a role in Page’s decline.

Unlike Judge, Oliva, and Kittle, Page’s game was not reliant on home-run power. He hit 28 doubles, 8 triples, and stole 42 bases in 1977. But he probably had the best rookie season we’d seen from a 25-year-old until this year. Unfortunately, the rest of his career did not live up to that standard.

Ron Kittle, 1983 Chicago White Sox (35 HR | 118 wRC+ | 2.0 WAR)

Kittle currently holds the “record” for most home runs by a 25-year-old rookie, but he had a weaker rookie year than Oliva or Paige. He also hit 32 home runs the next year, 26 the year after that, and then 21. After that, he never hit more than 18 and could never again make 400 plate appearances in a season. Kittle was great in 1988-89 but only had a combined 450 PA those years, putting up 2.8 WAR and 29 homers.

Kittle ended up hitting a home run every 17 times he stepped to the plate in his career; he just didn’t step to the plate often enough, field well enough, or run the bases well enough to gain more than 5.2 WAR in 3013 PA.

It takes more than power to succeed at major-league baseball. Judge seems to have more than just power, with six steals and a potentially decent glove in right field. He’ll still have to maintain other skills — and stay healthy — to avoid Kittle’s fate. He is very likely to do so, but nothing should be taken for granted.

Conclusion

Oliva, Page, and Kittle (or Jimmie Hall, whose career ended up looking like a rich man’s Kittle or poor man’s Oliva) can’t really tell us all that much about what Aaron Judge’s future may hold.

They are only three players out of many, and we didn’t even look at 24- and 26-year-old rookies.

Kenny Lofton was also a 25-year-old rookie who performed admirably and went on to produce a fantastic career, and whose rookie year did not end up a career year. We didn’t look at Lofton because he is such a different player than Judge, but Lofton is a much better precedent for 25-year-old rookies looking to build on their success than Oliva, Page, and Kittle.

Mark Trumbo is also worth mentioning. He hit 29 home runs as a rookie and has since exceeded that mark three times, although his non-power skills have always been lacking.

This piece is getting longer than expected and it’s time to wrap up.

The careers of Oliva, Page, Kittle, and Hall do contain a couple potentially foreboding patterns. Their rookie home-run numbers remained their single-season career highs, and with the exception of Oliva in 1971 and Kittle in some parts of seasons, none of them ever improved on their wRC+ either.

Aaron Judge is his own player, and will almost certainly have a better rookie year than any of these three comparisons managed. Given that, we can also expect a better career than they managed. And, of course, it’s no shocker to suggest that a near-200 wRC+ will eventually regress.

However, perhaps it is worth wondering about the future of a 25-year-old rookie and whether to treat it the same as a, say, 22-year-old’s future.

Or perhaps it’s not. Regardless, you should ignore me anyway and enjoy Aaron Judge’s mammoth displays of power. The Yankees certainly enjoy it.


Lineup Construction is Changing

Lineup construction is a topic that comes up far more often in proportion to how important it is. But if you can save a few runs in a year by using the proper lineup, it’s worth it. Put your OBP up top, not your steals. The #2 hitter should be better than your #3.

With 14 going on 15 years of lineup splits available on FanGraphs, are any trends clear? Yes, actually. In regards to the two specific issues above, managers do seem to be getting better. Let’s explore. (Note: All “league averages” are non-pitchers. Pitchers aren’t real hitters, after all.)

The on-base percentage of leadoff hitters vs. the league average has climbed. In 2002, the league average OBP was .336 whereas it was just .332 for leadoff hitters. Ten years later, in 2012, league average was .324 but leadoff hitters hit .344. The gap has begun to decline since then, but the trend is still apparent, and in 2016 leadoff hitters have a .332 OBP vs. the league’s .324. Overall, here’s a simple chart of the league’s leadoff OBP minus the overall average OBP for each year since 2002:

Not everyone has caught on; either Dusty Baker or Ben Revere really need to figure things out soon for the Nationals, for example. But leadoff hitters are getting better at getting on base.

Meanwhile, managers have a longer way to go in their understanding of the fact that a #3 hitter will most often find themselves batting with the bases empty and two outs which, naturally, is not a good situation for scoring runs. However, just by comparing the wRC+ of the league’s #2 and #3 hitters shows that some teams are learning. In the dark days of 2002, #2 hitters had a wRC+ of 92, compared to 128 for #3 hitters. Since then, #2 hitters haven’t been that bad, but they haven’t been great, either. However, the last three years have been #2 hitters’ most productive since 2002: they had a 102 wRC+ in 2014, 107 in 2015, and currently a 105 in 2016. Teams haven’t moved their best hitters out of the three hole (this will be #3 hitters’ seventh straight year with a wRC+ of 120 or better), but they are starting to see the value of a good #2 hitter. This has led to the wRC+ gap between #2 and #3 hitters to exhibit a clear downward trend since 2002:


Even if you take out that 2002 season, the trend holds. It is still basically due to a change in the past two years, but the more hitters like Andrew McCutchen or Manny Machado, Corey Seager or George Springer bat in that second spot in the order and have success, the more we can expect out of the two hole. A lot of these #2 hitters, you might note, are young guys with a lot of career ahead of them with their current teams. It’s up to managers to keep them at #2 instead of moving them to #3 as these players continue in their careers. They may not, leaving 2015 and 2016 as anomalies so I can be wrong again. (Actually, I’m never wrong, because where’s the fun in that?)

But next time you lament the general failures of managers to put out the correct lineup, remember, things are getting better. Maybe it’s just your favorite team’s manager.


The Danger of Fly Balls

Last year, I suggested that Wilson Ramos might want to try hitting the ball in the air more.

It turns out, there is a Washington National who appears to have made an effort to put the ball in the air more, but that is not Wilson Ramos. It is their soon-to-be-erstwhile shortstop, Danny Espinosa.

Last year, Espinosa rode a hot start to a .240/.311/.409 line at the end of the season, good enough for a 94 wRC+. It was his first offensive season since 2012 that you would accept from a starting middle infielder, and you’d be excused for seeing it as a sign that he might be back to his 3-win form of 2011 and 2012.

This year, however, Espinosa is scuffling to a .201/.307/.288 line that has been inflated by five intentional walks. Overall his wRC+ is down to 58.

One might look at his 23% strikeout rate and note that, while poor, it is still better than his 27.5% career mark or 25.8% 2015 rate. (His plate discipline numbers are indeed better this year than last.) One might notice a .250 BABIP compared to his .296 career number and expect improvement there. Also noticeable is a 7.0% HR/FB rate when his career mark is 12.9%. So perhaps we could expect something more like his 86 career wRC+ going forward? Or at least his Steamer projection of 79? (That is, if Trea Turner weren’t highly likely to be called up shortly.)

Possibly, but there is something else about Espinosa’s numbers that create pause: he has become a fly ball hitter. Entering this season, Espinosa had never posted a full-season GB/FB ratio lower than 1.12, but this year he has hit 37 grounders and 43 flies for a 0.86 rate.

If you hit a lot of fly balls, your BABIP is going to suffer. If those flies don’t turn into home runs, it’s a double whammy, and Espinosa is certainly getting whammed pretty good by that combination.

This is the danger of fly balls. And they could become even more dangerous if you try to hit them.

I can’t read any player’s mind, so perhaps Espinosa just happens to be hitting the ball in the air more. But ground ball and fly ball rates stabilize pretty quickly, and how you hit the ball is one of the more controllable aspects of hitting (it’s where the ball goes that’s the rub).

Espinosa has had above-average power, so why not try to convert that into extra home runs by hitting more flies?

Another way to look at hitting grounders vs. hitting flies is the target launch angle. So another way to interpret “hit more fly balls” is “hit the ball at a higher angle.” Espinosa is hitting the ball at too high an angle, and it follows that if you intend to hit more fly balls, they may well on average end up launching at a higher angle than in the past.

Monday night was the clearest example yet of this problem: Espinosa hit fly balls at 56, 59, and 61 degrees in his three plate appearances, and all three were easy outs to left field. As for the exit velocity, his contact in the air spent much of this season around 95-96 mph, which is good, but that hasn’t done any good without the right launch angle, and now he’s also down to 94.5 mph on the season when he hits the ball in the air, with Monday’s 86, 89, and 92 velocities contributing to that decline.

This turned into an analysis of why Espinosa has been struggling even more than the most pessimistic might have imagined. Perhaps there is a general lesson as well, however, beyond the well-established fact that fly balls without home runs are nigh useless.

Some players might want to pick one approach and stick with it to improve as much as possible. This is especially true if that hitter isn’t a great one, because they might not get the results they are hoping for by changing things up. Although you could argue the potential rewards for a below-average hitter are worth the risk and it just hasn’t worked out for Espinosa, one might counter that the likelihood of the change working for a less-talented hitter is quite low. (And the risk in this particular case was even higher with the hot prospect on his tail, limiting the time he had available to work things out.)

Take Ramos, a better hitter than Espinosa over the course of their careers, but not a spectacular one either. He hasn’t changed a thing in ground/fly ball terms: his 2016 GB/FB ratio is basically identical to his 2015 ratio, but his BABIP has gone from .256 to .370 and he is hitting .333/.385/.512. That won’t continue, but his ROS projected wRC+ has improved to the 90’s, when his actual wRC+ in 2015 was just 63.

Consistency in approach can produce better results with time. If you want to change things up, beware the risks. You may end up with the worst of both worlds.

You could also end up succeeding, as Leonys Martin has.


Bryce Harper: Better in 2016?

Every writer and fan in America seems obsessed right now with Bryce Harper’s hypothetical-in-name-only free agency after the 2018 season. Clearly, to say Harper is an intriguing player and free agent is to break no new ground.

But three years in advance? There are more pressing concerns, such as: Is it possible to improve on a .330/.460/.649, 42 home run, 197 WRC+, 9.5 WAR campaign? This may strike some as an absurd proposition in many respects, but it is nonetheless a subject of discussion just before those glorious days whereon pitchers and catchers report to spring training, providing the first light at the end of the long, dark tunnel that is the offseason.

Federal Baseball has the goods on this prospect of Bryce Harper actually getting better this year, quoting the man himself:

I’ve always said every time I come into Spring Training or every time I come into the season, I can always get better, you can get better everywhere you play. [New first base coach] Davey Lopes definitely is going to help me on the bases, that’s going to be a lot of fun. Being able to pick the mind of [new manager] Dusty [Baker] if that’s outfield, if that’s hitting, if that’s with pitchers and things like that, and he’s a very good hitter. So, to learn from a guy like that is very exciting, very fun and just makes the game that much better.

This is clearly the correct approach for any player to be taking. Any player not looking to improve is setting himself up for decline.

Base running does seem like something that anyone can improve on, or at least work on to prevent age-related decline (not that Harper is worried about that to any significant degree yet). But while Harper’s base stealing has cratered since 2013, his base running is okay as he did put up +3.2 BSR in 2015; that could indeed get better, but it’s not bad and it’s also not what we’re really here for.

The real question is, can you really get better as a hitter after putting up a 197 wRC+? As mentioned at the outset, it seems highly unlikely. And if we mean statistical superiority (hint: that’s what we mean), rather than some nebulous, clubhouse-valued notion of driving in runs or advancing runners (which you always worry is what they mean), the numbers a better season would produce become only even more mind-boggling.

Paul Sporer’s player preview for Harper notes Harper’s “career-highs in homers per fly balls (27%) and batting average on balls in play (.369).” Harper did post a .352 BABIP in 2014 after .310 and .306 efforts in his first two seasons, so he does seem to be above-average on balls in play, but no one should bank on another .369 BABIP season. And if the goal is to improve Harper’s offensive numbers, the BABIP might have to grow to an even more significant degree. Were that to happen, using it to in turn project 2017 would only be the errand of an even greater fool than I.

Federal Baseball commentator d_c_guy also notes precedent to indicate that it will be hard for Harper to put up better numbers in 2016, or even similar ones: “Mantle did put up a wRC+ of 196 in 1961 and 192 in both 1962 and 1963. Mays never did it. Miguel Cabrera and Albert Pujols have never done it. Setting expectations at that level is cruising for disappointment.” Indeed it is.

With all of the evidence before you, I am not going to sit here and say Harper’s numbers will get better. That seems extremely unlikely.

There is another avenue, however, where Harper could theoretically improve, and that is the strikeout rate. 20% is certainly good enough these days, especially for a power hitter, but lower marks are possible. The thing is, cutting back on strikeouts while not losing power or walks is a tall task for anyone. Even Pujols, who managed K rates below 10% during some of his most successful seasons, had a hard time reaching Harper’s 2015 marks of 42 home runs and a 19 BB%, let alone the .369 BABIP, in those years. So, no, I’m not telling you to bank on this, either.

Otherwise, only even higher balls-in-play success (already discussed) or even more power could produce a better line for Harper in 2016, but we know he already set career-highs in those marks last year. Can those get better? Sure, but not in sustainable fashion. Better HR/FB rates are possible, but Harper’s 27% figure in 2015 was aided by 15 “Just Enough” home runs according to Hit Tracker Online. Or, if you consider Harper might hit more fly balls instead of more fly balls per home run, then you’re looking at a BABIP decline.

Everything is possible, but most things are unlikely.

The thing is, who really needs Harper to get better than he was last year? If you cut back his triple-slash marks by 10%, you still get a .297/.414/.584 season. I think everyone would take that…except Washington’s division rivals and their fans. Well, and perhaps Harper himself. After all, $600-million contracts don’t grow on trees; they grow on 10-WAR seasons in your early twenties.


Hit More Fly Balls, Wilson Ramos!

Wilson Ramos is currently third on the Nationals with 7 home runs. He has done that on 41 fly balls, for a HR/FB rate of 17.1%. But Ramos has also hit the ball on the ground in play 103 times. Throw in his 37 line drives and that’s a ground ball rate of 56.9%. For a guy as slow as Ramos, how can that be good?

Ramos has always hit the ball on the ground, however. His career ground ball rate is 54.3%. He has a career average of .206 on those grounders. That is below average, as you’d expect.

Meanwhile, he hits fly balls 27.5% of the time for his career, and homers on 16.6% of his flies. That’s better than the career rates of Jose Bautista (16.5%), Todd Frazier (15.8%), Adam Jones (15.2%), Adam LaRoche (15.0%). It’s better than a lot of players who are known for their power.

The difference, of course, is the in the fly-ball rates. Bautista has a career 45.5% FB% mark. Frazier’s is 40.8% for his career. Jones, 33.4%. LaRoche, 41.2%. And there’s Ramos with a paltry 27.5%.

But here’s possibly the most startling statistic: of 703 qualifiers since 2002, Wilson Ramos ranks 57th in HR/FB and 648th in FB%.

Ramos clearly has power just from watching him, and when he gets the ball in the air, he can hit it out. When he hits it on the ground, his speed makes him less likely than most to reach base.

So why is he hitting the ball on the ground more than half the time?

There might be a good answer to that question, but if he starts to hit more fly balls, there might be a rather less good answer to this question:

Why didn’t he start doing this sooner?

(Cross-posted at federalbaseball.com)


Pitchers Aren’t Just Bad Hitters

They are TERRIBLE hitters. They are not comparable to even the worst real hitters.

Max Scherzer said he enjoys hitting, but after getting hurt doing it, he thinks the DH might not be the worst idea.

The designated hitter is always a touchy subject, even though the National League is, if not the only league anywhere in the world, amateur or professional, that continues to employ it, then one of the few leagues to do so.

Yet I am not fully in one camp or the other. However, bringing the DH to the NL would not be a disaster of gargantuan proportions, as many a diehard NL fan might tell you. In fact, in an era of dying offenses, perhaps getting the worst hitters out of the batter’s box is an acceptable idea.

In 5519 PA in 2014, pitchers hit .122/.153/.153, for a minus-19 wRC+. The absolute worst hitter with at least 100 PA was JB Shuck, with a .145/.168/.209 line for a wRC+ of 2, or 21 points higher than the average pitcher. 21 points of wRC+ was also the 2014 gap between Nelson Cruz and Yan Gomes, or pick any of a number of great offensive seasons from merely good ones. Except here you are starting at terrible and ending up at abysmally awful. I would have created a “wRC+ X was Y times higher than wRC+ Z” construct instead, but it’s hard to do that when dealing with MINUS-19 and a positive number.

Meanwhile, the 30 worst hitters with 100+ PA last year, who combined for 5544 PA, comparable to the number of pitcher PA, posted a triple slash of .184/.247/.261. Their median wRC+ was 44; the mean, 38. (Note: Not -19.)

Bill Bergen, the poster boy for awful hitters, had a career wRC+ of 22 — 41 points higher than your typical 2014 pitcher.

Pitchers are terrible at hitting because it’s barely part of their job as it stands. And then they get hurt, like Chien-Ming Wang (running the bases) or Max Scherzer, doing this part of their job that is nearly irrelevant to the rest of it. It’s like asking the janitor to file a TPS report, and then he gets a really nasty paper cut and can’t go back to work for some time. (Terrible analogy, I know.)

I know the arguments in favor of the National League system as well, but won’t rehash them here, for fear of convincing myself to completely accept the DH, and thus further upsetting any number of fans. For example, did you know (and other people have basically written this already) the pitcher’s turn in the order is actually a helpful hint, not a complicating factor, in deciding when to remove a pitcher from a game? Not pinch-hitting means that you are allowing someone who can’t hit to hit, in exchange for the least effective parts of his real job, the mid- to late innings. The gap between a fresh reliever and a starter multiple times through the order on the mound *and* the gap between even a pinch-hitter and the pitcher at the plate are almost always both going to be in favor of removing the pitcher.

See, that’s what I meant. I’ll cut my losses and avoid trying to devise another lame analogy to conclude with.


Power and Patience (Part V of a Study)

One, two, one, two, three, four.

Sorry. Those were links to the first four parts. Anyway, now it’s time to fill the circle of this series. This final piece isn’t really much of an analysis, but sort of a potpourri of interesting trivia. Trivia’s where these five weeks started, after all. Hopefully there was sufficient analytical substance to the first four parts. (Or any.)

Here is an interesting tidbit to start: only two batting title qualifiers have ever had a higher ISO than OBP in a season. One was Barry Bonds in his insane, 73-HR 2001 season (.536 ISO, .515 OBP–I told you it was insane). The other was Matt Williams in 1994. Take a look at the 1994 OBP and ISO scatter chart among qualifiers, with a line of y=x for reference:

I trust you to figure out which one belongs to the current manager of the Washington Nationals. He had a .319 OBP and a .339 ISO that season. (And, FYI, that lonely dot in the lower left belongs to 24 year old Twins catcher Matt Walbeck and his .204/.246/.284 in 359 PA. And that one insanely close to the .500 OBP? Frank Thomas.)

And Barry Bonds’s 2001? Well, just take a look:

Yeah.

(I kind of wanted just to show that chart.)

That only two players ever had a single season, let alone career, with a higher ISO than OBP, a good way to measure a player’s relative prowess at each facet of hitting is to look at the gap between those statistics.

Care to guess the player with a career OBP below the historical average of .333 who has the smallest gap between his career OBP and ISO? To the surprise of nobody, it’s:

Dave Kingman

Kingman posted a career .302 OBP and .242 ISO, making him the ultimate in empty power. By Kingman’s last year, 1986 with Oakland, all he could do was hit home runs. He had 35, while hitting .210/.255/.431, which even in 1986 was only good for a wRC+ of 86. Kingman also has the 2nd highest ISO period among those with a sub-.333 OBP, behind Russell Branyan (.253 ISO, .329 OBP).

Expand this list, by the way, and it feels like a pretty accurate indicator of players who provided solid and at times even great power, but weren’t great offensive players. The top 10: Kingman, Steve Balboni, Ron Kittle, Branyan, Tony Armas, Alfonso Soriano, Dick Stuart, Matt Williams, Tony Batista and Mark Reynolds. The debuts of those players range from 1958 (Stuart) to 2007 (Reynolds), so this phenomenon is not exactly a 21st century one. It does, however, divide pretty well along pre- and post-expansion lines.

Among players who debuted before Stuart, the next smallest gap here belongs to a Hall of Famer: Ernie Banks, with a .330 OBP and .226 ISO. He’s 18th on the list, so that’s about where the last paragraph’s thesis breaks down. During his career, 1953-71, the league-wide non-pitcher OBP was .329, so Banks was about average reaching base, but provided a ton of value from his years at shortstop and his power (1953-71 ISO: .135).

Wally Post is 19th, and he debuted in 1949, making him the top pre-1950 debut player on the OBP minus ISO list, and the smallest gap belonging to someone who debuted before 1940 belongs to DiMaggio, who debuted in 1937. He ended up with a .324 OBP and .164 ISO in his 10 seasons with the Bees, Reds, Pirates and Giants. We’re talking, of course, about Vince DiMaggio, not Dom.

Go back all the way to 1901 and you find the career of:

Albert Samuel “Hobe” Ferris

Hobe Ferris played from 1901-09 and never led the league in home runs, but was in the top 7 five times in a nine-year career on his way to 40 career home runs. His .102 career ISO came in a time frame when league-wide non-pitcher ISO was .077, but he only produced a career .265 OBP (vs. the league’s .310). A second- and third-baseman with a good defensive reputation (backed up today by his +70 career fielding runs on Baseball Reference), he also may have been the first power threat in MLB history who didn’t reach base effectively. His best season was actually during the nadir of the dead ball era, his penultimate year in 1908 when he hit .270/.291/.353 for a 109 wRC+. This was mostly due to an unusually efficient year reaching base, but even his .083 ISO was better than the league’s .069.

All-time, however, Ferris’s OBP-ISO gap ranks as just the 166th smallest out of 692 who meet the 3000 PA, sub-.333 thresholds. The 167th smallest belongs to another turn-of-the-century player, the infamous Bill Bergen, who was just bad at everything. In general, you’re just not going to find turn of the century players whose ISO’s are particularly close to their OBP’s, because ISO’s were so low 100 years ago.

To start getting into the other types of players–good OBP, not so good power–let’s remove any cap on the OBP and see what happens at both ends of the list of OBP and ISO gaps. Again, 3000 PA is the cutoff.

10 Lowest Gaps: Kingman, Mark McGwire, Balboni, Kittle, Branyan, Juan Gonzalez, Sammy Sosa, Ryan Howard, Armas, Soriano

10 Highest: Roy Thomas, Miller Huggins, Eddie Stanky, Eddie Collins, Max Bishop, Richie Ashburn, Ferris Fain, Johnny Pesky, Luke Appling, Muddy Ruel

So, apparently Mark McGwire’s .263 career batting average is a little misleading…as in, perhaps the most misleading batting average of all time. He posted a .394 OBP and .325 ISO. The other three players who weren’t on this list when sub-.333 OBP’s were removed are Gonzalez, Sosa, and Howard. None of them have spotless resumes, but they are bound to be the 2nd to 4th best hitters on that list in most any ranking of these players, subjective or objective. After Howard, the next few players on this list who had an OBP above .333: Richie Sexson (15th), Albert Belle (20th), Jose Canseco (25th), Andruw Jones (28th) and Greg Vaughn (30th). All probably better hitters than Kingman and certainly better hitters than Balboni.

Meanwhile, Roy Thomas has the highest such difference, with a line from 1901-11 of .282/.403/.329. (He debuted in 1899.) From 1900-06, Thomas led the majors in walks every year except 1905. He hit a fascinating .327/.453/.365 in 1903, for a 138 wRC+.

We might think that everybody with a large gap is from the dead ball era, but such is not the case. Richie Ashburn (1948-62) and Luke Appling (1930-50) carved out Hall of Fame careers. They got away with a lack of power by hitting .300 in their careers. These next two players weren’t career .300 hitters, providing value more so with high walk rates, and how can we talk about players who got on base but didn’t hit for power without them:

Eddie Stanky and Ferris Fain

Stanky (.410 OBP, .080 ISO) played from 1943-53 and Fain (.424 OBP, .106 ISO) from 1947-55, and they might be the two most famous players in MLB history in terms of reaching base without being much of a power threat. They were pioneers of the you’re-never-pitching-around-me-but -I-will-foul-off-pitches-and-work-a-walk-anyway school of hitting, especially Stanky, who only hit .268 and slugged .348 in his career. (Roy Thomas could have been the “pioneer” of this if power were more of a thing when he played.) Stanky’s most striking season in this regard was probably 1946 when he hit .273/.436/.352. Fain, meanwhile, had a .455 OBP and .066 ISO in his last season in 1955.

Just as the first list in this piece lacked many dead-ball era players, this list of large OBP-ISO gaps seems to lack 21st (and late 20th) century players. The first player to debut after 1980 that we meet on the list, in the 13th place?

Luis Castillo

Castillo’s offensive production was almost entirely in his .290 batting average. If batting average says little about McGwire, it says almost as little about Castillo, who posted a career .368 OBP and .061 ISO.

The first good hitter on the list (with his career 97 wRC+, Castillo was decidedly average) is Dave Magadan, 23rd, with a .390 OBP and just a .089 ISO. He had a 117 career wRC+. Magadan’s 1995 season with Houston was his wildest as he managed an OBP of .428 with an ISO of just .086.

Two spots below Magadan is one of the three who started us down this month-plus-long path:

Wade Boggs

Boggs had a .328/.415/.443 career line for a 132 wRC+. In his rookie season in 1982 (381 PA), he was already producing a .406 OBP…with an ISO of just .092.

We might as well wrap up with our other two above-.400 OBP, under-.200 ISO players since 1961. Joe Mauer (.405 OBP, .146 ISO) and Rickey Henderson (.401 OBP, .140 ISO) have wRC+’s of 134 and 132 respectively. Their OBP-ISO gaps of .261 and .259 rank among the 200 largest gaps, or roughly the 90th percentile.

There are plenty more angles, more than I can cover, that one could take with this. At this link you can find the list of players with 3000 PA since 1901, ordered from the largest OBP-ISO to the smallest, with extra stats (as I didn’t change or remove the default dashboard stats).


Power and Patience (Part IV of a Study)

We saw in Part Three that the R^2 between OBP and ISO for the annual average of each from 1901-2013 is .373. To find out the correlation between OBP and ISO at the individual level, I set the leaders page to multiple seasons 1901-2013, split the seasons, and set the minimum PA to 400, then exported the 16,001 results to Open Office Calc.

(Yes, sixteen thousand and one. You can find anything with FanGraphs! Well, anything that has to do with baseball. Meanwhile, Open Office operating on Windows 7 decides it’s tired the moment you ask it to sum seven cells. At least it gets there in the end.)

The result was .201, so we’re looking at even less of a correlation in a much larger sample compared to the league-wide view. Are there periods where the correlation is higher?

Recall from Part Two that from 1994-2013 the R^2 for the league numbers was .583. Using individual player lines (400+ PA) from those seasons increases our sample size from 20 to 4107 (again splitting seasons). This gives us an R^2 of .232. That’s a little higher than .201, but not very much so.

All in all, it’s not the most surprising thing. On-base percentage and isolated power, mathematically, basically have nothing in common other than at-bats in the denominator. Given that, any correlation between them at all (and there is some) suggests that it either helps players hit for power to be an on-base threat, or vice versa. Not that one is necessary for the other, but there’s something to it. And throughout history, as we saw in Part One, a majority of players are either good at both aspects of hitting, or neither.

In fact, it’s the exceptions to that rule that triggered this whole series, those higher-OBP, lower-ISO players. Again from part one, there were 12 19th century, 21 pre-1961 20th century, and 3 post-1961 20th-21st century players with a career OBP over .400 and ISO below .200.

Much of this can probably be attributed to that consistency OBP has had historically relative to ISO that we observed a couple weeks ago. Continuing with the somewhat arbitrary 1961 expansion era cutoff, from 1961-present, 168 players with 3000 PA have an ISO over .200 and 18 have an OBP over .400; from 1901-60, it was 43 with the ISO over .200 and 31 with the OBP over .400. The .200+ ISO’s are split 80-20% and the .400+ OBP’s are split about 60-40%. The latter is the much smaller gap, as we’d expect. (Some players whose careers straddled 1961 are double-counted, but you get the basic idea.)

But let’s see if we can trace the dynamics that brought us to this point. What follows is basically part of part one in a part three format (part). In other words, we’re going to look at select seasons, and in those seasons, compare the number of players above and below the average OBP and ISO. Unfortunately, it’s hard to park-adjust those numbers, so a player just above the average ISO at Coors and a player just below it at Safeco are probably in each other’s proper place. But that’s a minor thing.

After the league-wide non-pitcher OBP and ISO are listed, you’re going to see what might look like the results of monkeys trying to write Hamlet. But “++” refers to the number of players with above-average OBP and ISO; “+-” means above-average OBP, below-average ISO; “-+” means below-average OBP and above-average ISO; and “- -” means, obviously, below-average OBP and ISO. The years were picked for various reasons, including an attempt at spreading them out chronologically. Notes are sparse as the percentages are the main thing to notice.

1901: .330 OBP, .091 ISO. Qualified for batting title: 121. 35% ++, 25% +-, 12% -+, 28% – –

1908: .295 OBP, .069 ISO. Qualified for batting title: 127. 41% ++, 23% +-, 8% -+, 28% – –

The sum of OBP and ISO was its lowest ever in 1908.

1921: .346 OBP, .117 ISO. Qualified for batting title: 119. 42% ++, 24% +-, 8% -+, 26% – –

Baseball rises from the dead ball era. Still relatively few players are hitting for power while not getting on base as much.

1930: .356 OBP, .146 ISO. Qualified for batting title: 122. 45% ++, 23% +-, 3% -+, 29% – –

The best pre-WWII season for OBP and ISO. Almost nobody was about average at hitting for power while not as good at reaching base. Two-thirds of qualifiers had an above-average OBP vs. fewer than half with an above-average ISO.

1943: .327 OBP, .096 ISO. Qualified for batting title: 106. 41% ++, 24% +-, 10% -+, 25% – –

World War II, during which OBPs stayed near the average but ISOs tanked. That would not necessarily appear in these numbers, because the players in this segment are categorized vs. each year’s average.

1953: .342 OBP, .140 ISO. Qualified for batting title: 88. 44% ++, 22% +-, 14% -+, 20% – –

The first year where sISO exceeded OBP was easily the lowest so far in terms of players below average in both OBP and ISO. (Note: So few players qualified on account of the Korean War.)

1969: .330 OBP, .127 ISO. Qualified for batting title: 121. 45% ++, 17% +-, 14% -+, 23% – –

1983: .330 OBP, .131 ISO. Qualified for batting title: 133. 43% ++, 16% +-, 17% -+, 25% – –

1969 and 1983 were picked because of their historically average league-wide numbers for both OBP and ISO. The percentages for each of the four categories are about equal in both seasons.

2000: .351 OBP, .171 ISO. Qualified for batting title: 165. 39% ++, 16% +-, 15% -+, 29% – –

The sum of OBP and ISO was its highest ever in 2000.

2011: .325 OBP, .147 ISO. Qualified for batting title: 145. 50% ++, 17% +-, 12% -+, 21% – –

2012: .324 OBP, .154 ISO. Qualified for batting title: 144. 44% ++, 24% +-, 14% -+, 18% – –

2013: .323 OBP, .146 ISO. Qualified for batting title: 140. 45% ++, 24% +-, 17% -+, 14% – –

Originally, this part ended with just 2013, but that showed an abnormally low “- -” percentage, so now 2011-13 are all listed. From 2011 to 2012, the split groups (above-average at 1 of the 2 statistics, “+-” or “-+”) increased sharply while the number of generally good and generally bad hitters decreased. From 2012 to 2013, there was almost no change in qualifiers based on OBP (the “++” and “+-” groups). Among those with below-average OBPs, the number with above-average power increased as the number with below-average power decreased. Most significantly, 2011-13 has produced an overall drop in players who are below average at both.

I don’t want to draw too many conclusions from this set of 12 out of 113 seasons. But a few more things come up besides the recent decline in players below average in both OBP and ISO.

Regarding “++” Players

Unsurprisingly, limiting the samples to qualifiers consistently shows a plurality of players to be good at both the OBP and ISO things.

Regarding “- -” Players 

Essentially, until 2012, this group was always at least 1/5 of qualifiers, and usually it was 1/4 or more. The last couple years have seen a decline here. Is it a trend to keep an eye on in the future (along with the league-wide OBP slump from Part 3)?

Regarding “++” and “- -” Players

Meanwhile, the majority of players will be above average at both getting on base or hitting for power, or below average at both. The sum of those percentages is just about 60% at minimum each year. Of the ten seasons above, the lowest sum is actually from 2013, mostly on account of the 14% of players who were below average at both.

This also means that it’s a minority of players who “specialize” in one or the other.

Regarding “+-” vs. “-+” Players

The “-+” players, those with below-average OBPs and above-average ISOs, show the best-defined trends of any of the four categorizations. In general, before 1953, when OBP was always “easier” to be good at than ISO (via OBP vs. sISO as seen in Parts 2 and 3), you saw fewer ISO-only players than you see today. Either they were less valuable because power was less a part of the game and of the leagues’ offenses, or they were less common since it was harder to exceed the league average.

The number of OBP-only players is more complicated, because they too were more common in the pre-1953 days. But they have jumped in the last two years from 1/6 of qualifiers from ’69-’11 to 1/4 of qualifiers in 2012 and 2013. Overall, the recent decline in “- -” players has come at the expense of “+-” players. This can also be interpreted as indicating that players are becoming better at reaching base while remaining stagnant at hitting for power (important distinction: that’s compared to the annual averages, not compared to the historical average; as we saw last week, OBP is in a historical decline at the league level).

Conclusion

The key takeaway for all of this is that there are always going to be more players who are above-average in both OBP and ISO or below average in both. Even if the correlations between OBP and ISO on the individual level aren’t overly high, clearly more players are good at both or at neither.

This isn’t just on account of players with enough PA to qualify for the league leaders being better hitters in general, because while the number of players above-average in both who qualify is always a plurality, it’s almost never a majority. It takes a number of players who are below-average at both to create a majority in any given year.

In terms of OBP-only players and ISO-only players, the former have almost always outnumbered the latter. This is sufficiently explained in that reaching base is often key to being a good hitter, while hitting for power is optional. (That’s why OPS has lost favor, because it actually favors slugging over OBP.) Even when batting average was the metric of choice throughout baseball, those who got the plate appearances have, in general, always been good at getting on base, but not necessarily at hitting for power.

Next week this series concludes by looking at the careers of some selected individual players. The most interesting ones will be the either-or players, with a significantly better OBP or ISO. We won’t look much at players like Babe Ruth or Bill Bergen, but instead players like Matt Williams or Wade Boggs. Stay tuned.


Power and Patience (Part III of a Study)

So, last week we hopefully learned a few things. Let’s continue looking at league-wide trends.

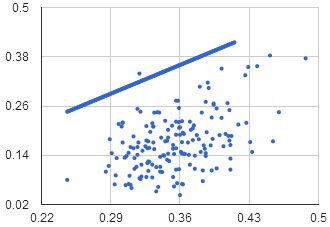
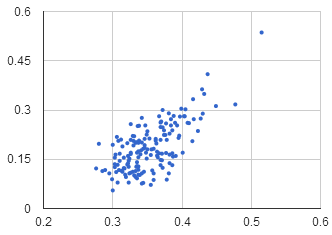
In terms of getting on base, not getting on base, hitting for power, and not hitting for power, there are actually four mostly-distinct periods in baseball history for each combination. Define these terms against the historical average and you get:

  • 1901-18 – Players aren’t getting on base or hitting for power

  • 1919-52 – Players are getting on base but not hitting for power

  • 1953-92 – Players aren’t getting on base but are hitting for power

  • 1993-pres-Players are getting on base and hitting for power

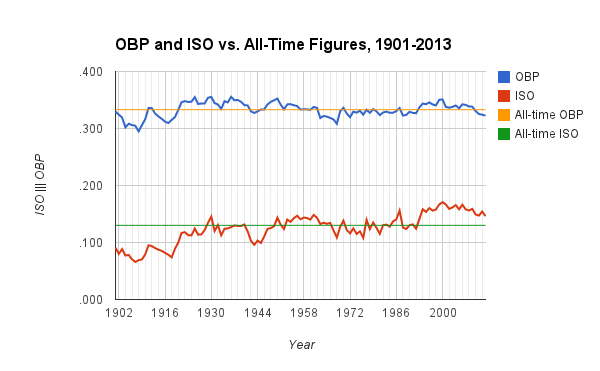
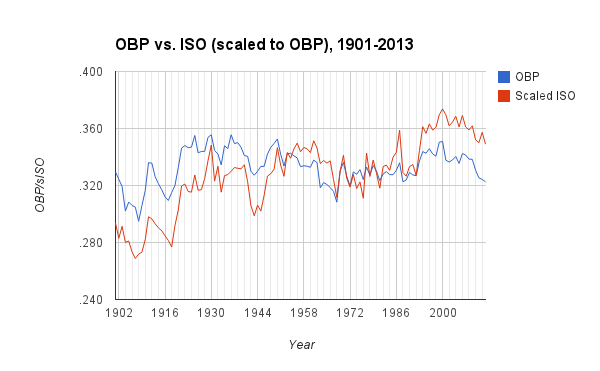
There are some exceptions, but this paradigm mostly holds true. Here’s another depiction of the “eras” involved:

YEAR (AVG)

OBP (.333)

ISO (.130)

1901-18

.316

.081

1919-52

.343

.120

1953-92

.329

.131

1993-present

.338

.158

The periods from 1901-52 and since 1993 really are quite distinct, but the 1953-92 period is the hardest to truly peg and kind of has to be squeezed in there. In fact, those figures are quite close to the historical average. Well, actually, the OBP before 1993 is just as much below the average as the OBP after 1993 is above it. When the same era, categorized by offense, includes both 1968 and 1987, there is going to be some finagling.

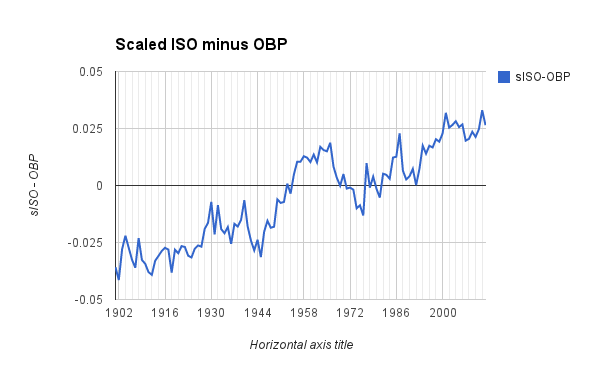
So, really, there hasn’t been a clear period in MLB history with above-average power and below-average on-base percentages, while the “Ruth-Williams Era” (1919-52) had below-average power (again, vs. the historical average) but above-average on-base percentages.

Still, breaking things down into four eras is too simplistic. What follows is a walk-through, not of every season in MLB history, but key seasons, using some of the “metrics” from the first two parts of this series.

1918: .207 XB/TOB, -.038 sISO-OBP, 95 OBP+, 57 ISO+

In 1918, MLB hitters earned .207 extra bases on average. By 1921, they were earning .300 extra bases after year-to-year gains of 19%, 8%, and 12%. How much of this was on account of the Sultan of Swat? In 1918, Babe Ruth was already earning .523 extra bases, but had only 382 plate appearances. In 1921, however, he had 693 plate appearances and averaged .717 extra bases. Without him, the 1918 and 1921 ratios change to .205 and .295, respectively. So he’s only responsible for .003 of the increase. (My guess from a couple weeks ago was way off. He’s still just one player.) Perhaps the effect on the power boom of his individual efforts is overstated. However, his success was clear by 1921, so his influence on how other hitters hit seems properly stated. While Ruth’s 11 HR in 1918 tied Tillie Walker for the MLB lead, five other players had 20+ home runs in 1921.

OBP was low in 1918, and most seasons up to that point, but the dead ball era really was mostly a power vacuum. OBP already had two seasons (1911-12) around the current average, even though it would not get back there until 1920.

1921: .300 XB/TOB, -.027 sISO-OBP, 104 OBP+, 90 ISO+

So we touched on the 1918-21 period moments ago. Power skyrocketed, but still to about 10% below its current norm. Meanwhile, OBP was well on its way to a long above-average stretch: OBP+ was 100 or higher every single year from 1920 through 1941.

1930: .364 XB/TOB, -.007 sISO-OBP, 107 OBP+, 112 ISO+

1930 was the most power-heavy MLB season until 1956 and is even today the second-highest OBP season in MLB history at .35557, just behind the .35561 mark set in 1936. Non-pitchers hit .303/.356/.449 in 1930. Ten players hit 35 or more home runs, including 40+ for Wilson, Ruth, Gehrig and Klein.

Like we’ll see in 1987, however, 1930 was really the peak of a larger trend: XB/TOB grew 6+% for the third straight year before dropping 14% in 1931 and another 12% in 1933 (with a 9% spike in 1932).

1943: .261 XB/TOB, -.028 sISO-OBP, 98 OBP+, 74 ISO+

World War II in general was a bad time for hitters, at least from a power standpoint, with 1943 the worst season among them, but 1945 almost as bad. From 1940-45, the XB/TOB ratio fell 23%. It remained low until 1947. (But even at its lowest point in this time frame in 1942, it was still a better year for power than 1918.) OBP, however, was actually at about its current historical average during the war (within one standard deviation of the mean throughout), so there wasn’t a total offensive collapse. However, it was the first time since the deadball era that OBP+ was below 100. Either way, perhaps the coming look at individual players will tell us what happened.

1953: .365 XB/TOB, .001 sISO-OBP, 103 OBP+, 108 OPS+

Thanks to an 11% increase in XB/TOB, it was finally “easier,” relatively, to hit a double or homer than it was to make it to base in the first place. Also playing a role, however, was the OBP; in 1950 it was only harder to hit for power because players were reaching base at a pretty good clip; the OBP+ and ISO+ that year (1950) were 106 and 110.

1968: .320 XB/TOB, .003 sISO-OBP, 93 OBP+, 84 ISO+

1968 is often considered perhaps the all-time nadir for Major League hitters outside of the dead ball era, and non-pitchers only earned an average of .320 extra bases per time on base that year. It wasn’t just power that suffered, however, although it did, but it was also the worst league-wide OBP in 51 years. In fact, OBP was so low, it was actually ever so slightly easier to hit for power in 1968 than it was to reach base.

The thing about 1968 is that, while 1969 featured a lower mound, no 1.12 ERA’s, and a solid recovery for both OBP and ISO, it didn’t automatically revert baseball hitters to their pre-mid-60s form. Power fluctuated wildly in the roughly 25-year period between 1968-93.

1977: .378 XB/TOB, .010 sISO-OBP, 100 OBP+, 108 ISO+

1977, rather than 1930 or 1987, may be really the flukiest offensive season in MLB history. ISO+ shot up from 83 to 108, after having not been above 96 since 1970. MLB hitters earned 26% more extra bases per times on base than in 1976, easily the biggest one-year increase in MLB history. XB/TOB then promptly decreased 10% in 1978; it’s the only time that figure has gone up 10% in one year and declined 10% the next. It was the only season where sISO was .010 above OBP from 1967-84. 35 players homered 25 times or more, the most in MLB history until 1987. 1977 was a banner year for getting on base as well, although, as usual, not as much as ISO. It was the highest OBP season from 1970-78 and one of four seasons from 1963-92 with an average OBP vs. the historical average.

1987: .416 XB/TOB, .023 sISO-OBP, 101 OBP+, 120 ISO+

1987 has a big reputation as a fluky power season, and players earned .416 extra bases per time on base that year, but that was “only” a 9% spike from the prior season. Additionally, XB/TOB had actually increased every year from 1982-87, except for a 2% drop in 1984. The 1987 season was mostly the peak of a larger trend, which came crashing down in 1988, when the ratio dropped more than 15% to .353 extra bases. The .400 mark would not be broken again until 1994’s .412, but after that point, this ratio would never fall below the 0.400 it was in 1995.

This season was, however, the only one in the Eighties with an OBP+ over 100. From 1963-92, in fact, OBP was at or above the historical norm in just four seasons (1970, 1977, 1979, 1987). As with power, however, OBP collapsed in 1988 more so than it had gained in 1987, falling to 1981 levels (97 OBP+).

1994: .412 XB/TOB, .017 sISO-OBP, 103 OBP+, 122 ISO+

XB/TOB leapt over 10% from 1992-93, and another 9.5% in 1994, ushering in a power era that hasn’t quite yet flamed out. 1994 was the year power really took off relative to OBP: in 1992, sISO and OBP were even; in 1993, the gap was still about half of what it would be in favor of sISO in 1994. 1994 also featured the highest ISO to that point, higher than even in the culmination of the mid-80’s power trend in 1987. While there would be some years between 1993 and 2009 with modest decreases in power, even in 2013, ISO+ was 112–its lowest mark since 1993. More on the current power and OBP environment momentarily.

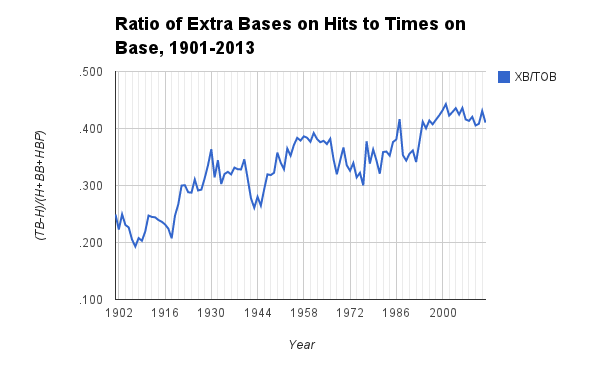
1901-2013: Changes in XB/TOB

Extra bases per time on base was our first choice of metric. How has this particular one changed in certain years?

Overall, nine times has this ratio spiked at least 10% in one season: 1902-03 (+12%), 1918-19 (+19%), 1920-21 (+12%), 1945-46 (+11%), 1949-50 (+10%), 1952-53 (+11%), 1976-77 (+26%), 1981-82 (+12%), and 1992-93 (+10%).

Meanwhile, it decreased by 10 or more percent on six occasions: 1901-02 (-11%), 1930-31 (-14%), 1932-33 (-12%), 1941-42 (-11%), 1977-78 (-10%), 1987-88 (-15%).

2014-???

We’ll try to make this a little more interesting: where is baseball going from here? Can we look at these trends throughout history and determine what the next few years might look like?

XB/TOB dropped 4.8% in 2013. It was the sharpest one-year drop since a 5.6% fall in 1992, but that season only preceded a power boom. Both were modest declines historically, and this one is unlikely to portend much. However, this year’s 112 ISO+ was a new low for the post-strike era.

Yet the bigger issue in 2013 was a stagnant OBP, which has been below the current average since 2009 after being above it every year since 1992. OBP never deviates very much from its norm, but 26/30 seasons from 1963-92 featured a below average OBP.

Will OBP continue to stay low? It has fallen every year since 2006, from .342 to .323, which represents the longest continuous decline in MLB history. It may be unlikely that it decreases further, but the below-average-since-2009 fact is worrisome if you enjoy offense. Stagnation for such a length of time has nearly always been part of a larger trend, mostly in the dead ball era and that 30 year period from 1963-92.

One thing we can probably say is that the “Steroid Era” is over. From 1993-2009, OBP+ was never below 101 and ISO+ never below 109. Take 1993 out of the sample, and ISO+ is never below 118, and from 1996-2009, 14 years, ISO was 20% or more above the historical norm every time.

But since 2009, that 20% threshold has never been reached, although 2012’s ISO+ of 119 comes close. Nonetheless, power from 2010-present has yet to reach mid-90s, early 2000s levels. Power could still increase in the future, but likely for reasons other than PED’s (although the Melky Cabreras and Ryan Brauns of the world always leave a doubt).

If I had to guess, power and home runs are here to stay, even if 2000’s .171 stands as the highest non-pitcher ISO for years to come. (That really is a crazy figure if you think about it: non-pitchers that year hit for power at roughly the career rates of Cal Ripken or Ken Caminiti. In 2013, they were down to more “reasonable” levels similar to Johnny Damon or Barry Larkin.)

The on-base drought is more of a concern for offenses, however, but because OBP is so consistent, that OBP drought could be persistent, but minor.

This concludes the league-wide observations of power and patience. Part IV next week will look at things like “X players with an OBP of Y and ISO of Z in year 19-something.” Part V will then look at individual players. Maybe we can even wrap up with the ones who started this whole series: Joe Mauer, Rickey Henderson, and Wade Boggs. I guess we’ll have to find out.


Power and Patience (Part II of a Study)

Last week’s post ended with a chart comparing power and patience, or, more accurately, league-wide extras bases and times on base (excluding pitchers), year-by-year. Here it is again:

Fig. 1 – No, Not a Fig Leaf

One question this chart does raise, at least to me: does it merely indicate the general effectiveness of offenses, or are there actually times where power goes up relative to getting on base, but offense stagnates or declines? After all, it dipped in 1968 when offense dipped; it increased from 1918-21 as the dead ball era ended; it rose in 1987.

There have been 113 seasons since 1901. Running some R^2 numbers when comparing XB/TOB to various statistics over these 113 seasons gets us some interesting results. I suppose it’s possible than in the year 2514, these stats will correlate better or worse, and that a sample size of 113 seasons is too small. I don’t really have the time to wait and see, though, and I’m fairly sure you don’t either, so:

  • wOBA .0014 (.016 w/pitchers–and for only pitchers, .004)
  • OBP .217 (.083 w/pitchers–and for only pitchers, .006)
  • R/G .246 (.238 w/pitchers)
  • HR/PA .958 (.960 w/pitchers)
  • ISO .968 (.971 w/pitchers)

So, no, we’re not looking at a proxy for overall offense here. But we are looking at a proxy for power itself. The plan here was to investigate the relationship between hitting for power and getting on base through the years. And instead, all we have done with this chart is look at league-wide power proficiency, not even really compared to league-wide getting-on-base proficiency.

Well, there is an alternative explanation, which we will get to.

The good news is, we don’t have to throw away these numbers. We just have to bring OBP and ISO back into the picture, re-separating the two elements of that chart. You can’t really guess a league’s OBP in any given season from ISO, or vice versa, as the R^2 for OBP and ISO is .373:

Fig. 2 – No, Not a Fig Newton

To some, this may indicate a problem with the premise of this series: there’s a solid but not overwhelming correlation between power and patience, it turns out. Well, first, it’s still worth looking into. Part of the reason for that is that is, in smaller sample sizes, there often is more of a correlation: the R^2 between OBP and ISO from 1901-20 is .792; in the last 20 years, it’s .583. Granted, you can mess with the numbers all you want here; for instance, go back 21 years, and suddenly the R^2 between OBP and ISO is .461. Nevertheless, there are brief stretches in baseball where OBP and ISO correlate quite well, and each season is a set of tens of thousands of plate appearances, for what that’s worth. (Little, I know; it just means that the figures for each season were unlikely to change much if the season were longer.)

Also, while they don’t correlate well, or at least well enough that you can predict one from the other, OBP and ISO do correlate pretty well for two independent rate statistics. For example, the R^2 for BB% and K% is .007. There seems to be something to the idea that power threats can get on base more effectively, or that it’s easier to get on base as a power threat. How much is part of the point.

Now for some graphical representations of annual changes in OBP and ISO.

First, here they are on one chart, with the all time figures represented for comparative purposes.

Fig. 3 – Yum, Fig Newtons

Next, we remove the lines representing the all-time marks and then scale ISO to OBP. FIP is scaled to ERA by adding a constant, so we’ll try a similar technique. The all-time OBP, remember from last week, is .333, and the all-time ISO is .130. So, we’re now going to add .203 to each year’s ISO. I call it scaled ISO, or sISO. (I don’t expect this to catch on as anything as it really just has a purpose limited to this series.) Since we’re just adding a constant to ISO, “sISO” and ISO have a perfect correlation, so we’re cool in that regard. Regard:

Fig. 4

The line for “sISO” is the same shape as the line for ISO. (I’m sure this point is patently obvious to some, but perhaps not everyone.) Now we can see really see the seasons ISO was above its all-time norm relative to OBP, so let’s graph those gaps between each line above. Scaled ISO vs. OBP:

Fig. 5 – I Thought It Would Be More Fun For You to Guess the “Horizontal axis title” and That’s My Story and I’m Sticking to It

ISO peeked above OBP in 1953, dipped back below in 1954, and then sharply increased in 1955 and 1956. Before that, however, getting on base was always “easier” vs. the historical norms than hitting for power was. This was true even in the post-Ruth era, with players such as Ruth, Gehrig, Foxx, Ott, and even the beginning of Ted Williams’ career, right up until the end of the Korean War. Actually, league OBP through 1952 was slightly higher, .334, than the current average, while ISO was at .107, still well below the current average.

If baseball ended in 1952 (perish the thought!), the dead ball era would still be a distinct period in baseball history. From 1901-18, league OBP was .316 and ISO .081. From 1919 to 1952, the figures were a .343 OBP and .120 ISO.

Since 1956, power has mostly been above its historical norms relative to OBP, with some exception. Part III will look further into all of this.

Astute observers might have noticed something, though:
   

The R^2 of the figures comprising each chart (sISO-OBP and XB/TOB) is .885.

So, what do we have here, then?

One possible conclusion is still that we’re still only looking at power. But having now observed changes in OBP over time as part of this exercise, perhaps something else is at play. I think there is.

It’s not particularly obvious in the chart that shows OBP vs. its historical average, but OBP, despite what we know about the dead ball era, and other seasons such as 1968, has actually been relatively consistent historically. Even at the hardest time in history for players to reach base, during the dead ball era, it was still much harder to hit for power. When I looked at a sort of OBP+ and ISO+ vs. their historical averages (just using 100*OBP/historical OBP), here were some things:

  • Range: OBP+ 18 (89-107), ISO+ 80 (51-131)
  • Standard Deviation: OBP+ 3.79, ISO+ 19.6

It’s not necessarily that looking at extra bases per times on base, or the arithmetical difference between OBP and ISO, is the same at looking at power. Rather, OBP has been so consistent historically relative to ISO, that the observations in this article are effectively only an observation of ISO, regardless of the specific numbers that go into them. This is a not uninteresting takeaway to me.

Next week, we’ll use four factors–XB/TOB, sISO-OBP, OBP+, and ISO+–to run through the relationship between power and patience throughout baseball history, and maybe even try to look into the future a little bit. Parts IV and V will then bring us back to the beginning of Part I as we return to observing OBP and ISO through the lens of the efforts of individual players. That’s the tentative plan at least.