Archive for January, 2015

What to Make of Clay Buchholz for 2015

Clay Buchholz is probably the hardest pitcher to project (I also waited until the end to write this write-up) because his performances in the past have been so widely inconsistent. To borrow a line from Jason Mastrodonato, “Baseball-reference.com creates comparable player lists based on the numbers, and the players Buchholz is compared to – Rich Harden, Shaun Marcum, Ricky Nolasco, Ian Kennedy and Wade Miller, among others – are perhaps equally talented as they are sporadic.”

So before going down the rabbit hole let’s take a look at his baseline numbers first. From 2008-13 he has a 3.66 ERA. 1.30 WHIP, 17.9% strikeout rate and 9.1% walk rate. Last year he was really bad; last year’s ERA was the highest it’s been since his rookie year in 2008. When asked about his poor numbers not even Buchholz himself was able to identify why.

He was incredibly unlucky last year as his BABIP and strand rate were much than his career norms. It’s easy to say both numbers will positively regress, but there’s a reason why last year’s BABIP was 30 points higher than his career average and the strand rate was nearly ten percentage points lower than his career average.

Let’s take a look at the performance of his pitches (table below). I categorized his pitch types into two categories: Hard and Soft. Hard consists of the fastball, sinker and cutter and Soft consists of the curveball, splitter and changeup.

buchholz-1

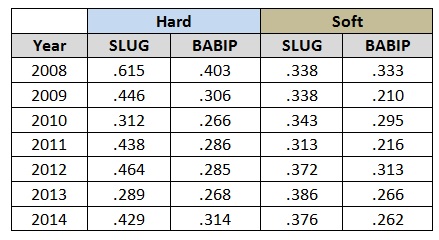
The biggest reason why his BABIP was so high was due to the Hard pitches. Even though the Hard pitches had a high BABIP he didn’t allow a lot of hard contact as evidenced by normal slugging percentage. Let’s take a deeper dive and look at his performance against left-handed and right-handed hitters.

The table below shows his performance throwing Hard pitches against left-handed and right-handed batters.

buchholz-2

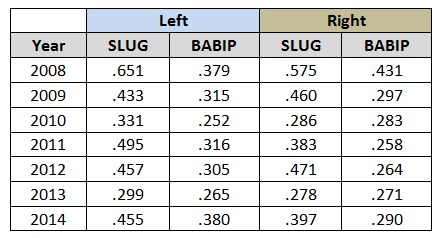
He had huge spike in BABIP against lefties last year, but like the previous table lefties didn’t make a lot of hard contact against him. He also saw an uptick in BABIP against righties too so maybe it was bad pitch location that caused the high BABIP?

The image below shows the percentage of pitches by pitch location for Hard pitches. The three locations are Up, Down or Middle.

buchholz-hard-pitch-location

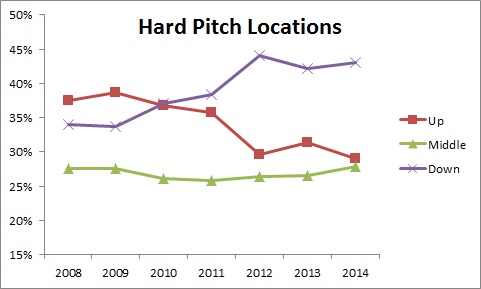
Last year he continued to throw Hard pitches down in the zone so it’s counter-intuitive because keeping the ball down in the zone is one of the most effective ways to be successful. If he kept the ball down then why was his BABIP so high? The table below shows the BABIP of Hard pitches thrown in various locations. Those locations are classified as Up, Middle and Down.

buchholz-3

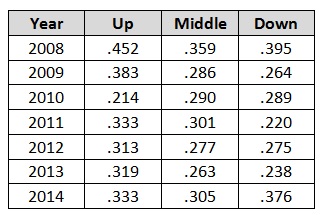
He’s thrown Hard pitches down in the zone at the same clip for the past three seasons, but his BABIP shot up immensely which indicates he was extremely unlucky last year.

Some fantasy owners may say the reason for his poor performance was a decrease in fastball velocity, but his velocity was barely less than 2013 and only one mph less than the 2011 season.

In late September he had surgery to repair a torn meniscus in his right knee, which could have been a factor to his poor performance because it was the same knee that put him on the DL in May. However, when asked Buchholz insisted he was fully healthy.

After looking at all this data I conclude he got unlucky with the BABIP and if he continues to throw Hard pitches down in the zone he should be very successful next season. The big question is how successful?

Last year he posted the lowest walk rate of his career while continuing to throw Hard pitches down in the strike zone. If he’s able to continue both trends and the BABIP positively regresses he could have an ERA in the 3.40-3.50 range with a sub 1.29 WHIP. Injuries are always going to be a concern for Buchholz (he’s never pitched more than 190 innings in a regular season), but he has tremendous upside. The infield defense should be very good and he’ll likely be pitching with a lot of runs on the board. His ADP will likely be suppressed so fantasy owners will likely be able to draft him at a substantial discount. I’m going to take a chance on him and so should you.


The Johnny Cueto Experience

Johnny Cueto was very good in 2014. By traditional metrics, he was excellent: 20 wins, 242 strikeouts in 243 2/3 innings, a 2.25 ERA and 0.96 WHIP. By more advanced metrics, he was good but not quite that good: 3.30 FIP, 3.21 xFIP, 3.15 SIERA. Per FanGraphs, Cueto had 4.1 WAR, ranking him 14th among pitchers. Baseball-Reference had Cueto with 6.4 WAR, which placed him 6th among pitchers. No matter how you look at it, Johnny Cueto was good in 2014.

Johnny Cueto threw 3659 pitches during the regular season last year, making him one of only six pitchers to throw 3500 or more pitches. [NOTE: for this article, I’m only using major league regular season pitches thrown.] Cueto is not a big guy for a pitcher. He’s listed at 5’11, 215. The other five pitchers to throw 3500 or more pitches last year were David Price (6’6”, 220), Corey Kluber (6’4”, 215), James Shields (6’3”, 215), Max Scherzer (6’3”, 220), and R.A. Dickey (6’3”, 215). Of these six pitchers, Cueto had the greatest increase in pitches thrown from the previous year.

So, based on his high pitch total last year and low pitch total the year before, should we be worried about Johnny Cueto in 2015?

Let’s start with the high pitch total. Using the Baseball-Reference Play Index and the FanGraphs Leaderboards, I gathered some information. The following chart shows the number of pitchers who threw 3500 or more pitches each year going back to 2000, along with the average number of pitches thrown per pitcher in their high-pitch year, the average number of pitches thrown by those same pitchers in the following year, and the difference between the two.

YEAR N

# of Pitchers
>3500 pitches

Avg Pitches
Year N

Avg Pitches
Year N+1

Difference
(N+1)-N

2000

15

3664

3202

-462

2001

17

3617

3213

-404

2002

13

3614

3028

-586

2003

9

3609

3132

-477

2004

8

3651

3332

-319

2005

8

3679

3390

-289

2006

7

3648

3437

-211

2007

8

3606

3175

-431

2008

8

3624

3254

-370

2009

6

3646

3499

-147

2010

13

3621

3514

-107

2011

11

3661

2965

-696

2012

2

3693

3675

-18

2013

6

3600

3402

-198

TOTAL

131

3635

3256

-379


As you might expect, pitchers who throw 3500 or more pitches one year are likely to throw fewer pitches the following year. That’s the nature of regression to the mean. To throw 3500 pitches, a pitcher is likely to be having a good, healthy season. Things happen in baseball and it’s difficult for any group of pitchers to have back-to-back good, healthy seasons. Some are going to get injured and some are going to pitch worse and pitch less. In this case, the average difference was 379 pitches. Over the last fourteen years, pitchers who throw 3500 or more pitches one season have averaged 379 fewer pitches the following season. These days, 379 pitches is about 3 or 4 starts.

What about performance following a 3500-plus pitch season? The following chart shows how pitchers who threw 3500 or more pitches in one season performed in the following season.

Years Pitchers
>3500 pitches
Better
ERA+
Worse
ERA+
Better
K%
Worse
K%
Better
BB%
Worse
BB%
2000-2013 131 42% 58% 37% 63% 52% 47%


Once again, keeping in mind regression to the mean, it’s not surprising to see that these pitchers were worse the following season. Looking at ERA+, 58% of these pitchers were worse in the year following their high pitch total year. The majority (63%) also had lower strikeout rates, but improved walk rates (52% improved their walk rate in the year after their high pitch year).

More specifically, the following chart shows the difference in innings pitched (IP) and runs allowed per 9 innings (RA/9):

Years Year N
AVG IP
Year N+1
AVG IP
DIFF Year N
RA/9
Year N+1
RA/9
DIFF
2000-2013 228 205 -23 3.87 4.08 +0.21


Over the last fourteen years, pitchers who threw 3500 or more pitches in one year averaged 228 innings pitched that year. In the following year, they dropped to 205 innings pitched, a difference of 23 innings (this matches up well with the 379 fewer pitches thrown). In their high pitch count year, these pitchers had an RA/9 of 3.87. The following year, their RA/9 went up to 4.08, an increase of 0.21 RA/9.

Is this bad news for Johnny Cueto and the other five pitchers who threw more than 3500 pitches in 2014? Not really. I’ve mentioned regression to the mean a couple times. Based on regression, we would expect these pitchers to pitch fewer innings and have a higher RA/9.

With this in mind, here is a look at these 131 pitchers and their innings pitched and RA/9 in the year after they threw 3500 or more pitches compared to their Marcel projections for that year. Thanks to The Baseball Projection Project, I was able to find Marcel projections going back to 2001. The following chart shows each pitcher’s next-year Marcel projection for innings pitched and RA/9, along with each pitcher’s next-year actual innings pitched and RA/9.

Years Year N+1
Marcel
proj. IP
Year N+1
AVG IP
DIFF Year N+1
Marcel proj. RA/9
Year N+1
RA/9
DIFF
2000-2013 194 205 +11 4.05 4.07 +0.02


Over the last fourteen years, pitchers who threw 3500 or more pitches in a season were projected by Marcel to pitch 194 innings the following season. They actually pitched 205 innings in that following season, for an increase of 11 innings over their Marcel projection.

When it comes to performance, we find that these pitchers averaged a 3.87 RA/9 in their high pitch total season and were projected by Marcel for a 4.05 RA/9 for the following season. They actually had a 4.07 RA/9 in the following season. It’s a very slight increase of 0.02 RA/9, which shouldn’t be anything to worry about, really.

So it would appear that throwing 3500 pitches in one season should not be a big cause for alarm. The pitchers who have done this recently did not perform any worse than their projections would have expected.

With Cueto, though, there was that other thing that worried me—his large increase in pitches thrown from 2013 (953 pitches thrown) to 2014 (3659 pitches thrown).

With this in mind, I looked at the 131 pitchers in this study to find the pitchers who had the largest increase in pitches thrown from one year to the next. I set the limit at no more than 2000 pitches thrown in the year prior to that pitcher’s 3500-plus pitch season. There were only 10 pitchers, including Cueto, who threw fewer than 2000 pitches in one season and more than 3500 pitches the next season. That screams “small sample size!”

Unfortunately, there is a problem with even this group of comparable pitchers—they aren’t very good matches for the Johnny Cueto Experience. For example, one of them was Barry Zito. Zito only had 92 2/3 innings in the major leagues in 2000, the year before he threw more than 3500 pitches, but he also pitched 101 2/3 minor league innings that year, so there really wasn’t a big increase in the number of pitches thrown from one year to the next. He gets eliminated. The same is true for Steve Sparks, Roy Halladay, Randy Johnson, Noah Lowry, and Adam Wainwright, all of whom had additional minor league innings that would push them over the 2000 pitch limit. Unfortunately, that leaves very little to work with—just three pitchers (Woody Williams, Roy Oswalt, and Chris Capuano).

Pitchers Year N
AVG IP
Year N+1
Marcels
AVG IP
Year N+1
AVG IP
Year N
RA/9
Year N+1
Marcels RA/9
Year N+1
RA/9
Williams/Oswalt/Capuano 226 182 217 4.07 4.18 3.95


These three pitchers did throw fewer innings in the year after their 3500-plus pitch year, but to a lesser degree than the group as a whole and they pitched more innings than projected by Marcel. Also, this group actually improved their RA/9 in the year after their 3500-plus pitch year and were much better than their Marcel projection.

Based on throwing 3500 or more pitches, it doesn’t appear there’s anything to worry about with Cueto. Based on such a large increase in pitches thrown from one year to the next, we don’t really know because there just haven’t been many pitchers allowed to do that over the last 14 years. My gut still tells me to be wary but the numbers don’t see a problem.


Which Center Fielders Made the Plays that Mattered Most?

Jeff Zimmerman posted an interesting article on Friday. It prompted me to try to analyze the relationship between (i) an outfielder’s ability to make plays, and (ii) an outfielder’s ability to save runs. From my analysis below, the relationship is not as hand-in-glove as I initially would have thought.

From what I understood about Jeff’s article, he advanced a new defensive metric called “PMR,” which stands for Plays Made Ratio. Jeff calculated this ratio using data from Inside Edge, which categorizes every ball in play into one of six buckets. Jeff explains:

Most of the fielding data falls into two categories. The zero percentage plays are just that, impossible plays, and make up 23.2% of all the balls in play. Balls in this bucket are never caught and always have a 0% value. The other major range is the Routine Plays or the 90% to 100% bin. Defenders make outs on 97.9% of these plays, which make up 64.0% of all the plays in the field; the 2.1% which aren’t made are mostly errors. In total, 87.2% of all plays are graded out as either automatic hits or outs; it is the final ~13% which really determine if a defender is above or below average.

Between almost always and never, four categories remain. Even though each category has a defined range, like 40% to 60%, the average amount of plays made is not exactly in the middle of each range. Here are the actual percentage of plays made in each of the four ranges.

Range

Actual Percentage

1% to 10%

6%

10% to 40%

29%

40% to 60%

58%

60% to 90%

81%

With these league average values and each individual player’s values, a ratio of number of plays made compared to the league average value can be calculated. To have the same output of stats like FIP- and wRC+, I put Plays Made Ratio on a 100 scale where a value like 125 is 25% better than the league average. Here is the long form formula and Jason Heyward’s value determined for an example.

Plays Made Ratio = ((Plays made from 1% to 90%)/((1% to 10% chances * .063%)+( 10% to 40% chances * .289)+ (40% to 60% chances * .576) + (60% to 90% chances * .805))) * 100

Heyward’s Plays Made Ratio = ((1+10+9+26)/((14*.063)+(16*.289)+(9*.576)+(27*.805)))*100

Heyward’s Plays Made Ratio = (46/32.4)*100

Heyward’s Plays Made Ratio = 142

Heyward had a heck of a season. Of the 66 playable balls hit to him, normally only 32 of them would have been caught for an out. Heyward was able to get to 46 of them, or 42% better than the league average. He has consistently had above league average values with a 133 value in 2012 and 125 in 2013.

Jeff posits that the new PFM metric gives us new insight that FanGraphs current go-to defensive metric (Ultimate Zone Rating) does not:

Now remember this stat [PMR] only looks at how often a fielder would have made the play considering their position on the field. The team could be playing its outfielders back to prevent a double or their infielders in for a bunt which could put the defender out of position. Additionally, it doesn’t look at the final results of the play (at least for now). If Sir Dive Alot is playing in the outfield and he loves to try to catch every ball hit his way, then he will get to a few extra flyballs by diving all the time, but those he doesn’t get to will pass him by for more doubles and triples. Also, an outfielder could be good at making plays while coming in versus going deep; balls which fall in over his head would be more damaging than those which fall for shallow singles. While his Plays Made Ratio may be high, the number of runs he saves, as seen by UZR or Defensive Runs Saved, may be lower by comparison.

This got me thinking about the relationship between a player’s PMR and his UZR, and, more specifically, his RngR. As I understand RngR, it is the component of UZR that estimates the number of runs a player saves, or surrenders, due to his range. RngR isolates the contribution a player’s range makes to his Ultimate Zone Rating by ignoring the contributions from his arm and his ability to limit errors.

Intuitively, it would make sense that a player’s PMR and his RngR would be strongly correlated. In other words, a player whose range allows him to make more plays than average would also be the same type of player whose range would allow him to save more runs than average. A simple two-by-two matrix, with RngR along the left side and PMR along the top would show the following quadrants:

Below Average PMR Above Average PMR
Above Average RngR (1) Poor range/saves runs(?) (2) Good range/saves runs
Below Average RngR (3) Poor range/surrenders runs (4) Good range/surrenders runs(?)

My intuition is that players would fall in either quadrant (2) or quadrant (3). The interesting questions arise with players that would fall in quadrant (1) (those who exhibit poor range, but whose range saves runs), and in quadrant (4) (those who exhibit good range, but whose range does not save runs). There are several explanations for why a player may fall into quadrant (1) or (4).

Jeff noted three possible explanations.  First, a player may be overly aggressive, which would may lead to more outs (a higher PMR) but also more misplays resulting in doubles and triples (a lower RngR). Second, “an outfielder could be good at making plays while coming in versus going deep; balls which fall in over his head would be more damaging than those which fall for shallow singles. While his Plays Made Ratio may be high, the number of runs he saves, as seen by UZR or Defensive Runs Saved, may be lower by comparison.” Third, a player (or his team) may be particularly well adept at positioning himself, which would amplify his RngR rating, but not necessarily his PMR (as Jeff noted when discussing Nick Markakis).

How does the relationship between PMR and RngR look if it is applied to actual players? To find out, I looked at all center fielders who between 2012 and 2014 had at least 70 “total chances” (defined by Inside Edge as balls hit to that fielder where there is between a 1% and 90% likelihood that the ball is caught). That provided me a list of 18 center fielders. Next, I calculated each player’s rate-based RngR/150 (calculated by his total RngR divided by the innings he played in center field, multiplied by nine, multiplied by 150). That revealed the following table:

Name PMR RngR/150
Jacoby Ellsbury 128 11.5
Lorenzo Cain 127 19.5
Mike Trout 126 3.9
Michael Bourn 122 4.4
Ben Revere 122 -3.0
Andrew McCutchen 120 -1.5
Denard Span 116 4.0
Carlos Gomez 114 11.2
Dexter Fowler 114 -12.0
Juan Lagares 108 18.7
Coco Crisp 106 -2.3
Jon Jay 105 3.2
Adam Jones 90 -5.7
Leonys Martin 89 0.6
Austin Jackson 88 -1.2
Colby Rasmus 87 2.7
Angel Pagan 87 -2.4
B.J. Upton 80 -0.6

A scatter chart of this information looks like this. I also added a best-fit line to the scatter plot. My intuition that a player’s RngR/150 would be strongly correlated with his PMR is contradicted by this data. In fact, according to this data, (and based on my very limited skillset at statistical analysis, which may be completely incorrect), only 15% of the runs saved due to these 18 center fielders’ range can be explained by their Plays Made Ratio.

Even more interesting than the two-by-two matrix characterization introduced above, are the points on the scatter plot that are either way above (Juan Lagares and Lorenzo Cain) and way below (Dexter Fowler) the linear trendline.

The data suggest that Lagares/Cain and Fowler have similar range in center field, but that the former use their range to save more runs than the latter. One possible implication of this information is that Fowler is not optimizing his ability and that through better decision-making (such as being more aggressive or less aggressive on fly balls) or better positioning he could save more runs. As discussed earlier, it could also mean that Fowler is not (relatively) adept at playing balls hit over his head or in the gap, which leads to more doubles and triples.

On a larger scale, a possible implication of this data is that teams could significantly improve the amount of runs their center fielders save by (i) coaching their center fielders to make optimal decisions regarding their aggressiveness and (ii) properly positioning their center fielders. I would be curious to analyze what is the optimal amount of aggression a center fielder would have in going after balls hit to the outfield, the optimal way to position himself. For example, is it better to play shallow and be aggressive in cutting off singles (which Lagares has a reputation of doing) or to play deep? Those questions are best answered in a follow-up post/article.


The Future is Bright, But Will the A’s Compete in 2015?

The Oakland Athletics may have finally completed their roster turnover on Wednesday with their most recent deal sending Yunel Escobar to Washington for RP Tyler Clippard. However, you can never know if Billy Beane is finished making moves. With that being said, I’d like to break down the roster from last year to this year and assess whether or not the team will actually regress in 2015. The fact is that the Athletics got quite a bit younger this offseason and acquired many players with a lot of team control remaining. The distant future appears brighter now than it did prior to this offseason, but the main question is, will the Athletics be able to compete in 2015 as well as they would have prior to the roster turnover? Lets take a look at the numbers:

STARTING LINEUP

I will start by comparing the most common nine players in the A’s lineup last year to their projected starting nine this year, using WAR and wRC+:

[All stats give on the chart will represent the 2014 season in the MLB only. In further commentary I may bring up career numbers or minor league numbers for some players.]

2014 WAR wRC+ 2015 WAR wRC+
C – Derek Norris 2.5 122 C – Stephen Vogt 1.3 114
1B – Brandon Moss 2.3 121 1B – Ike Davis 0.3 108
2B – Eric Sogard 0.3 67 2B – Ben Zobrist 5.7 119
3B – Josh Donaldson 6.4 129 3B – Brett Lawrie 1.7 101
SS – Jed Lowrie 1.8 93 SS – Marcus Semien 0.6 88
LF – Yoenis Cespedes 3.4 109 LF – Sam Fuld 2.8 90
CF – Coco Crisp 0.9 103 CF – Coco Crisp 0.9 103
RF – Josh Reddick 2.3 117 RF – Josh Reddick 2.3 117
DH – Alberto Callaspo -1.1 68 DH – Billy Butler -0.3 97

2014 AVG WAR = 2.1 / Total wRC+ = 929

2015 AVG WAR = 1.7 / Total wRC+ = 937

As shocking as it may seem, this displays that the A’s should in fact score more runs with their lineup in 2015 than they did with Donaldson, Moss and Cespedes in the heart of their lineup last season. Although, this chart only accounts for 2014 stats, in which Billy Butler (among others) had an off year. If the A’s can get him back to, or even near his 2012 form, in which his WAR was 2.9 and his wRC+ was 139, they could be in for a significant upgrade on offense as a whole. One of the reasons why this lineup has the potential to be more successful even after losing a guy like Donaldson is because of the acquisition of Ben Zobrist. While Brett Lawrie is -4.7 to Donaldson in WAR and -28 to Donaldson in wRC+, Zobrist is +5.4 to Sogard in WAR and +52 to Sogard in wRC+, more than making up for the loss of Donaldson. While the A’s did use a lot of other DH besides Callaspo in 2014, he totaled the greatest amount of plate appearances from that spot, which might lower the 2014 numbers a little.

The average WAR is down slightly from last season, but with Stephen Vogt behind the plate and Marcus Semien most likely getting the every day job at SS, the A’s feel they are upgrading defensively. Semien’s numbers represent his slim 255 plate appearances in the majors last season, but in TripleA his wRC+ was 142. You cannot expect that out of Semien at the major league level, but it shows that he has potential to improve in 2015. The A’s did use a lot of players at each position last season and they will again in 2015; that is why it is important to also take a look at the bench players from last year and the projected bench for this year.

BENCH

While the 25-man roster is not set in stone for 2015 just yet, here is last year’s most commonly used bench players versus next year’s projected bench.

2014 WAR wRC+ 2015 WAR wRC+
Nick Punto 0.2 73 Craig Gentry 1.4 77
Craig Gentry 1.4 77 Josh Phegley 0.2 92 – 132(AAA)
John Jaso 1.5 121 Eric Sogard 0.3 67
Sam Fuld 1.3 73 Mark Canha N/A 131(AAA)

2014 AVG WAR = 1.1 / TOTAL wRC+ = 344

2015 AVG WAR = .48 / TOTAL wRC+ = 367(407)

While these numbers are a bit skewed due to the fact that Canha has not yet reached the majors and also because Jaso was actually a starter while he was healthy, they do give a good idea of what to expect in 2015. Sogard takes over for Punto as the reserve infielder. Fuld and Gentry will most likely platoon in LF, same goes for Vogt and Phegley at C. Since Fuld and Vogt are LH, they will see more time in the starting lineup, leaving Gentry and Phegley on the list of bench players for 2015. Gentry and Phegley will see most their time against lefties, which will likely help their overall numbers. The A’s always do a great job shifting their lineup to create the match ups they want, expect more of the same with platoons and late pinch hitting in 2015.

STARTING ROTATION

The starting rotation is an area where a lot of people say they A’s have question marks. This may be due to the fact that they lost Jon Lester and Jason Hammel to free agency and traded away Jeff Samardzija to the White Sox earlier this off season. However, the A’s held the best record in baseball for months in 2014 with a rotation featuring Sonny Gray, Scott Kazmir, Jesse Chavez, Drew Pomeranz and Tommy Milone. Four of those guys will be returning in 2015, with a slew of other young arms fighting for a spot in the rotation. Anyone from Chris Bassitt, Jesse Hahn, Sean Nolin or Kendall Graveman would be an upgrade or at worst an equal replacement of Milone. Let’s take a look at the numbers for the five players who started the most games for the Athletics last season VS the A’s projected rotation for next season using ERA, WHIP and WAR from the 2014 season:

2014 ERA WHIP WAR 2015 ERA WHIP WAR
Sonny Gray 3.08 1.19 3.3 Sonny Gray 3.08 1.19 3.3
Scott Kazmir 3.55 1.16 3.3 Scott Kazmir 3.55 1.16 3.3
Jesse Chavez 3.44 1.30 1.7 Jesse Hahn 2.96 1.13 0.8
Jeff Samardzija 2.99 1.07 4.1 Jesse Chavez 3.44 1.30 1.7
Tommy Milone 4.23 1.40 0.4 Drew Pomeranz 2.58 1.13 0.7

2014 AVG: ERA = 3.46 / WHIP = 1.22 / Avg WAR = 2.56

2015 AVG: ERA = 3.12 / WHIP = 1.18 / WAR = 1.96

Keep in mind that ERA and WHIP are better when they are lower and WAR is better if it is higher. While this list does not consist of Jon Lester, the A’s were at their best when they still had Chavez and Milone in their rotation. Also, it was a small sample size for Pomeranz, so we cannot expect numbers quite that solid again in 2015. However, with all that being said, the A’s, despite losing All-Stars, should not take more than a tiny step back in 2015. This rotation is still very solid and is in fact younger this year than last. Not only that, the A’s now have a lot more depth with three other pitchers not on this list that could fill a rotation spot, Chris Bassit, Sean Nolin and Kendall Graveman. Also, we cannot forget about the Tommy John rehabbers Jarrod Parker and AJ Griffin, who could make their way back into this rotation before the All-Star break. Both Parker and Griffin were huge contributors to the A’s success in both 2012 and 2013.

BULLPEN

There are a lot of similar faces coming back to the Athletics’ bullpen in 2015. So, instead of continuing with the format I’ve used for position players and the starting rotation I’m quickly going to compare Luke Gregerson and Tyler Clippard, the one main difference in the bullpen for 2015.

Player ERA / WHIP / WAR

Luke Gregerson 2.12 / 1.01 / 0.9

Tyler Clippard 2.18 / 1.00 / 1.5

These numbers are very similar, making Clippard a perfect replacement for Gregerson, taking over the 8th inning duties in front of incumbent closer Sean Doolittle. I don’t think many people expected the A’s to make a move to acquire another back end of the bullpen piece. Even after losing Gregerson, they seemed to have a very solid bullpen, but now it is even more solidified with a proven set-up man in Tyler Clippard. Another important thing to note about Clippard is his ability to create fly balls. His FB% in 2014 was 49.4% also, his IFFB% was 19.3% and that will likely increase mightily with him now pitching in Oakland. He is the perfect pitcher for the o.Co Coliseum. The A’s will pay Clippard more than they would have paid Escobar in 2015, but they are saving money in the long run due to the fact the Escobar is owed 14 million over the next two seasons and Clippard becomes a free agent after this season (in which he will make around 9 million).

Now let’s take a look at 12 potential options for the Athletics bullpen in 2015. Some of them are locks, but the others will either gain a spot due to the fact that they did not make it into the rotation or if they have a solid showing in spring training.

Name Team (2014) IP ERA WHIP WAR
Sean Doolittle Athletics 62.2 2.73 0.73 2.4
Tyler Clippard Nationals 70.1 2.18 1 1.5
Dan Otero Athletics 86.2 2.28 1.1 0.7
Chris Bassitt White Sox 29.2 3.94 1.58 0.7
Fernando Abad Athletics 57.1 1.57 0.85 0.6
Ryan Cook Athletics 50 3.42 1.08 0.3
Eury De la Rosa Diamondbacks 36.2 2.95 1.39 0.2
R.J. Alvarez Padres 8 1.13 1 0
Kendall Graveman Blue Jays (AAA) 38.1 1.88 1.02 N/A
Sean Nolin Blue Jays (AAA) 87.1 3.5 1.25 N/A
Eric O’Flaherty Athletics 20 2.25 0.95 -0.1
Evan Scribner Athletics 11.2 4.63 0.94 -0.2

There are a lot of very solid options for the A’s bullpen in 2015. I’d expect to see, Doolittle, Clippard, O’Flaherty, Cook, Otero and Abad for sure, but I expect all of these guys to make an impact at some point, if not this season then in 2016.

TAKEAWAY

The Athletics have a very deep pitching staff. With Sonny Gray and Scott Kazmir headlining the rotation, they have a plethora of options to fill the remaining three spots. Pomeranz, Hahn and Chavez look to be the leading candidates, although Billy Beane himself has mentioned Kendall Graveman as someone he sees making the rotation out of spring training. The A’s also have a very strong bullpen, especially after the recent acquisition of All-Star set-up man Tyler Clippard. After losing Josh Donaldson, Brandon Moss, Yoenis Cespedes and Derek Norris (four All-Stars), the A’s lineup for 2015, according to wRC+ actually got better. It’s not always the big name All-Stars that make a team successful. Oakland has proven this many times in the past, most recently in 2012, right after an offseason makeover similar to this year’s. The one piece that has remained since before the 2012 makeover and after this 2015 makeover, is Coco Crisp. There cannot be enough said about the value of Crisp to the A’s organization. With Crisp healthy in CF and the newly acquired pieces filling in around him, I expect the A’s to be back competing for another American League West division title in 2015.


What Can Nathan Eovaldi Learn from Brandon McCarthy?

Brandon McCarthy got off to a rough start in 2014 with the Arizona Diamondbacks. Between the atrocious ERA (5.01) and the seemingly endless supply of baseballs leaving the yard (HR/FB rate of 20%), the D’Backs cut their losses and dealt McCarthy to the Yankees in early July for Vidal Nuno. What the Yankees saw was a pitcher who was terribly unlucky and just needed a little more time for variance to run its course. Well, and maybe a few things that needed adjusting.

McCarthy was among the league leaders in BABIP at the time of the trade with a .345 mark, and many seemed to think this number had to come down. BABIP after all is pretty volatile, and takes several years to stabilize, so we can expect a large amount of variance in a time period as short as a few months. The real questions are: how deserving was McCarthy of an inflated BABIP? Are there tendencies that make some pitchers more prone to higher rates than others? What can teams do to fix higher BABIPs?

First, let’s take a look at McCarthy’s zone profiles in 2014 before being traded.

No wonder hitters were teeing off against McCarthy; lefties saw plenty of offerings over the middle of the plate while righties were exclusively pitched low-and-away. Hitters could walk up to the plate with confidence knowing they’d either get a pitch in their wheelhouse or only in a few spots. This took any advantage of unpredictability out of the hands of McCarthy and subjected him to a higher than average BABIP.

Now, let’s look at how they changed after being dealt.

After coming over to New York, McCarthy looks like a completely different pitcher. The biggest changes appear to be throwing inside on right handed hitters and keeping the ball away from left handed hitters. His new found ability to mix up his locations helped keep hitters off-balance.

As for McCarthy’s pitch selection before and after the trade, that changed as well.

Left Handed Hitters

Month Fourseam Sinker Cutter Curve Change
4/14 5.60 45.60 26.40 22.40 0.00
5/14 9.26 50.74 18.52 18.89 2.59
6/14 12.00 46.80 6.00 29.20 5.60
7/14 11.92 47.69 18.46 21.92 0.00
8/14 25.38 23.24 25.38 25.69 0.00
9/14 32.02 18.72 19.21 30.05 0.00

Right Handed Hitters

Month Fourseam Sinker Cutter Curve
4/14 2.29 66.06 6.88 23.85
5/14 5.06 61.60 3.80 29.54
6/14 8.70 55.56 3.38 32.37
7/14 21.74 46.64 15.42 15.81
8/14 24.35 43.91 13.65 18.08
9/14 24.61 45.55 10.47 19.37

Left handed hitters saw a dramatic increase in four-seamers, with the sinker, cutter, and curve all being mixed in rather evenly. Righties also saw a drift away from the sinker and a more even distribution of pitches. The result was a modest .307 BABIP from July onwards. This all makes me wonder if the Yankees have found a market inefficiency — pitchers with an excellent skill set, an inflated BABIP, and zone profiles plus pitch arsenals that were all too predictable. Alter the sequencing to fix the pitcher, and you’ll see the outcomes line up more accurately with the underlying skill set.

Well, if they did it once, can they do it again? Or at least try to?

Enter Nathan Eovaldi. Eovaldi has impressed scouts for years with a blazing mid-90’s fastball. Unfortunately, the results haven’t matched his potential. Like McCarthy, Eovaldi was marred by the same tendencies- an inflated BABIP (.323) with an ERA that’s well above his FIP (4.37 vs 3.37), but he had an impressive walk rate (1.94 BB/9). His zone profiles provide some insight as well:

Eovaldi pitched almost exclusively down-and-away to right handed hitters in 2014, much like McCarthy before coming over to New York. Left handed hitters saw a buffet of pitches in the bottom half of the zone, with a high percentage coming low-and-in.  Eovaldi’s pitch usage was rather predictable as well.

Left Handed Hitters

Month Fourseam Sinker Curve Slider Change
4/14 65.86 0.60 10.88 18.73 3.93
5/14 58.63 0.00 10.42 21.82 9.12
6/14 64.11 0.27 15.34 15.62 4.66
7/14 60.43 2.13 14.89 15.74 6.81
8/14 63.64 2.69 17.85 14.81 1.01
9/14 56.70 1.55 23.71 9.28 8.76

Right Handed Hitters

Month Fourseam Sinker Curve Slider Change
4/14 62.40 2.33 1.55 32.95 0.78
5/14 66.35 0.00 0.00 33.65 0.00
6/14 57.33 0.00 1.33 40.89 0.44
7/14 59.66 1.72 3.00 35.62 0.00
8/14 64.93 0.00 1.87 33.21 0.00
9/14 55.16 3.14 7.62 33.18 0.90

Eovaldi features a fastball, slider and curve against LHH and only a fastball and slider against RHH. This would help explain his higher-than-normal BABIP — he’s just too predictable. Hitters known they can wait on 1 or 2 pitches in a general area and have good chance of guessing correctly. While Eovaldi didn’t have as wide of a pitch selection to choose from as McCarthy, I’m willing to bet the Yankees work with him to change this. I’m thinking that we see either a new pitch all together, or perhaps he works with pitching coach Larry Rothschild on his sinker and/or change. These adjustments plus more variance in the pitch location department could make a world of difference for Nathan Eovaldi in 2015.


The Contours of the Steroid Era

One of the things I enjoy most about FanGraphs Community–really, I’m not just apple polishing here–is the quality of the comments. After I came up dry trying to explain the increase in hit batters to near-historical levels in recent years, a commenter led me to what I feel is the correct path: Batters are more likely to be hit when the pitcher’s ahead on the count (and thereby more likely to work the edges of the strike zone, where a miss inside may hit the batter), and the steady increase in strikeouts has yielded an increase in pitchers’ counts on which batters get hit. Similarly, on December 30, when I wrote about how larger pitching staffs have adversely affected the performance of designated hitters, I got this smart comment from Jon L., reacting to my contention that the relative (not absolute) rise in DH offensive performance (measured by OPS+) from 1994 to 2007 probably wasn’t related to PEDs because the improvement was relative to increasing offensive levels overall:

I think it was clearly a PED thing. Players were able to build strength and muscle mass to enhance hitting prowess, and were willing to take the hit on baserunning and agility that comes with toting more weight around. And why not? The money’s in hitting. PEDs were more appealing to players with some initial level of slugging ability, and disproportionately benefited DH-type skills.

That made me think about the Steroid Era (or the PED Era, or, as Joe Posnanski put it, the Selig Era). Generally, I avoid this issue. I listen to SiriusXM in my car, and when I’m on MLB Network Radio and the discussion turns to PEDs, I change the station. I’ve had enough of it for this life, and of course it’ll keep going into overdrive every year around this time with all the Hall of Fame posturing. And, of course, there are commentators like Joe Sheehan who attribute the change in offense since drug testing was instituted to changes in contact rate rather than, as he calls them, “sports drugs.” I’m not making a call on any of that here.

But Jon L.’s comment made me look at the era in a different light. As I noted in my piece, between 1994 and 2007, the average OPS+ for designated hitters was 109. Prior to that, it was 104, and since then, it’s been 106. Those 14 years between 1994 and 2007 represent the high-water mark for DH offense. both absolutely and relatively. In the 42 years in which the American League has had a designated hitter, there have been 28 seasons in which the OPS+ for DHs was 105 or higher: Every season from 1994 to 2007, but just half of the remaining 28 years.

So I’m going to start with the years 1994-2007 as my definition of the Steroid Era. I’m not saying they’re the right answer. They do fit in with the record for DHs, and I’d note that those fourteen years account for 23 of the 43 player-seasons, and 14 of the 23 players, hitting 50+ home runs in a season. (And that doesn’t include 1994, when six players–Matt Williams, Ken Griffey Jr., Jeff Bagwell, Frank Thomas, Barry Bonds, and Albert Belle–were on pace for 50+ when the strike ended the season.) But maybe the Steroid Era started, as Rob Neyer recently suggested, in 1987, following Jose Canseco’s Rookie of the Year season. That’s the same starting point the Eno Sarris points to in this article from 2013. Maybe it ended in 2003, the last year before drug testing commenced. I’ll get to that later.

To test Jon L.’s hypothesis, I looked at Bill James’s Defensive Spectrum, which puts defensive positions along a continuum:

DH – 1B – LF – RF – 3B – CF – 2B – SS – C

For purposes of this analysis, let’s just say that the defensive spectrum rates positions as offense-first through defense-first. (It’s more nuanced, having to do with the availability of talent, but that’s not important here.) DHs, obviously, are asked only to hit, not to field. On the other end of the spectrum, players like Clint Barmes and Jose Molina get paid for the glove, not their bat.

For each position, I looked at their relative hitting (measured by OPS+, the only relative metric I could find with positional splits going back to the implementation of the DH). Obviously, overall offense increased across baseball during the Steroid Era. That’s not at issue. Rather, I’m looking for the contours of the increase: Did some types of players benefit more than others? That’s the beauty of relative statistics. Since they average to 100 overall, they’re effectively a zero-sum game. In pretty much identical playing time, Justin Upton’s OPS+ improved from 124 in 2013 to 132 in 2014. That means that the rest of his league, in aggregate, lost 8 points of OPS+ over Upton’s 642 or so plate appearances from 2013 to 2014. Taking that logic to positions, if one position goes up, as the DHs did from 1994 to 2007, another position has to go down.

I compared three ranges of seasons:

  • The Steroid Era; fourteen years from 1994 to 2007
  • The fourteen prior seasons, 1980-1993
  • The seven seasons since

If, as Jon L. suggests, the Steroid Era disproportionately helped sluggers, we’d expect to see OPS+ rise for the left end of the spectrum and fall for the right end. If, as I contended, the increase in DH productivity was more due to the influx of very skilled hitters in the DH role (Edgar Martinez, David Ortiz, Travis Hafner, and others) than something systematic, the change in OPS+ among positions would be pretty random. Here are the American League results (source for all tables: baseball-reference.com):

It turns out that other than a somewhat idiosyncratic drop in production among left fielders (Rickey Henderson’s best years were before 1994, while left fielders Jim Rice, George Bell, and Brian Downing were all high-OPS stars of the 1980s), Jon L.’s hypothesis looks correct. Collectively, DHs, first basemen, and corner outfielders added ten points of OPS+ during the Steroid Era (two-three per position) while center fielders and infielders lost eight points (two per position – totals don’t sum to zero due to rounding). After 2007, the hitters’ positions lost 21 points of OPS+ (five per position) while the fielders’ positions picked up 21 (four per position).

Again, these are relative changes. American League center fielders batted .267/.330/.401 from 1980 to 1993, an OPS of .731. They hit .273/.339/.423 from 1994 to 2007, an OPS of .762. Their absolute numbers improved. But relative to the league, they declined. Offensive performance shifted away from glove positions to bat positions in the American League during the Steroid Era, and back toward the glove guys thereafter.

What’s an increase of two or three points of OPS+, as occurred for DHs from 1994-2007, worth? In the current environment, it’s about 14-20 points of OPS. That’s about the difference in 2014 between Indians teammates Yan Gomes (122 OPS+) and Lonnie Chisenhall (120 OPS+), or Royals teammates Eric Hosmer (98) and Billy Butler (95), or Twins teammates Trevor Plouffe (110) and Joe Mauer (107). (Man, it must be tough to be a Twins fan.)

So what does this mean? Maybe PEDs worked better for sluggers than for fielders, i.e., maybe they boosted sluggers’ batting skills more than other players’. Maybe sluggers took more drugs. I don’t know, and I really don’t care–as I said, I’m tired of the PED talk. But to swing back to Jon L.’s comments on my piece, I think I was too glib in attributing the increased relative performance by DHs from 1994 to 2007 to players and strategy alone. Looks like chemicals may have played a role.

But wait, I’m not done. I mentioned the lack of definition of the Steroid Era. If I use the Neyer/Sarris starting point of 1987 and the last pre-testing season of 2003 as an endpoint, things change a bit. Stretching out the definitions of the eras to 1973-1986 as pre-steroids and 2004-present as post-steroids, here’s what I get:

That’s not as dramatic. Yes, there’s still a shift in OPS+ from the five positions on the right of the defensive spectrum to the four on the left during the Steroid Era, and back again thereafter. But it’s smaller and much less uniform. DHs and left fielders have actually done a bit better since the end of the differently-defined Steroid Era. That’s less compelling.

And the Steroid Era didn’t affect just the American League, of course. Of the 24 player-seasons between 1990 and 2007 in which a player hit 50+ home runs, half the players were in the National League (12 and a third, given that Mark McGwire split time in 1997 between Oakland and St. Louis en route to 58 homers), including all seven seasons of 58+ (seven and a third including McGwire’s 1997). And if you throw the NL into the mix the relationship breaks down more, regardless of how you define the Steroid Era, looking more random than systematic:

The shift of offense to bat-first positions during the Steroid Era is much less pronounced when looking at the two leagues combined, If there were an incontrovertible trend, we’d see plus signs for DHs, first basemen, and corner outfielders in the Steroid Era and minus signs thereafter, and the opposite for infielders and center fielders. That’s not the case.

So while the data aren’t altogether compelling, I’ll concede Jon L.’s point: The Steroid (or PED, or Selig) Era didn’t just boost offenses overall, it changed the contour of offensive performance, shifting some production away from the glove-first positions to the bat-first positions. There was an uptick not only in offensive performance as a whole, but particularly in offensive performance generated designated hitters, first basemen, and corner outfielders. However, the magnitude of the effect is dependent on the league and the years chosen, which indicates that it’s not strong. So I’m sticking with my view that there was an unusual concentration of talent playing DH from the mid-1990s to the mid-2000s. Designated hitters generated more offense, both absolutely and relatively, from 1994 to 2007 than in any other period. The underlying reason may be partly the Steroid Era, but we can say that those years were also the Edgar Martinez era.


Analyzing the FanGraphs’ Mock Draft from an Outsider’s Point of View – OF (part 3)

As an avid reader of FanGraphs, I’ve been following the ongoing mock draft and thought it would be interesting to compare the results to the dollar value rankings I created using Steamer’s 2015 projections.

UPDATE: I downloaded the chat spreadsheet and the following commentary is up through the middle of the 21st round, pick #249 (Rick Porcello). Here is a breakdown, position-by-position. I’ve included the overall pick and the dollar value for that player based on 2015 Steamer projections in parentheses.

Outfield—part 3

In part 1, I wrote about the first 20 outfielders taken in the FanGraphs Mock draft.

Part 2 had the next 20 outfielders. This is part 3.

In rounds 13 and 14, four outfielders went off the board. Brandon Moss (146th–$13) was taken early in the 13th round. Moss had a brutal second half of 2014, but Steamer projects him to hit 28 homers with 76 RBI in 2015. Five picks later went Gregory Polanco (151st–$5). Polanco hit quite well in AAA last year but struggled in the big leagues. His Steamer projection calls for a .250/.310/.382 line but, at 23 years old, he could easily beat that. He’s also projected for 14 homers and 23 steals. Seven picks after Polanco was Avisail Garcia (164th–$6), who is projected to be of similar value but in a different way, with more homers, RBI, and a better batting average but fewer steals. The final pick of the 14th round was Arizona’s A.J. Pollock (168th—[-$1]). Pollock hit .302 with 14 steals in 75 games in 2014, but is projected to be worth -$1 in 2015, with a .262 average and 16 steals in 127 games.

The next five outfielders were taken within nine picks of each other in the 15th round. Here are the Steamer projections for this group:

578 AB, 79 R, 5 HR 47 RBI, 23 SB, .282 AVG—Denard Span (171st–$11)

487 AB, 65 R, 24 HR, 74 RBI, 4 SB, .258 AVG—Oswaldo Arcia (172nd–$12)

526 AB, 66 R, 10 HR, 56 RBI, 27 SB, .264 AVG—Leonys Martin (173rd–$9)

564 AB, 77 R, 6 HR, 49 RBI, 19 SB, .270 AVG—Adam Eaton (177th–$7)

537 AB, 60 R, 8 HR, 55 RBI, 21 SB, .267 AVG—Lorenzo Cain (179th–$4)

Here in the 15th round, drafters had four guys who provide some steals with varying levels of power and batting average ability and one guy who should hit 20 or more homers. Later in the draft, it becomes more about team need than value. If you get to the 15th round and still need home run power, Oswaldo is your guy.

No outfielders were taken in the 16th or 17th rounds, but four came off the board in the 18th. Danny Santana (211th–$0) is more valuable at shortstop than outfield but his Steamer projection pegs him at replacement level even at the shortstop position. In seven minor league seasons, Santana hit .273/.317/.391. Then he came up last year and hit .319/.353/.472 for the Twins, with 7 homers and 20 steals in 101 games. He also had a .405 BABIP. If you take his stats with the Twins last season and adjust his BABIP from .405 to the .314 BABIP projected by Steamer for 2015, with all of the lost hits being singles, his batting line last year would have been .252/.288/.405. Steamer projects a .261/.299/.371 line. He should steal some bases (projected for 18), but don’t go overboard because of last year’s 100-game stint.

Two picks later, Michael Cuddyer (213th–$8) was added by Eno. Cuddyer hit .307/.362/.525 in his three years with the Rockies but no one expects that kind of production this year with the Mets. This late in the draft, he looks like a good value, based on Steamer projections. He was the 51st outfielder taken and is ranked 44th by Steamer among outfielders.

Michael Saunders (214th—[-$2]) was taken with the next pick. He’s only projected for 477 plate appearances, so he’s not expected to be as valuable as some other outfielders who are projected for more playing time. Saunders is a guy who could get to double-digits in homers and steals, so he’s not a bad flyer to take in the later rounds, particularly if you think he’ll play more than his projection.

The last of the four outfielders taken in the 18th round was Arismendy Alcantara (216th–$1). Alcantara has 2B eligibility and is more valuable at that spot. He will steal you some bags and has good power for a middle infielder, but the batting average will hurt you.

Seven outfielders were taken from rounds 19 through 22 and this group is all over the place. Here are the Steamer projections for this group of seven:

492 AB, 55 R, 10 HR, 58 RBI, 17 SB, .265 AVG—Alex Rios (221st–$2)

377 AB, 48 R, 6 HR, 38 RBI, 28 SB, .265 AVG—Rajai Davis (229th—[-$5])

552 AB, 75 R, 14 HR, 55 RBI, 19 SB, .241 AVG—Desmond Jennings (237th–$6)

415 AB, 55 R, 16 HR, 55 RBI, 19 SB, .246 AVG—Steven Souza (240th–$2)

510 AB, 64 R, 19 HR, 70 RBI, 4 SB, .247 AVG—Josh Hamilton (250th–$5)

526 AB, 74 R, 11 HR, 55 RBI, 13 SB, .246 AVG—Dexter Fowler (251st–$3)

567 AB, 73 R, 15 HR, 69 RBI, 4 SB, .284 AVG—Torii Hunter (253rd–$14)

We’re getting to the late rounds and here you can get an idea of what might be available. There are guys who will steal some bases and reach double-digits in home runs, but they won’t help you much in RBI and will hurt you in batting average.

Alex Rios has been all over the place in his career, from a high wRC+ of 126 in 2012 to a low of 60 in 2011. Over the last three years, his wRC+ has dropped from 126 to 104 to 92. Steamer projects him to bump it up slightly to 95 next year.

Rajai Davis is a guy who won’t play every day, but will steal some bases when he’s in the lineup and has been particularly good against left-handed pitching, with a career wOBA against lefties of .353. He can be quite productive if used correctly.

Desmond Jennings had his best stretch of hitting in a 63-game stint in 2011 at the age of 24 (128 wRC+), but hasn’t been as good since. He’s one of the better options this late in the draft, but doesn’t seem likely to ever live up to his early promise.

Steven Souza’s projection is very similar to Jennings, minus some runs scored and in less playing time. If you think Souza will get more regular playing time than the 415 at-bats he’s projected for, he’s a guy to target.

Josh Hamilton’s two years with the Angels have been very disappointing and Steamer doesn’t see any improvement coming.

Dexter Fowler is similar to Jennings and Souza but with fewer projected steals.

Finally, Torii Hunter projects to be the best of this bunch, despite his advanced age (he’ll be 39 in 2015). Hunter was the 60th outfielder taken but is ranked 31st based on Steamer projections.


Analyzing the FanGraphs’ Mock Draft from an Outsider’s Point of View – OF (part 2)

As an avid reader of FanGraphs, I’ve been following the ongoing mock draft and thought it would be interesting to compare the results to the dollar value rankings I created using Steamer’s 2015 projections.

UPDATE: I downloaded the chat spreadsheet and the following commentary is up through the middle of the 21st round, pick #249 (Rick Porcello). Here is a breakdown, position-by-position. I’ve included the overall pick and the dollar value for that player based on 2015 Steamer projections in parentheses.

Outfield—part 2

In part 1, I looked at the twenty outfielders who were taken among the first 56 picks in the FanGraphs Mock Draft. This section covers the next 20 outfielders drafted, starting with round 6.

Four outfielders were taken in the 6th round of the FanGraphs Mock, with Jason Heyward (62nd–$20) going off the board early in the round. Steamer is projecting a significant increase in home runs for Heyward, from 11 last year to 20 in 2015. In his five-year career, Heyward has hit 20 or more homers just once, back in 2012. While Steamer likes Heyward to almost double his homer total from a year ago, the same is not true for the next outfielder drafted—Nelson Cruz (66th–$15). Steamer projects a drop from 40 homers last year to 26 this year as Cruz moves from Baltimore to Seattle. This also comes with more than 100 fewer plate appearances, which contributes to a drop in his projection for runs (from 87 to 70) and RBI (from 108 to 80). He’s also projected for a drop in batting average (from .271 to .249). Christian Yelich (67th–$18) was taken with the next pick. He’s projected to increase his homer total from 9 to 14 and maintain his base-stealing ability, but with a drop in batting average. Finally, on the very next pick the choice was Yoenis Cespedes (68th–$23), who was the 24th outfielder taken in this mock draft but is ranked 12th among outfielders based on Steamer projections.

With these four outfielders, I could see very different opinions among fantasy owners. Do you believe in Nelson Cruz more than Steamer does? Do you think Heyward can hit 20 homers or Yelich can hit 14? How will Cespedes hit in Detroit? Steamer would rank them Cespedes, Heyward, Yelich, and Cruz. Your mileage may vary.

The 7th round saw two outfielders on different career trajectories. Young Mookie Betts (will be 22 this year) had a good 52-game stretch last year but plays for the Red Sox who have a packed outfield at the moment. Steamer currently has Betts (73rd—[-$1]) projected for 389 plate appearances, which gives him negative value despite a good batting line. Later in the 7th round, 35-year-old Matt Holliday (80th—$19) was taken. Steamer projects Holliday to have a similar season in 2015 as he had in 2014, but with 40 fewer at-bats, along with fewer runs scored and RBI. When it comes to drafting Betts before Holliday, you have to believe Betts will get regular playing time. Holliday has had 600 or more plate appearances in eight of the last nine years, so he’s much more of a sure thing.

Seven more outfielders were taken over a span of 16 picks in rounds 8 and 9. Here are their projections for 2015:

593 AB, 82 R, 16 HR, 64 RBI, 22 SB, .274 AVG—Charlie Blackmon (87th–$22)

573 AB, 80 R, 18 HR, 72 RBI, 9 SB, .270 AVG—Alex Gordon (89th–$18)

574 AB, 82 R, 20 HR, 68 RBI, 9 SB, .263 AVG—Kole Calhoun (90th–$17)

524 AB, 78 R, 18 HR, 73 RBI, 7 SB, .285 AVG—Jayson Werth (95th–$20)

496 AB, 64 R, 24 HR, 72 RBI, 8 SB, .239 AVG—Jay Bruce (98th–$8)

565 AB, 66 R, 22 HR, 76 RBI, 4 SB, .255 AVG—Marcell Ozuna (100th–$11)

555 AB, 76 R, 14 HR, 66 RBI, 6 SB, .288 AVG—Melky Cabrera (102nd–$15)

These projections (and this mock draft) are from before it was announced that Jayson Werth had surgery on the AC joint in his shoulder. He may not reach 524 at-bats in 2015, but the injury is not expected to keep him out for too long.

Of this group of seven outfielders, Blackmon’s projected steals and otherwise solid numbers make him more valuable than the rest. Alex Gordon, Kole Calhoun, and Jayson Werth are similarly valued. You could go for the upside play with the younger Calhoun or the steadiness of veteran Alex Gordon.

The next three outfielders don’t project to be as valuable as the top group, but there’s enough variation possible that they could get to that level. Jay Bruce had the worst year of his career in 2014, hitting just .217/.281/.373. Taking him in the 9th round is hoping for a bounce back season. Marcell Ozuna is six years younger and will likely hit for more power with a lower batting average than Melky Cabrera, so I could see an argument for taking him before the Melk-Man.

In the 10th round, three more outfielders went off the board. Before last season, Shin-Soo Choo (110th–$16) was a hot commodity coming off a 20-20 season with a .285/.423/.462 batting line and moving to a great hitter’s park in Texas. Unfortunately, he was a big disappointment. He played just 123 games and hit .242/.340/.374. He’ll be 32 in 2015 and Steamer likes him to rebound, but not to anything close to that 2013 season. Wil Myers (113th–$2) isn’t a favorite of Steamer but he has youth on his side and a good pedigree and could easily beat his projection. Jorge Soler (117th–$13) played at four levels last season. He had just 8 games in the Rookie league, then destroyed AA (.415/.494/.862 in 22 games), continued to hit well in AAA (.282/.378/.618 in 32 games) and kept it up with the Cubs in the big leagues (.292/.330/.573 in 24 games). He’s only 23 years old and has a nice projection for 2015. I’d be inclined to take him over Myers and Choo, just for the upside.

The next four outfielders taken, from pick 122 to pick 143, includes two players who do not have Steamer projections. Rusney Castillo is one of those, taken with pick #122. His playing time is in question because of the Red Sox outfield logjam, but the Sox signed him for six years and $72 million last August, so he should get a chance to play. I do have projections from Cairo and Davenport for Castillo. Averaging Castillo’s projections from Cairo and Davenport, we get 241 at-bats, with a .279/.325/.429 batting line, 6 homers, and 8 steals. If you double that line to approximate a full season, he would be worth $10 and be the #40 outfielder. He was taken 37th among outfielders in this mock draft.

Brett Gardner (136th–$11) was taken 14 picks after Castillo. Early in his career, Gardner had back-to-back seasons with 47 and 49 steals. He’s more of a 20-steals guy these days, but did just have a big homer year, hitting a career-high 17 in 2014. Steamer expects a drop to 12 homers in 2015, with the rest of his numbers being very similar to last year.

Taken shortly after Gardner was Ben Revere (142nd–$8). Revere will steal you plenty of bases (49 last year), but his RBI output is reminiscent of Rob Picciolo. Revere went the first three-plus years of his career without hitting a home run, then muscled up for two long balls last year. This is his age-27 season and Steamer is expecting a career-high of three dingers in 2015. I would take the under on that projection.

The fourth player taken in this group was Yasmany Tomas. Steamer has nothing to work with here. Tomas was signed by the Diamondbacks in December to a six-year, $68.5 million deal. He could play third base or the outfield and is expected to hit for power after hitting 30 home runs in 205 regular-season games in Cuba, going back to 2008.

In part 3: the next 20 outfielders drafted.


Analyzing the FanGraphs’ Mock Draft from an Outsider’s Point of View – OF (part 1)

As an avid reader of FanGraphs, I’ve been following the ongoing mock draft and thought it would be interesting to compare the results to the dollar value rankings I created using Steamer’s 2015 projections.

UPDATE: I downloaded the chat spreadsheet and the following commentary is up through the middle of the 21st round, pick #249 (Rick Porcello). Here is a breakdown, position-by-position. I’ve included the overall pick and the dollar value for that player based on 2015 Steamer projections in parentheses.

Outfield

The top three picks in the FanGraphs Mock Draft were outfielders Mike Trout (1st–$55), Andrew McCutchen (2nd–$39), and Giancarlo Stanton (3rd–$48).

At the top of the outfield rankings is the amazing Mike Trout, who can basically do anything on the baseball field. He’s the clear-cut top pick. The next two outfielders drafted were Andrew McCutchen and Giancarlo Stanton. Steamer projects Stanton to be more valuable than McCutchen, with a career-high in runs scored and homers. McCutchen is Trout-like, but with fewer homers, runs, and RBIs projected. After Trout, you could go either way with pick #2. You want big time power, take Stanton. You want power and steals, take McCutchen. I prefer McCutchen myself.

Late in the first round, there was a run during which six outfielders were drafted between pick #9 and pick #23. Jose Bautista (9th–$42) was the fourth outfielder taken but Steamer actually likes him more than McCutchen. Bautista had 673 plate appearances last year and is projected for 653 this year. He will be 34, though, and in the two seasons before last year he was limited to 399 and 528 plate appearances. Just based on age, he’s a little bit of a risk compared to the other top 10 outfielders. Carlos Gomez (12th–$27) was next, then Yasiel Puig (13th–$31). Puig is more valuable because he’s projected for more runs, RBI, and a higher batting average, while Gomez has the edge in projected steals. Three picks after Puig came the back-to-back selections of Jacoby Ellsbury (16th–$24) and Adam Jones (17th—$29). The edge here for Jones comes in homers and RBI, while Ellsbury should steal many more bases. The final outfielder taken in the 2nd round was Bryce Harper. After two injury-shortened seasons, Steamer is projecting Harper to play just as much as he did in his debut season (projected for 594 plate appearances) and hit 25 homers with 10 stolen bases.

Four more outfielders were taken in the third round, all within seven picks of each other. The controversial Ryan Braun (28th–$27) was the first outfielder taken in the third round, directly followed by 2014 breakout player Michael Brantley (29th–$20). The next pick was Justin Upton (30th–$14) and Carlos Gonzalez (34th–$24) came four picks later. Let’s look at this group of outfielders, starting with their averages over the last three years:

451 AB, 69 R, 23 HR, 77 RBI, 15 SB, .295 AVG—Ryan Braun

573 AB, 74 R, 12 HR, 77 RBI, 17 SB, .301 AVG—Michael Brantley

559 AB, 93 R, 24 HR, 80 RBI, 11 SB, .271 AVG—Justin Upton

390 AB, 65 R, 20 HR, 64 RBI, 15 SB, .288 AVG—Carlos Gonzalez

Based on the last three years, Upton looks like the most valuable outfielder among this group, but his Steamer projection is the worst of the bunch. Braun missed two-thirds of the 2013 season because of a PED suspension and was not the hitter he’d been when he got back on the field in 2014. Carlos Gonzalez is risky because he seemingly gets injured every year. Michael Brantley had the best 2014 season among these players, but it was out of line with what he had done before. Here are the 2015 Steamer projections for these four players:

546 AB, 79 R, 24 HR, 80 RBI, 13 SB, .278 AVG—Ryan Braun ($27)

575 AB, 75 R, 13 HR, 72 RBI, 14 SB, .290 AVG—Michael Brantley ($20)

530 AB, 71 R, 23 HR, 74 RBI, 8 SB, .253 AVG—Justin Upton ($14)

475 AB, 74 R, 24 HR, 77 RBI, 11 SB, .282 AVG—Carlos Gonzalez ($24)

Upton’s projection is the most interesting one here because it’s much worse than his three-year averages. He’s moving to a tough ballpark in San Diego and will be on a team that scored the fewest runs in baseball last year by a good margin, but his former team, the Atlanta Braves, scored the second-fewest runs last year and the Padres should be much better offensively in 2015 than they were in 2014.

Here is a comparison of Upton’s projections from Steamer, ZiPS, Cairo, and Davenport.

530 AB, 71 R, 23 HR, 74 RBI, 8 SB, .253 AVG—Justin Upton—Steamer ($14)

567 AB, 94 R, 26 HR, 85 RBI, 12 SB, .261 AVG—Justin Upton—ZiPS ($31)

564 AB, 86 R, 25 HR, 86 RBI, 10 SB, .265 AVG—Justin Upton—Cairo ($28)

515 AB, 68 R, 18 HR 76 RBI, 9 SB, .259 AVG—Justin Upton—Davenport ($12)

That’s a pretty big spread. Steamer and Davenport have Upton as a $12 to $14 player, while ZiPS and Cairo have him in the $28 to $31 range. At the high range, Upton would be a top 10 outfielder. At the low range, he’s outside the top 30. In this mock, he was the 12th outfielder drafted.

Four outfielders were taken in the fourth round and all have similar value according to Steamer: Hunter Pence (38th–$18), Corey Dickerson (42nd–$18), Billy Hamilton (43rd–$20), and Starling Marte (44th–$18). Pence and Dickerson have similar overall projections and, thus, similar value. Hamilton’s projection for 68 steals makes him the top base-stealing outfielder out there, but he’ll hurt you in homers, RBI, and batting average. Marte isn’t likely to hit as many homers as Pence or Dickerson, but will steal more bases.

The fifth round saw three more outfielders taken, which meant 20 were now off the board.In this round, two younger players and a veteran were drafted, starting with J.D. Martinez (51st–$19). Martinez didn’t hit much in his first three partial seasons in the major leagues (.251/.300/.387), but had a very good 2014 season (.315/.358/.553 with 23 homers in 123 games). Steamer doesn’t expect Martinez to reach those heights this year, but he’s still projected for 22 homers and 80 RBI. George Springer (55th–$20) had a good half-season in 2014 and Steamer likes him to hit 28 homers and steal 15 bases in 2015, putting him in the top 20 among all outfielders. The veteran, Matt Kemp, doesn’t have such a rosy outlook. Moving to San Diego should bring his numbers down. He is ranked 38th among outfielders based on Steamer projections and his Cairo and Davenport projections aren’t much better (no ZiPS yet).

FanGraphs Mock Draft Top-20 Outfielders versus Steamer Rankings
PCK RND $$ OF-Rnk NAME Steamer Rank Difference
1 1 $55 1 Mike Trout 1 0
2 1 $48 2 Andrew McCutchen 4 +2
3 1 $42 3 Giancarlo Stanton 2 (-1)
9 1 $39 4 Jose Bautista 3 (-1)
12 1 $27 5 Carlos Gomez 8 +3
13 2 $31 6 Yasiel Puig 5 (-1)
16 2 $24 7 Jacoby Ellsbury 10 +3
17 2 $29 8 Adam Jones 6 (-2)
23 2 $25 9 Bryce Harper 9 0
28 3 $27 10 Ryan Braun 7 (-3)
29 3 $20 11 Michael Brantley 15 +4
30 3 $14 12 Justin Upton 32 +20
34 3 $24 13 Carlos Gonzalez 11 (-2)
38 4 $18 14 Hunter Pence 23 +9
42 4 $18 15 Corey Dickerson 21 +6
43 4 $20 16 Billy Hamilton 14 (-2)
44 4 $18 17 Starling Marte 22 +5
51 5 $19 18 J.D. Martinez 20 +2
55 5 $20 19 George Springer 18 (-1)
56 5 $11 20 Matt Kemp 38 +18


Final Notes for Part 1: Fifteen of the first twenty outfielders taken in the FanGraphs Mock Draft are ranked in the top 20 for outfielders based on Steamer projections. The outfielders drafted who are NOT ranked in the Steamer top 20 are Justin Upton (FanGraphs—12th, Steamer—32nd), Hunter Pence (FanGraphs—14th, Steamer 23rd), Corey Dickerson (FanGraphs—15th, Steamer—21st), Starling Marte (FanGraphs—17th, Steamer—22nd), and Matt Kemp (FanGraphs—20th, Steamer—38th). These are the guys that the FanGraphs mock drafters like more than Steamer.

The outfielders missing from the FanGraphs Top 20 but included in the Steamer Top 20 are Yoenis Cespedes (ranked 12th by Steamer, $23), Charlie Blackmon (Steamer—13th, $22), Jayson Werth (Steamer—16th, $20), Jason Heyward (Steamer—17th, $20), and Matt Holliday (Steamer—19th, $19).

Up next, more outfielders.


Analyzing the FanGraphs’ Mock Draft from an Outsider’s Point of View — C

As an avid reader of FanGraphs, I’ve been following the ongoing mock draft and thought it would be interesting to compare the results to the dollar value rankings I created using Steamer’s 2015 projections.

I downloaded the draft spreadsheet partway through the 16th round, just after pick 183 (Chase Headley). Here is a breakdown, position-by-position. I’ve included the overall pick and the dollar value for that player based on 2015 Steamer projections in parentheses.

UPDATE: I downloaded the chat spreadsheet and the following commentary is up through the middle of the 21st round, pick #249 (Rick Porcello).

Catcher

The top of the catcher rankings consists of one guy: Buster Posey (35th–$29). Not only is Posey a great hitter; he also gets more playing time than most catchers because he can play first base when he’s not behind the dish. In this mock draft, Posey was taken late in the third round, ahead of such players as Jason Kipnis, Stephen Strasburg, Hunter Pence, Yu Darvish, Ian Kinsler, and David Price. The next catcher off the board came five rounds later. Based on this mock and Steamer projection-based dollar values, Posey is on a tier of his own.

The 8th round saw two more catchers get drafted. Jonathan Lucroy (88th–$5) and Yan Gomes (91st–$7) were taken within three picks of each other. Steamer has Lucroy projected for 98 games and 424 plate appearances, which has to be considered far too low. Lucroy played in 147 games in 2013 and 153 in 2014 and it sounds like he’ll get time at first base against left-handed pitching this year. He really should be only below Posey in value, but his low playing time projection has him ranked 11th among catchers by Steamer. Yan Gomes is also projected to get less playing time in 2015 than he did in 2014 and also figures to come up short of the 21 homers and 74 RBI that he produced last season.

Two more catchers were taken in the 12th round. Brian McCann (133rd–$18) is projected for similar counting stats as he had in 2014 but with a better batting average. Devin Mesoraco (137th–$4) had a breakout 2014 season when he hit .273 with 25 homers and 80 RBI in 114 games. Steamer has him down for a .246 average, 18 homers, and 54 RBI in 102 games. He’s the #12 catcher according to these projections. Two rounds and 25 picks after Mesoraco was taken, Yadier Molina (162nd–$1) went off the board. From 2009 to 2013, Molina averaged 138 games and 537 plate appearances per season (hitting .299/.356/.435). He’ll be 32 this season and was limited to 110 games last year because of an oblique injury. He’s expected to be fully healthy by spring training, but Steamer still has him projected for fewer games in 2015 than he had in his injury-shortened 2014 season.

There was a run on catchers in rounds 16 and 17. Evan Gattis (189th–$20) got it started with the 189th pick and three more catchers were taken among the next 13 choices: Travis d’Arnaud (193rd–$8), Wilin Rosario (195th—[-$1]), and Salvador Perez (202nd–$9). Based on Steamer projections, Gattis is by far the most valuable among this group, and second to Posey overall among catchers, while Rosario looks like the worst value. Let’s look at their 2015 Steamer projections:

528 AB, 63 R, 26 HR, 77 RBI, 2 SB, .243 AVG—Evan Gattis (189th–$20)

454 AB, 54 R, 17 HR, 61 RBI, 2 SB, .251 AVG—Travis d’Arnaud (193rd–$8)

271 AB, 36 R, 14 HR, 43 RBI, 2 SB, .278 AVG—Wilin Rosario (195th—[-$1])

449 AB, 52 R, 14 HR, 58 RBI, 1 SB, .274 AVG—Salvador Perez (202nd–$9)

Here again, playing time is a major driving factor in the valuations. In his two seasons in the big leagues, Gattis has averaged 351 at-bats per season but is being projected for 528 AB by Steamer right now. Travis d’Arnaud had 385 at-bats last year and is projected for 454 this year, with better triple-slash numbers. Rosario is on the other side. He’s had three straight years with 382 or more at-bats but is projected for 271 at-bats in 2015. He still has the power numbers (.488 projected slugging percentage) and a solid batting average (.278), but the playing time is short. Similarly, Salvador Perez is coming off a season in which he played 150 games and had 578 at-bats. The previous year, he had 496 at-bats. In 2015, he’s projected for 449 at-bats.

In round 20, Russell Martin (236th–$10) was taken, making him the 11th catcher taken in this mock. Steamer has Martin projected for 434 at-bats with 16 homers and 59 RBI and he’s valued as the #4 catcher.

Final notes: With these assorted playing time questions, it’s difficult to judge the FanGraphs mock draft when it comes to the catcher position. Posey is clearly #1 and I think Lucroy is an easy #2. Beyond that, the rankings can change easily based on adjustments in projected playing time. A few guys that Steamer likes better than some already drafted are Matt Wieters, Wilson Ramos, and Stephen Vogt. In a 12-team league with one starting catcher, you could go for Posey or Lucroy or maybe even McCann. After that, just wait it out and see what’s still there late in the draft.