Why Are so Many Runs Scored in the Bottom of the First Inning?
After starting to look at some inning-by-inning data from my baseball win expectancy finder for another project, I stumbled across something weird that I can’t explain. Here’s a graph of expected runs scored per inning:
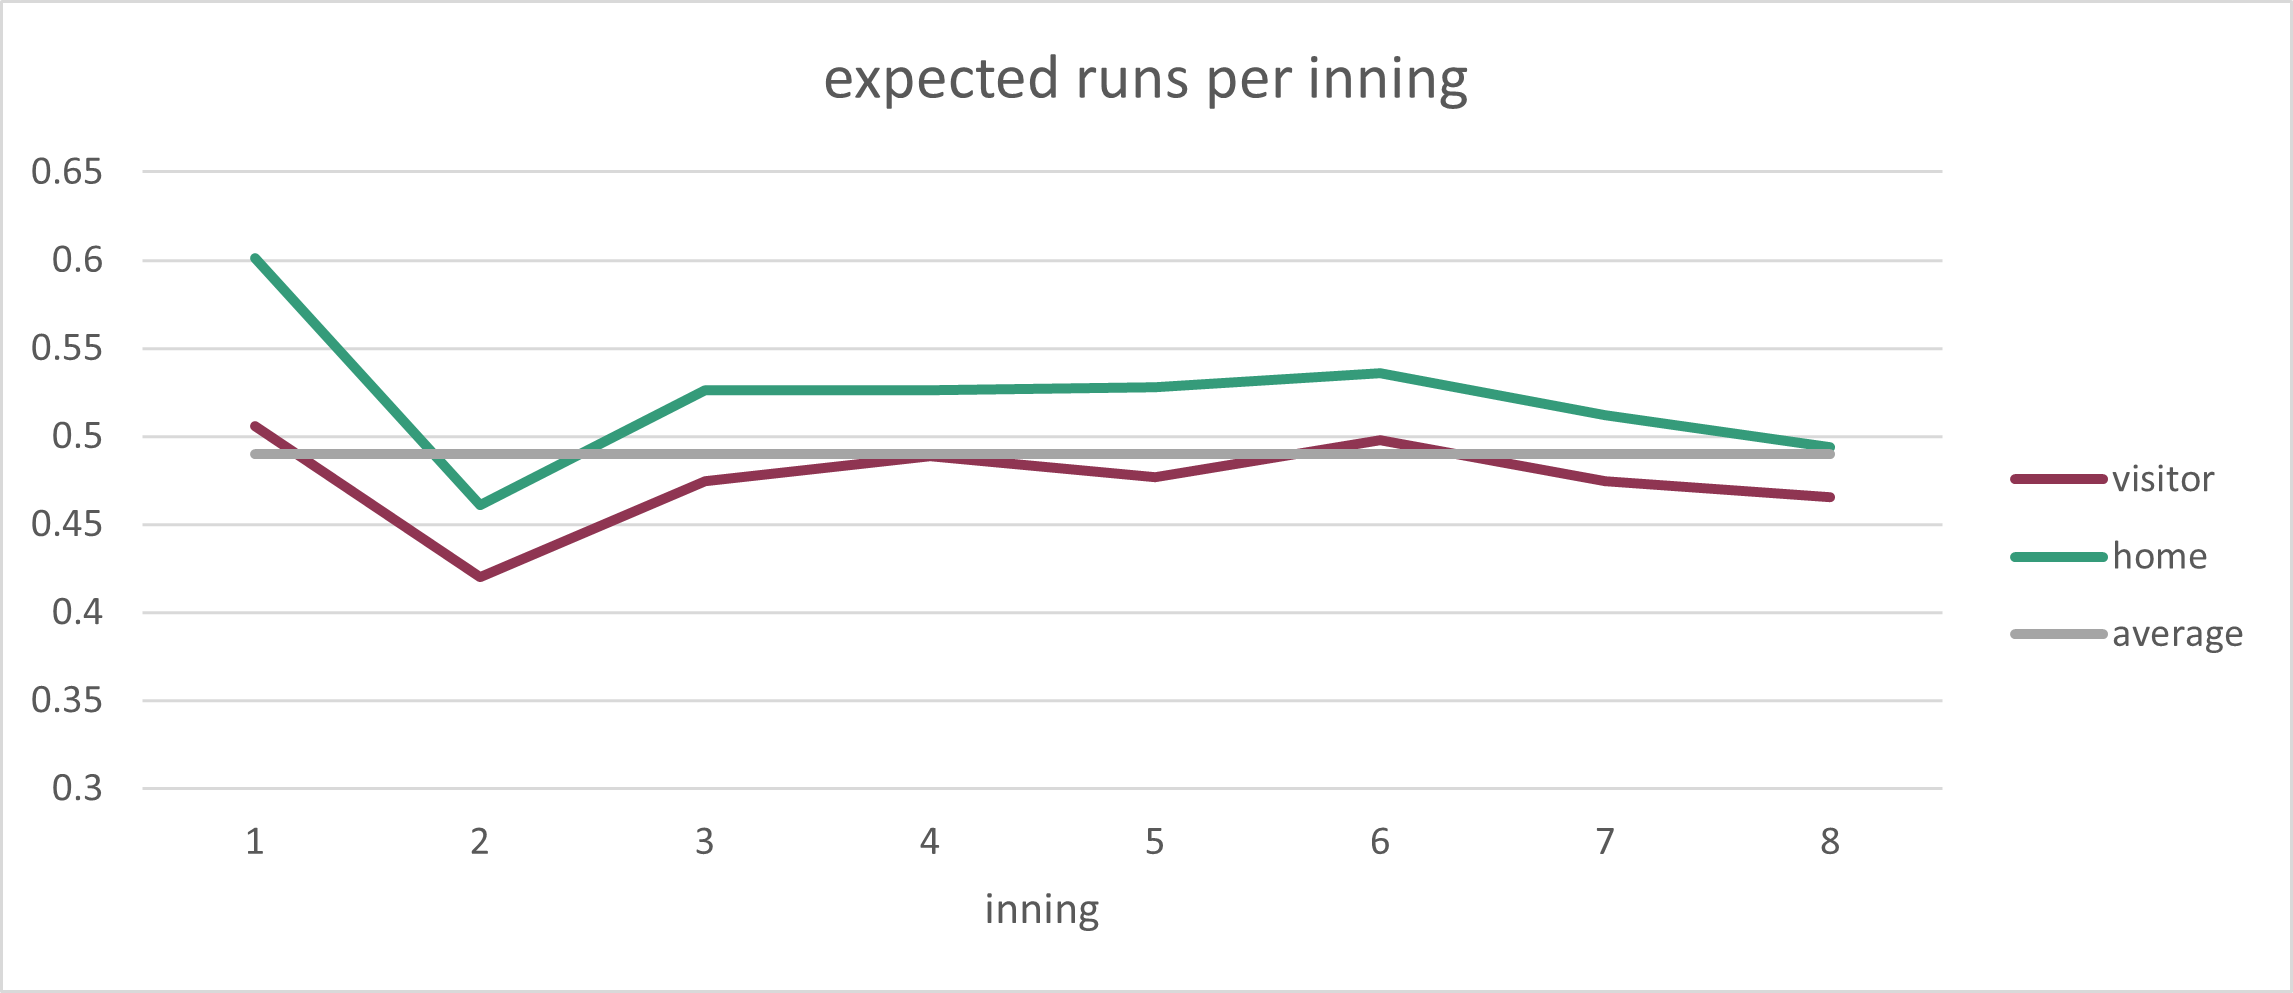
Check out how high the bottom of the first inning is. On average, 0.6 runs are scored then compared to 0.5 runs in the top of the first. That’s a huge difference! Let’s look closer:
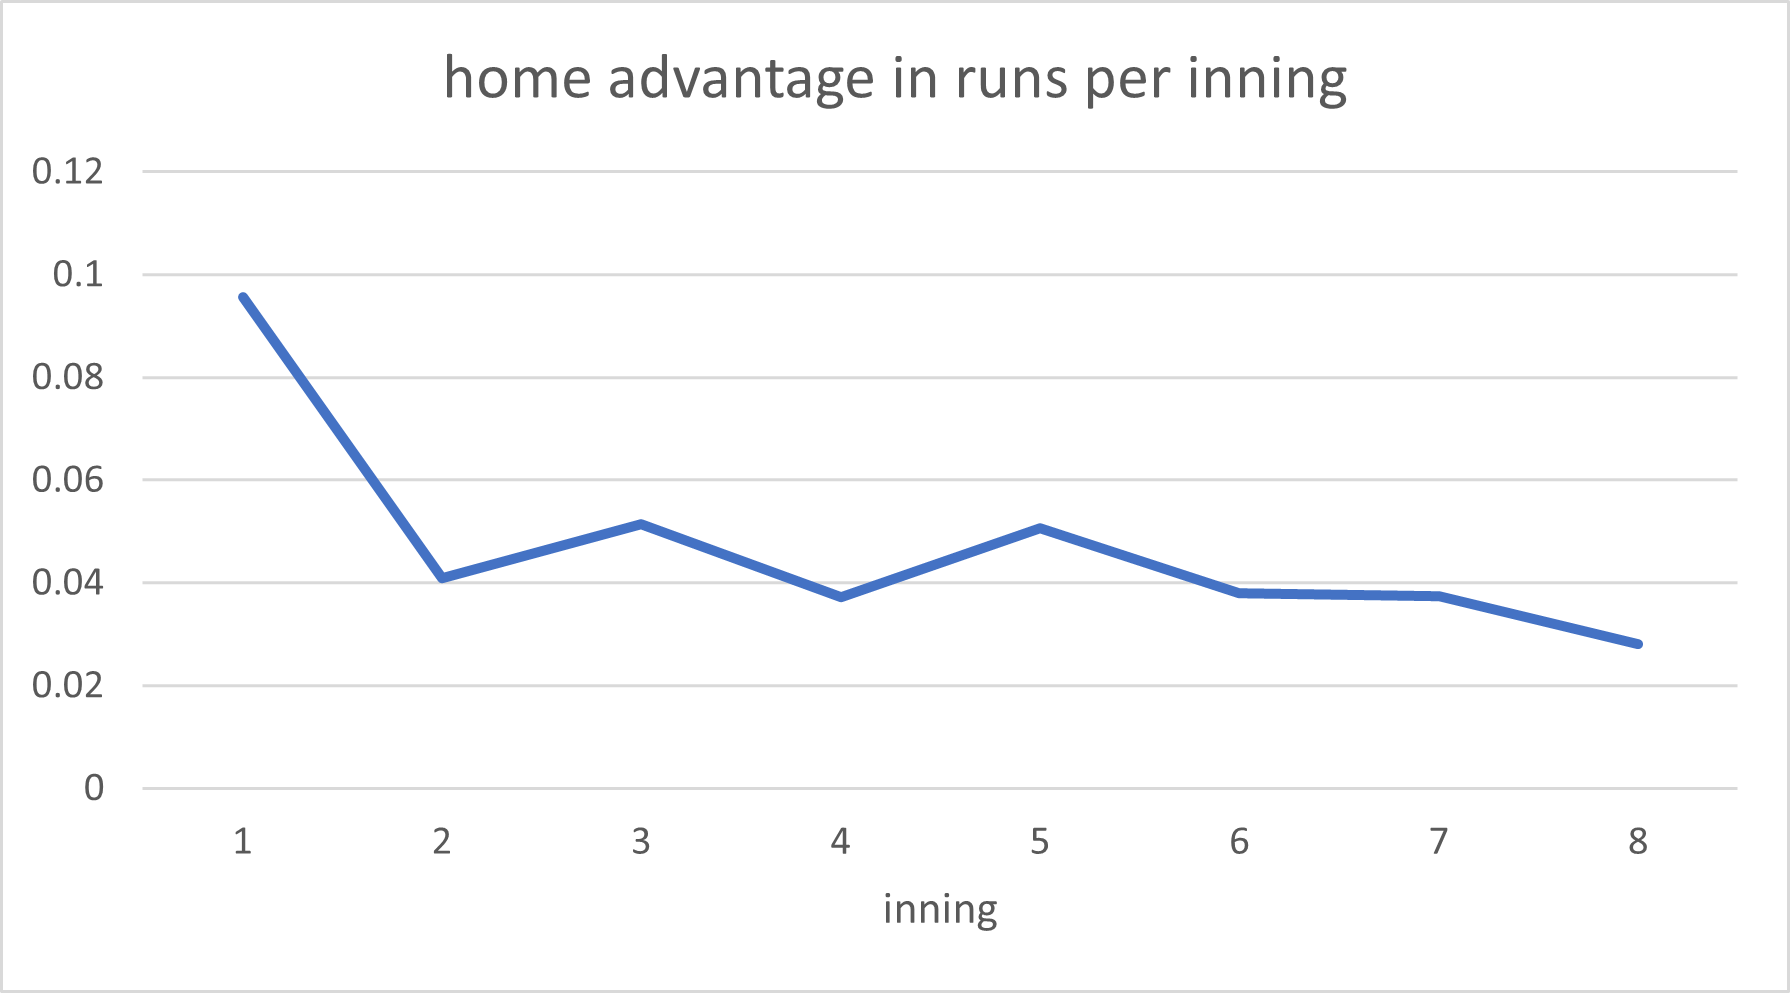
Holy outlier, Batman! So what’s going on? Here are some ideas:
- Teams score more in the first inning because the top of the lineup is at bat. This is true! You can see in the top graph that the expected runs scored in first inning is the highest for both the home and visiting teams (see this Beyond the Box Score article that discusses this). But that doesn’t nearly explain why the home team does so much better than the visiting team!
- Starting pitchers are more likely to have a terrible first inning. This might be true, but I can’t think of any reason why this would affect visiting starting pitchers more than home starting pitchers. I also made a graph of the home advantage for each number of runs scored for the first and third inning (I picked the third inning because that’s the second-greatest difference between home and visitor):
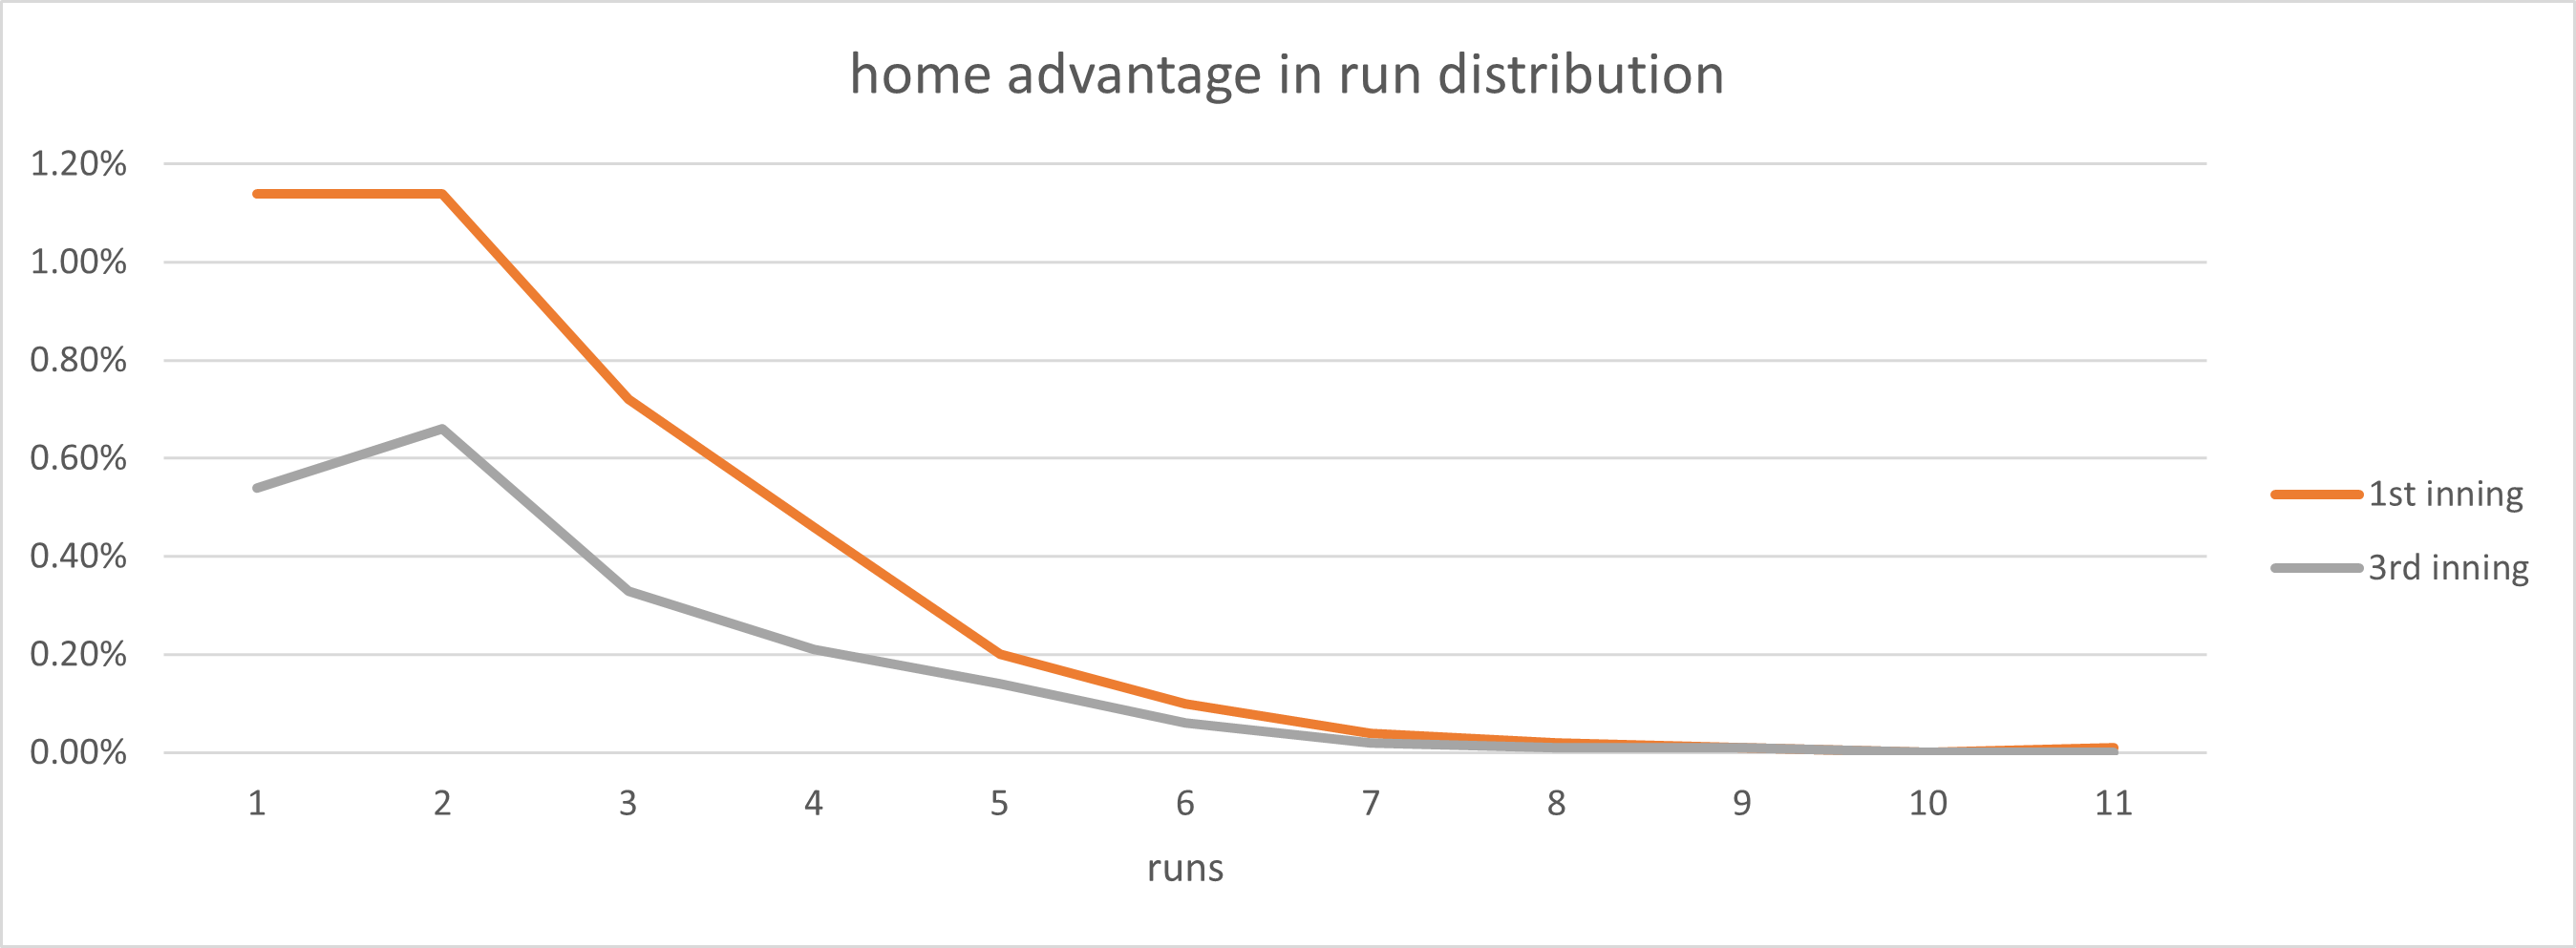
To me, these look almost exactly the same shape, so it’s not like the first inning has way more six-run frames or anything.
- This is just random chance. I guess that’s possible, but the effect seems large given that the data has more than 130,000 games.
- There’s a bug in my code. Maybe! I’ve been writing code for 20 years, and let me tell you, this is certainly possible! In fact, I found a bug in handling walk-off innings in the existing runs per inning code after seeing some weird results in this investigation. But it would be weird to have a bug that just affects the bottom of the first inning since it isn’t at the start or end of the game. I also implemented it in both Rust and Python, and the results match. But feel free to check – the Rust version is here and the Python version is here.
- This is different between baseball eras. I don’t know why this would be true, but it was easy enough to test out, and the difference is pretty consistent (see the raw data).
- The fact that home teams are usually better in the playoffs adds bias to this. I think this is a tiny bit true, but I reran the numbers with only regular season games (where the better team has no correlation with whether it’s the home or visiting team) and the difference looks almost exactly the same.
In conclusion, I don’t know! But a few people have suggested that the visiting pitcher has to wait a while between warming up and pitching in the bottom of the first. Tom Tango made a similar observation a while ago. I dive into this more in the follow-up post here.
Odds and ends:
- That top “expected runs per inning” graph has some other neat properties — for example, you can see that the second inning is the lowest scoring inning, presumably because players near the bottom of the lineup are usually up.
- Another thing you can see is how robust the home field advantage is. On average, the home team scores a little more than the visiting team in every inning!
- The graph only shows eight innings because in the ninth, things get complicated. For one thing, the bottom of the ninth inning only happens if the home team is behind or tied, which biases the sample somewhat. Also, if the game is tied and the home team hits a leadoff home run, they win the game but lose the opportunity to score any more runs.
- You can also notice the strangeness of the bottom of the first inning another way. If you look at the chance that the home team will win when the game is tied, their chances are better at the beginning of the bottom of the ninth than the bottom of the eighth because they have an extra chance to bat. That advantage gets lower the earlier in the game you go, with one exception. In the bottom of the first, the home team has a ~59% chance to win, but in the bottom of the second, that goes down to ~58%! The reason is that if the home team misses their chance to score runs in the bottom of the first, they’ve apparently missed a big opportunity!
- The raw report data can be found here in the GitHub repo.
This piece originally ran on my blog.
software developer, Astros fan
It is what Tango said.
Pitching on the road is intimidating. And that sense of unease is always worst in the first inning… Also, starting pitchers on the road are more likely to be travel weary while the opposing starting pitcher slept in his own bed. You’re naturally going to feel a little unease in a hostile environment and you probably didn’t get the best night sleep in the world and you’re facing their very best hitters… yeah, it’s no surprise there’s a pronounced home advantage in the 1st inning.
This is very interesting! If it is the warm-up delay factor, then this implies there is a decent amount to be gained for road teams by changing up the timing of starters warming up.
what about the condition of the mound? I assume every mound is a little different (but still within the ruled standards) and getting accustomed to it takes a little time. Maybe getting a good groove worn in for your landing foot or something? The home pitcher would naturally be accustomed to it or maybe even have the grounds crew tailor it to their requirements.
This is an interesting theory, thanks!
I would think that there are two important factors.
1. Top of the lineup starts off the game…that should explain some of this and you have mentioned this.
2. A pitcher “doesn’t have it” that game. If a pitcher doesn’t have it, this will typically show up right away (in the first inning). Perhaps this is exascerbated by being on the road (different mount in bullpen during warmups and in the game, different routine, etc.).
Yeah, I was trying to look at the “doesn’t have it” effect under the “Starting pitchers are more likely to have a terrible first inning” section, but it doesn’t seem like they’re more likely to have a particularly bad inning than you would expect given the data.
This was discussed many years ago on Tangos blog. Originally I thought that the home team had an advantage by seeing how the umpire was calling the game against the visiting team in the top of the first. But the real answer is much simpler. As most of you have stated each team scores more in the first than in other innings because it is the only inning where their three best batters are guaranteed to bat. The home team scores more because their three best batters have been selected by draft, trade, or purchase because they are more likely to hit well in their home park where they will play most of their games. They are all playing up to their predicted skill level; the home hitters, the visiting hitters,AND the home and visiting starting pitcher. Not every game of course, but on average in the aggregate. The key to understanding this is the two flat lines for the scoring from the third through the sixth inning. These innings have almost no bias on who leads off the inning. The distance between the two lines is the home team advantage from the selection bias.
But even given the home field advantage and the top of the lineup effect, it still seems like home teams are scoring more in the first inning than one would expect!