An Examination of Rebuilding Team Timelines

Rebuilding has become the popular way for MLB franchises to construct a World Series contender. Considering the league’s structure of compensating the worst teams with the best draft picks, it seems like a viable strategy to maximize your losses in order to obtain the services of the best amateur talent available. The Astros and Cubs are two of the more recent franchises to successfully cap their extensive rebuilding process with a World Series victory, and both franchises acquired top-10 draft picks for several years before they turned the corner and became champions, but how often does this strategy work and how long does a rebuild take?
If an organization’s strategy is to not win games right away, when do the fans and ownership realize that the rebuilding process has failed and that their team is in the middle of a downward spiral of ineptitude? I am sure there are fans of the Pittsburgh Pirates and Kansas City Royals from the 1990s and 2000s that know how difficult it is to build a contender and cringe whenever they hear the term rebuild. Hopefully this article can provide a reasonable timeline for contention and an objective overview on how a franchise’s rebuilding effort should be progressing.
For my dataset, I gathered the GM or President of Baseball Operations for each organization since 1998. I chose 1998 because it was the first year the league consisted of 30 teams and it also happened to be the first full season for the current longest-tenured executives, Billy Beane and Brian Cashman. If an executive’s tenure with the team started before the 1998 season, their entire tenure was included in the dataset. This means Braves GM John Schuerholz’s regime is measured in its entirety from 1991-2007 and not just from 1998-2007.
For executives that took over an organization during the regular season, I credited the team’s record from the executive’s first full season of running baseball operations and not the partial season they assumed their duties. For example, the 2002 Detroit Tigers record goes on Randy Smith’s ledger instead of Dave Dombrowski even though Dombrowski took over one week into the regular season.
To determine which front offices inherited a rebuilding situation, I limited the dataset to teams that had a winning percentage lower than .432 the year before the new executive assumed leadership. I chose a .432 winning percentage because this corresponds to a team that failed to win 70 games in a 162-game season. Most organizations that lose this many games in a season realize that they likely have a long time before contention and that a rebuild is necessary. By choosing such a low win threshold I eliminate several rebuilds like the Theo Epstein Cubs, but I’d rather exclude them than include 70-win teams that just had an off year and returned to prominence using the same core players.
I decided to include the new expansion team front offices. I feel they firmly belong in the rebuilding category since they are starting a new organization from scratch. This leaves me with 40 different rebuilds to analyze, and nine of them are current regimes. Below is a summary of each rebuild with the current front office leaders highlighted (click to enlarge).
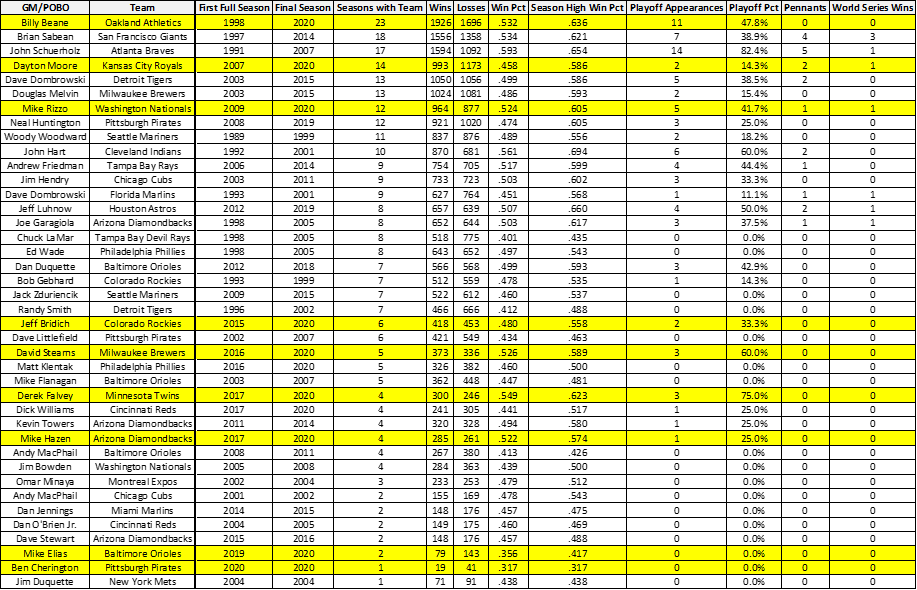
Seven different regimes won at least one World Series, and 23 of the 40 front offices had at least one postseason appearance. The longest tenure without a playoff appearance is a tie for eight seasons between the Chuck LaMar Tampa Bay Devil Rays and the Ed Wade Philadelphia Phillies.
Next, I wanted to inspect how each administration’s winning percentage progressed by season. I created a boxplot of each team’s winning percentage by the executive’s season in the organization. I decided to stop the x-axis at eight seasons, because that is the longest time that an executive kept his job without making the postseason. It is also the first season in which over 50% of the front offices had been replaced, so it seemed like a reasonable stopping point. I also added a summary table of when each front office accomplished certain goals by season.


The median for winning percentage increases each season. There are likely two reasons for this event. The first is that any team that initiates a rebuild is at or near the nadir of their suffering and there is nowhere to go but up. The second is that there is a survivor bias. A front office that is underperforming expectations is more likely to be replaced and those teams do not appear in the boxplot to drag down the winning percentage calculation.
I find it interesting that the median for season four performance is exactly .500. This appears to be the make-or-break season for if a rebuild is deemed a failure or a success. Out of the 23 administrations that eventually made the playoffs, only five made the postseason for the first time after their fourth full season running baseball operations. However, it is worth mentioning that two of these regimes did eventually win the World Series. The Dave Dombrowski Florida Marlins won in his fifth full season at the helm and the Dayton Moore Kansas City Royals won the pennant in his eighth full season and the World Series in his ninth. These two cases provide hope for slower developing rebuilds, but most can be considered a failure after four seasons if there has been no significant progress at the major league level.
Of the nine current administrations that inherited a rebuilding team, there are only two that have not made the postseason: the Pittsburgh Pirates and the Baltimore Orioles. They also happen to be the only two teams that have not reached the critical fourth season. Only time will tell if these rebuilds will be considered a success, but they both still have a long way to go, and the clock is ticking.
More of my work can be found at my website or on Twitter.
So how do current teams, such as the Giants, fit into the scenario you are entertaining/
Zaidi’s first season with the Giants was 2019. The Giants won 73 games in 2018, so they just missed my cutoff of 70 games, but 2021 would be year 3 in the rebuild using my methodology.