Properly Diving Into Expected Stats
“This player is having a good year, but his xwOBA is slightly lower than his wOBA, therefore he’s going to get worse.”
This is a common concept you’ll hear within the baseball analysis community. With the data made available to us, it’s easy to come to conclusions like this. However, it’s not always about the data made available to us, but the analysis that comes from it.
To better grasp how this “problem” of data analysis came to fruition, let us go back in time.
Starting in 2015, the public was provided with Statcast metrics for MLB players via Baseball Savant. Among those stats were exit velocity, launch angle, hard-hit rate, pitch velocity, sprint speed, and, to be honest, practically anything that can be measured! It’s a fabulous website that provides very useful information we should be exceptionally grateful for.
The most popular metrics on the website, however, are their expected stats: expected batting average (xBA), expected weighted on-base average (xwOBA), expected on-base percentage (xOBP), expected slugging percentage (xSLG), and expected isolated power (xISO). Essentially, these statistics are what you’d expect based on the name; they indicate what a player’s “true talent level is” based on the quality of their contact, frequency of contact, and, depending on the batted ball, sprint speed.
This would appear to be a gold mine on the surface. With the ability to know what numbers a player deserves to have, we should be able to separate their talent level from outside circumstances, and thus better predict future performance. Yet that actually isn’t the case.
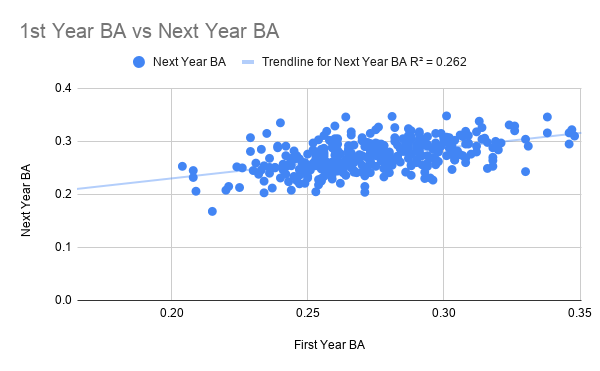
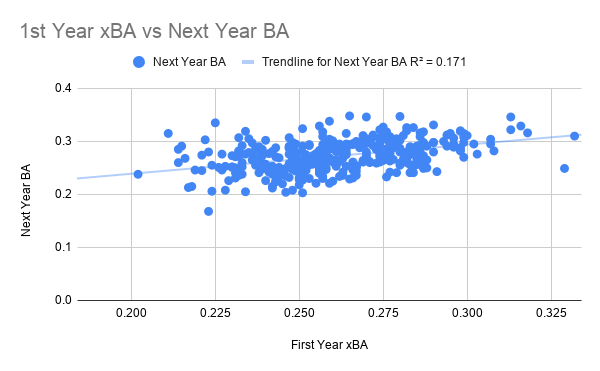
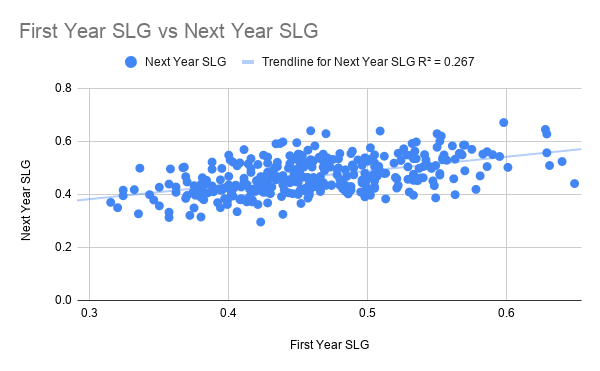
These charts, using data from 2015-19, suggest that expected stats are not more predictive of future success than actual stats.
Batting Average vs. xBA:
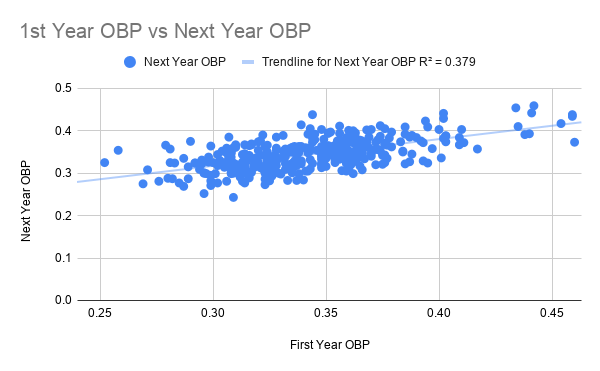
On-Base Percentage vs. xOBP:

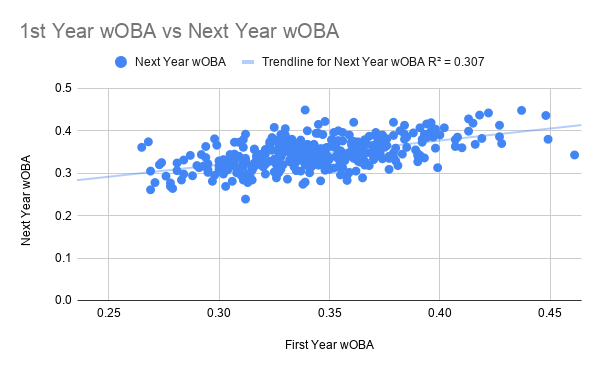
Weighted On-Base Average vs. xwOBA:

Slugging Percentage vs. xSLG:

Isolated Power vs xISO:
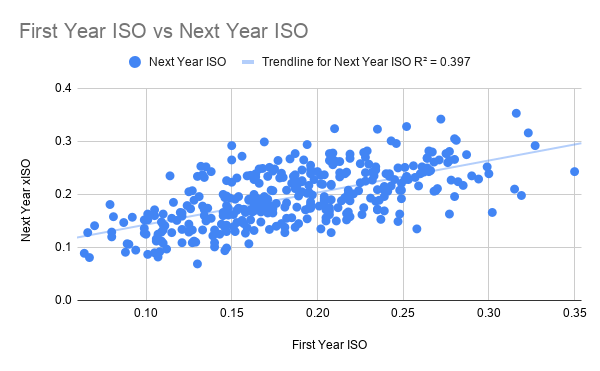

As you can see with the coefficient of determinations (r^2), a player’s success in an upcoming season can be better explained by their actual numbers than expected numbers from the past season in every key area. While the gap is minimal, if expected statistics were meant to help us project a player’s future production, then you’d expect that regression to be more clear. As it turns out, this was never the goal of expected statistics according to Tom Tango, Senior Database Architect of Stats for MLB Advanced Media in a 2018 article from Jonathan Judge at Baseball Prospectus:
“Tango then stressed that the expected metrics were only ever intended to be descriptive, that they were not designed to be predictive, and that if they had been intended to be predictive, they could have been designed differently or other metrics could be used.”
For what it is intended to do, which is try to separate a player from extenuating circumstances and tell the story of a player differently, expected stats have accomplished their job. Asking it to do more than that (predict future success) would be asking too much based on the purpose of the metric when formulated, which is evident in the data.
Using Peripheral Metrics
Another potential problem with expected stats is that, similar to Wins Above Replacement (WAR), any metric that tries to tell the complete story of one player on its own is going to lack context for proper analysis. Rather, when projecting future success and analyzing a player’s ability, how the number is generated would be more useful:

For projecting batting average, it appears that quantity of contact matters much more than quality. While there was very little correlation between hard-hit rate and batting average, in addition to just a small correlation between sweet spot rate and batting average (r^2 = 0.04), the correlation between strikeout rate and batting average (r^2 = 0.21) was much larger. Considering that this gap only grows larger when projecting future batting average, based on the stability of strikeout rate, it would appear that this would be the best peripheral metric to use. Why would this be the case? Well, if luck on batted balls is volatile, having as many shots at potentially getting a hit likely increases your floor much more. It’s also worth noting that softer hit balls, such as flares and bloopers, end up as hits much more often that typical quality of contact would lead you to believe.
We’ve known that walk rate is a very stable statistic, so it’s not surprising that it remained a much better predictor of future on-base success than batting average, which is much more volatile and subject to luck. Meanwhile, power itself is generally stable, but the key statistic to look at is barrel rate. There is a quite strong relationship between barrel rate and future home runs (r= .609), and this only becomes more significant when looking at power output just in that season (r= .775). Whereas exit velocity or launch angle tell you very little on their own, barrel rate combines the two by looking at the rate of balls hit hard and at optimal angles. In my opinion, it’s the premier metric available Baseball Savant.
With that in mind, when trying to project a player’s overall success, combining plate discipline and barrel% would appear to be the best way go about it without factoring in past success. In fact, Eno Sarris of The Athletic wrote recently that chase rate and barrel rate improvements were a great way to assess the legitimacy of a player’s “breakout” in a given season; it’s a relatively easy rule of thumb that can give an edge over your opponents in fantasy leagues.
Meanwhile, sprint speed and home plate to first base times were equally predictive of stolen bases, though there’s obviously much more to the puzzle when it comes to stealing bases than simply speed.
A Note on Pitcher xStats
There has been much more coverage on the predictive nature of expected statistics for pitchers, but to provide background:
- Fielding Independent Pitching (FIP) projects a pitcher’s ERA based on strikeouts, walks, and home runs allowed — the three true outcomes they should be able to control.
- xFIP is very similar to FIP, but provides a standardized home run to fly ball rate, as home runs allowed tend to be a much more volatile metric.
- Skill Interactive ERA (SIERA) is very similar to the former two but adjusts for the type of ball in play.
- xERA is essentially a pitcher’s xwOBA allowed.
For more on the predictiveness of these metrics, I recommend checking out this fabulous piece by Dan Richards at Pitcher List. To summarize, FIP has the best correlation to ERA in a given season, but when looking at the overall predictive ability, xFIP and SIERA remain slightly supreme. Yet at the end of the day, the premier metric when predicting future success is none other than strikeout to walk ratio. It may seem old fashioned to continue to simply look at K-BB, but with quality of contact being much more volatile for a pitcher and subject to the hitter, you can get a great idea of the quality of a pitcher simply by the amount of strikeouts he has versus the amount of walks he allows. Oftentimes, simplicity should be welcomed!
How To Project For The Future?
If expected statistics don’t have much of a predictive nature, how do we project a player’s future success?
This may seem overly simplistic, but it really all comes down to projecting off of past performance! There are plenty of projection systems (ZiPs, Steamer, The Bat X) that do an excellent job of forecasting a player’s production based on what he’s done in the past, and if you want to make projections on your own, I recommend following Tom Tango’s Marcel Projection system. It essentially uses a weighted average of a player’s production over the past three seasons, regresses to the mean, has an age adjustment, and has actually proven to continue to be as predictive as other projection systems.
Once you have a large enough sample size on a player, previous batting average, on-base percentage, weighted on-base average, home runs, and stolen bases are the best way to estimate what a player will accomplish in an upcoming season. There’s a lot of variability in surface-level statistics from one year to the next, but if you’re taking a weighted average of multiple seasons, that matters much less. Remember, baseball features a 162-game season, and is thus an inherently large-sample-size sport.
What To Do In a Given Season?
A player could always be on the cusp of a breakout, making projections much less useful, even if they attempt to adjust for rest of season projections.
We are always gaining new information on players, and this is where expected stats can be more useful. However, since the main curiosity generally involves grasping the legitimacy of a breakout season, looking at the stable peripherals we talked about helps with that. If a player is striking out less, chasing less, walking more, has seen his barrel rate increase, or has increased his speed, those are generally strong indicators of future production in various categories. For pitchers, looking at who is generating called strikes and whiffs would be the most beneficial.
Most of all, the key is to assess why the breakout is happening. Has the hitter made a swing change? Is this part of his expected developmental track? Has he adopted a new approach? Is a pitcher experiencing a velocity increase? Has he changed his pitch mix? These are the ways a projection system can falter, and most importantly, indicate that a player’s true talent level has changed. Taking that into account is critical.
Overview
What we should we take away from this?
While expected statistics are a very interesting descriptive metric, they aren’t meant to be predictive of future success. Statistics are best when used in the way they were designed to be, and these metrics don’t differ.
At the end of the day, every baseball player is unique. Some hitters naturally run higher batting averages on balls in play, while some pitchers naturally suppress home runs better. We haven’t been able to peg exactly how this is the case, but the mystery is part of the beauty of baseball! Over time these skills become a common trend, and once a player has developed enough of a sample size, there’s no reason to expect regression to suddenly hit him.
Conversely, when a player first comes up to the major leagues and projections have a much higher degree of error, it is much more useful to look at expected statistics and be more skeptical of players who don’t fit the grain in terms of general accumulation of production. These unusual skills take a lot of time to become statistically significant, so you always want to account for the higher range of outcomes with inexperienced players.
At the end of the day, baseball is a sport with plenty of data, so unlike football where peripheral metrics such as PFF grades are more predictive of future success than past success, we don’t have that problem outside of a few clear outlier seasons. When analyzing candidates for regression, looking at track record rather than xStats would be better. xStats mainly help for those who don’t have multiple years of production, and even then, we have minor league stats and peripheral numbers that might be more useful (barrel%, plate discipline).
As the late Dennis Green, former NFL head coach of the Vikings and Cardinals, once said, “they are who we thought they were.” Hopefully, in the future, we can apply this methodology with baseball players in an attempt for more contextualized and thorough analysis.
More of my work can be found at mvpsportstalk.com.
fantastic article. someone had to say this because too many people use xwOBA etc like it’s god. use it like god for descriptive purposes but not predictive.
On the pitching side, I think looking at things at a macro scale can be misleading on certain pitchers as was done in the Pitcher’s List article. There is a lot of noise in baseball data in general. The noise in quality of contact allowed is going to dwarf the skill of most pitchers’ ability to control contact (LA mostly) weakening the correlation of xERA to future ERA. Considering xERA has a similar predictive capability to FIP for Y+1 ERA despite not weighting Ks and BBs, it is doing something right.
PCRA had promise as being part xERA and part xFIP as it weighted K%, BB%, and Barrels. In other words, using statcast data, but weighting K%, BB%, and Barrels similar to how xFIP does except swapping barrels for flyballs. However, the PCRA’s creator is now in the Astros front office.
The expected stats are designed to be environment-neutral, while the raw stats are not, so if you are simply using them for prediction, the expected tats seem to be at a disadvantage.
For example, if you want to predict the wOBA of a batter playing in a ballpark with a high wOBA-PF, the wOBA that incorporates the effect of the ballpark is likely to be better than the xwOBA that removes the effect of the ballpark.
You are definitely correct. To exaggerate the point: if half the parks played like Coors and the other half played like the old Astrodome, then the actual stats will have an inherent advantage as players for the most part are not going to change home ballparks year to year.
While we’re nowhere close to this exaggeration, every little bit helps.
Marvelous explanation of expected stats. By far the best I’ve seen. Keep up the great work.
I agree to agree with other commenters. Excellent article. One I will save to read again.