Why Are so Many Runs Scored in the Bottom of the First Inning?
by gregstoll


June 17, 2021
After starting to look at some inning-by-inning data from my baseball win expectancy finder for another project, I stumbled across something weird that I can’t explain. Here’s a graph of expected runs scored per inning:
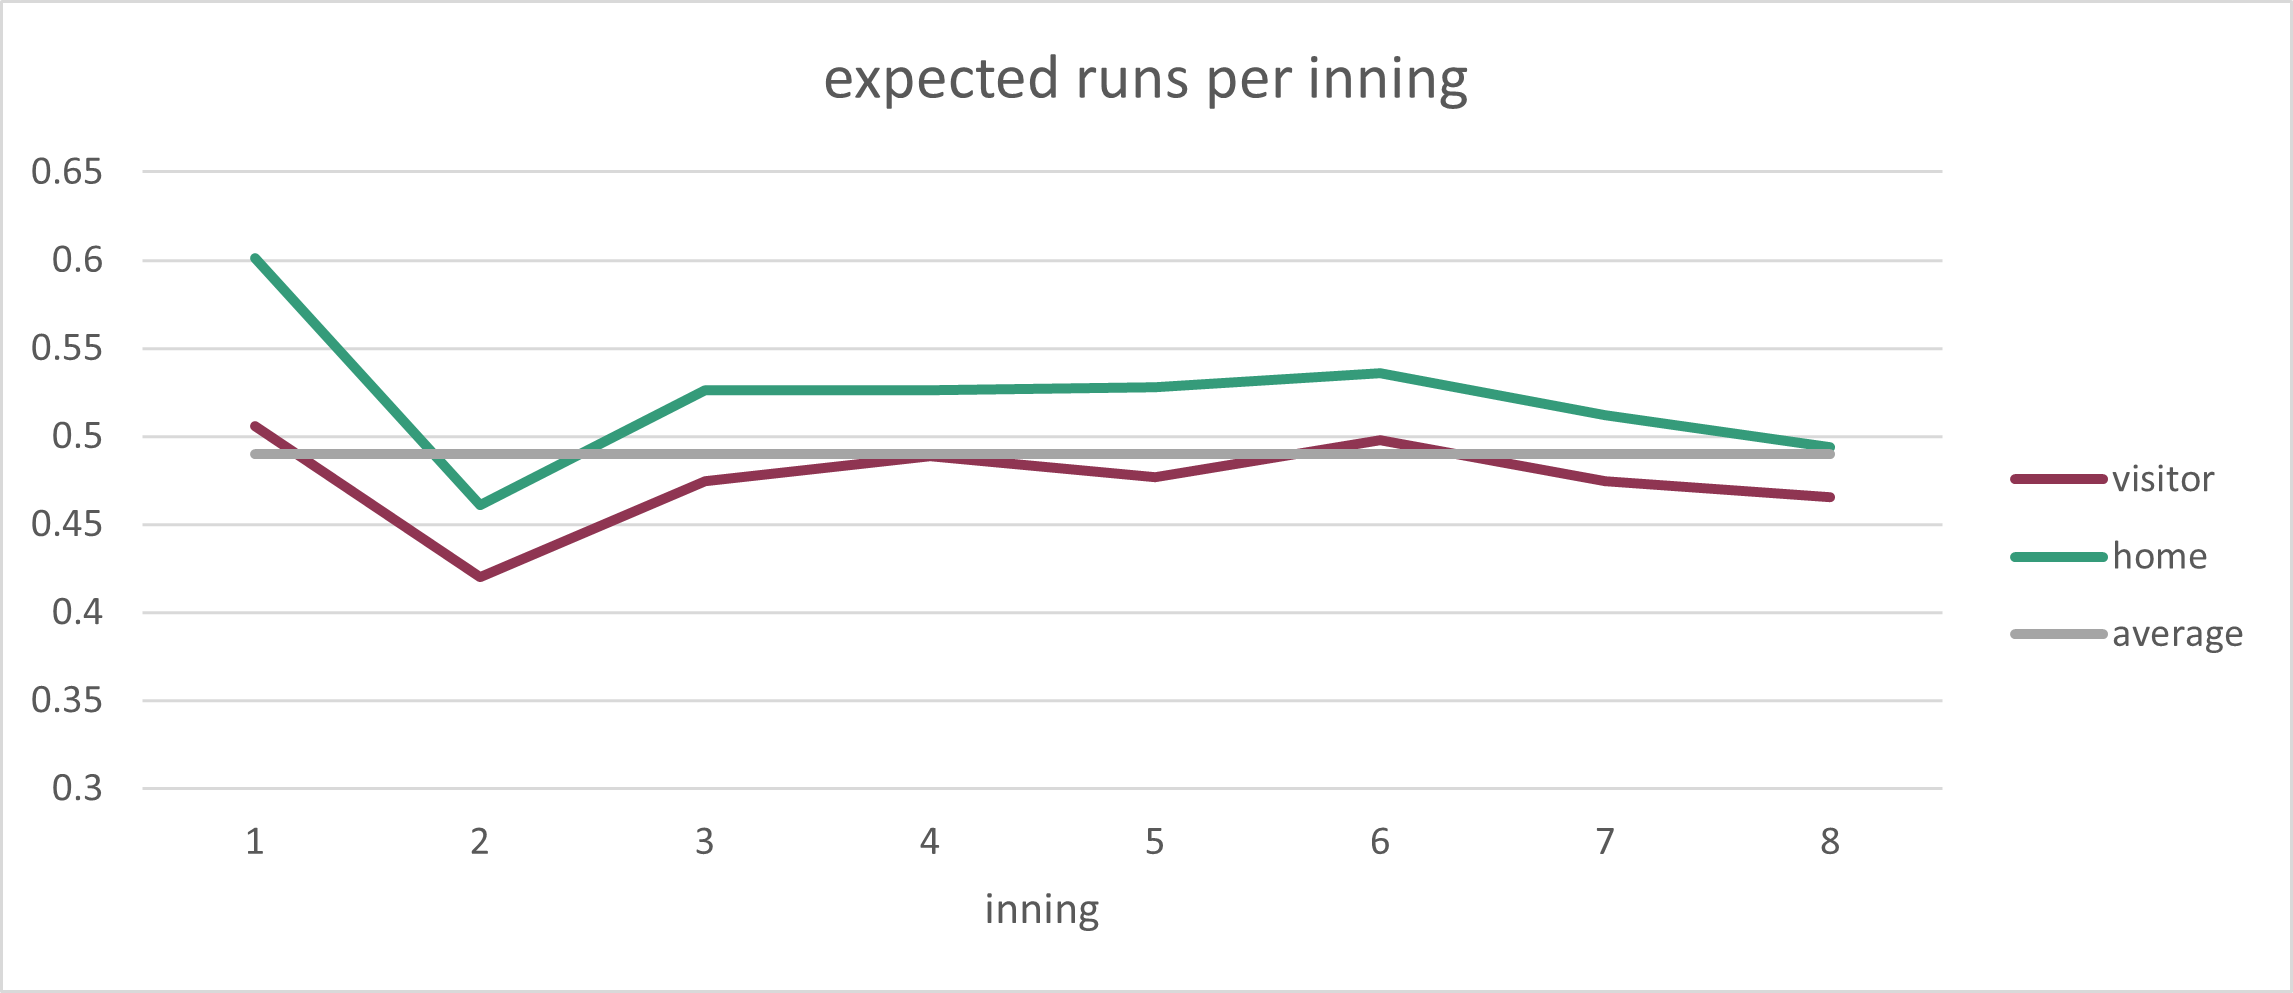
Check out how high the bottom of the first inning is. On average, 0.6 runs are scored then compared to 0.5 runs in the top of the first. That’s a huge difference! Let’s look closer:
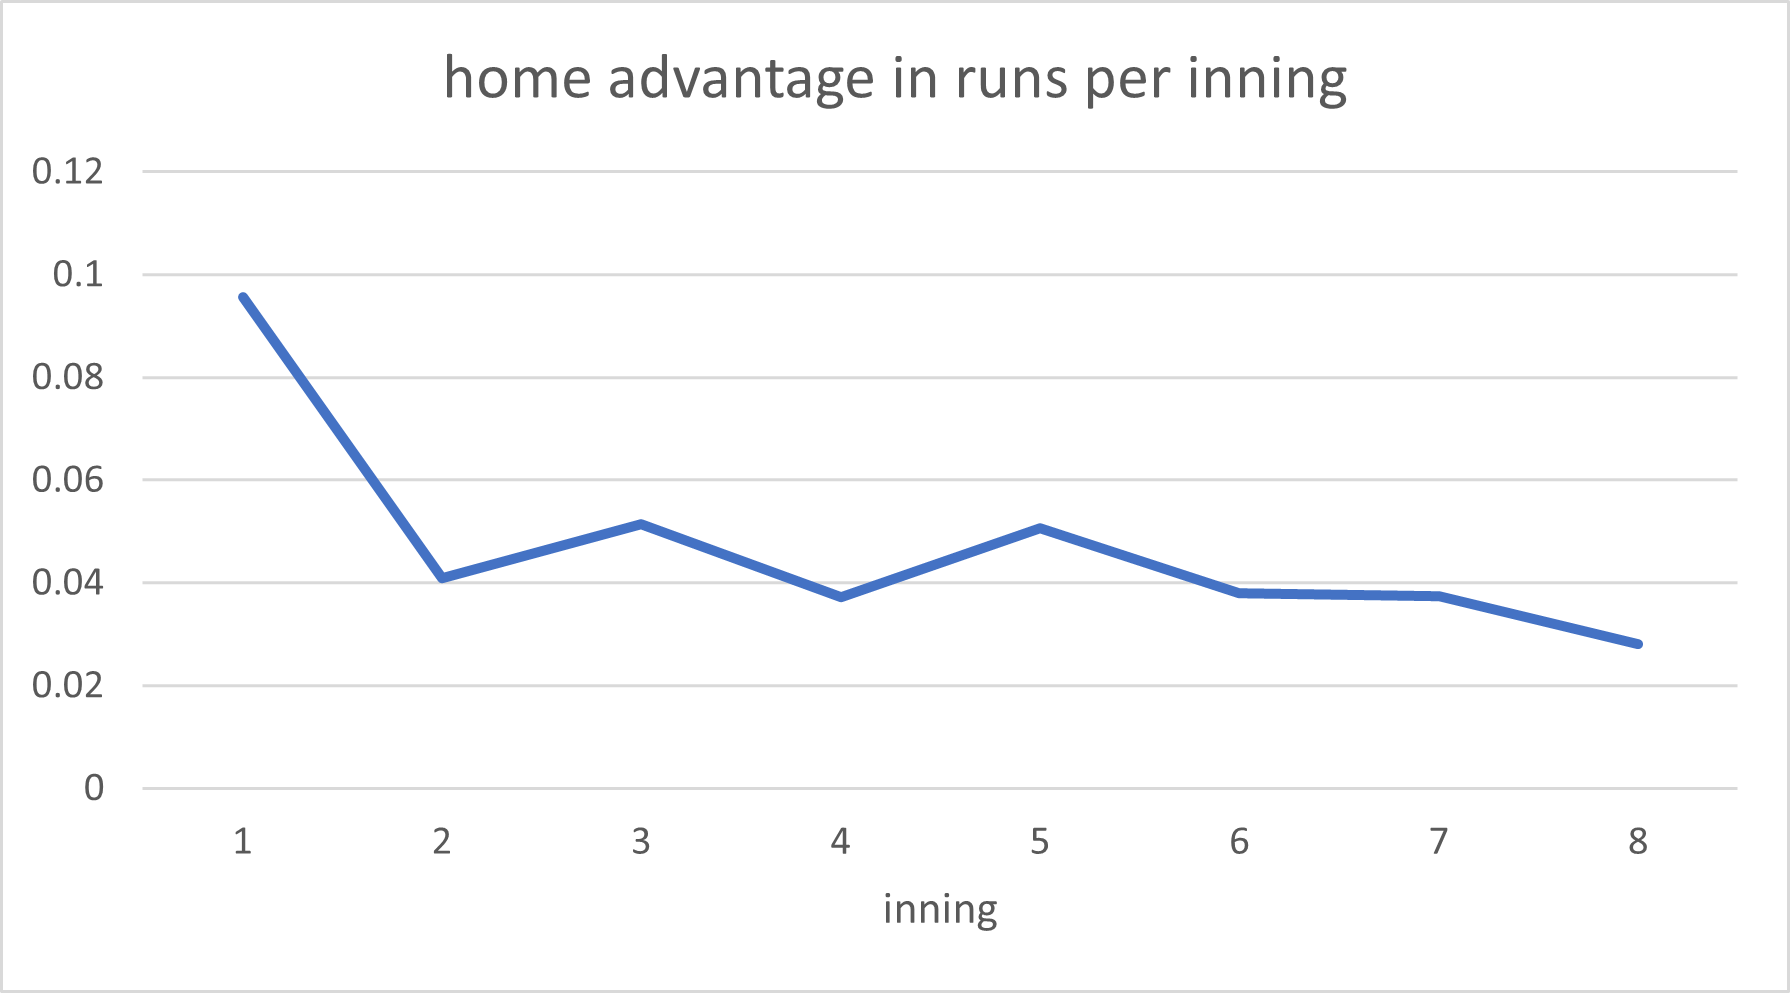
Holy outlier, Batman! So what’s going on? Here are some ideas: