Archive for Tampa Bay Rays

Who Is Yoshitomo Tsutsugo?

Image result for 筒香 嘉智

Last month, the Tampa Bay Rays signed Japanese slugger Yoshitomo Tsutsugo (筒香 嘉智) to a two-year contract for $12 million. If you add the $2.4 million posting fee paid to the Yokohama Baystars, Tsutsugo’s team in the Japanese League, that would make the Rays’ investment at $14.4 million total for two seasons. The 28-year-old left fielder has been expressing his ambition to play in the majors for years, and he finally found the team to play for. Now the question is who this guy is and how he will fit.

Background

Tsutsugo has been one of the top prospects of Japanese baseball since his younger days. He was one of only two freshmen to hit cleanup in his high school team’s history. In his sophomore year, Tsutsugo led his team to the semifinal in Koshien, the biggest high school baseball tournament in Japan, with a .526 batting average, three home runs, and 14 RBIs in three games. It gained him enough attention to play on his country’s national team. In 2009, Tsutsugo was drafted by the Baystars as the first pick in the Nippon Professional Baseball (NPB) League.

Tsutsugo struggled in Japan until 2014. He struck out too much, and frequent injuries prevented him from playing full-time. Until 2014, he only had one season with more than 100 games played (NPB plays 144 per season). However, Tsutsugo started filling up his minimum at-bats, and his OPS has been over .900 every year since. The peak was 2016, when he hit 44 home runs in 133 games with an OPS of 1.110. He also played for Japan in the 2017 World Baseball Classic as the cleanup hitter and proved his power with three home runs and a .680 SLG in seven games. Throughout his nine-year career in Japan, Tsutsugo hit .285/.382/.528, good for a .910 OPS. The average OPS during that time was around .680 to .720. Yokohama’s superstar was truly one of the league’s elite power hitters. Read the rest of this entry »


The Giants’ Not-So-Shiny New Toy

The Giants made a big splash by acquiring Evan Longoria, owner of three All-Star nominations, three Gold Gloves, a Silver Slugger, and the 2008 AL Rookie of Year. I will come right out and admit that I have hardly spent any time thinking about Longoria at all through his 10-year career. As a fan of an NL West team, the Rays are about as far away from my realm of focus as you can get. Throw in the fact that they are a small-market team dwarfed by the Yankees and Red Sox, and Longoria simply hasn’t made a huge impression on me.

After reacquainting myself with his player page, I realized how much I have been missing. Longoria has amassed almost 50 WAR in his career so far, placing him on the bubble of many Hall of Fame stats despite being only 32 years old. He has avoided any disastrous seasons, as his lowest WAR total was 2.2, and that came in a 2012 season when he only played in 74 games. Almost as impressive as his WAR totals – that 2012 season has been the only season in 10 years that he missed significant time due to injury. In the past five years, he has played in more games (798) than anyone in the MLB. He has been the epitome of health and consistency for a decade.

Longoria has earned his value by being very well-rounded. He provides significant value with his bat, as his career wRC+ mark of 123 matches up with the likes of Yoenis Cespedes, Jose Altuve, and Mookie Betts, all extremely accomplished hitters that have yet to enter their late-career decline phases. As the three Gold Gloves imply, Longoria is also an impressive fielder, with career marks of 75 DRS and 89.1 UZR. While not a massive base-stealing threat, he has shown enough speed and baserunning intelligence to provide slightly above-average baserunning value. Simply put: the dude is good at playing baseball, and he’s been proving it for an entire decade now.

As impressive as that resume is, the Giants don’t get to enjoy any of his past accomplishments. They didn’t trade for 2008-2017 Evan Longoria, they traded for 2018-2022 Evan Longoria. So now the question becomes: Is Evan Longoria still good? Jeff briefly touched on this immediately after the trade, but I wanted to take a deeper look.

At 32 years old, he is past the typical peak years for most baseball players, and in Longoria’s case, he already sustained a pretty clear peak over his first six seasons (ages 22-27). As Jeff noted, he put up a wRC+ of 135 during this time; compare that to his four seasons since then (ages 28-31), when his wRC+ has dropped to 108. Don’t get me wrong – 108 is still good! It’s just not the elite All-Star player we saw at the front of his career. His defense has followed the same trajectory, as he put up +79 DRS and +78.4 UZR over his first six seasons, then dropped to -4 DRS and +10.7 UZR over his last four seasons.

This is a familiar story: good baseball player gets older, becomes worse baseball player. But it’s so familiar that it can also be a trap – Longoria might end up following the Adrian Beltre career path, who posted a 6-WAR season at 37 years old. Looking at the numbers, though, I just can’t make myself believe that Longoria is anything more than a useful starter right now, and one that will shortly become a below-average player.

Longoria’s strikeout rate immediately jumped out to me, as he only struck out 16.1% of the time last year, setting a new career low, almost 4% below his career average. This is promising! In an era of increasing strikeouts, Longoria is figuring out how to put more balls in play, giving him more chances of getting on base. Of course, this line of thinking requires that he is trading strikeouts for quality batted balls, and considering his ISO last year sat 50 points below his career average, it didn’t look like this was the case. After digging deeper into some plate discipline numbers, it became very obvious to me what was happening.

2013 was Longoria’s last star-caliber season. The following year, his wRC+ dropped from 132 to 105, with a corresponding spike in Swing%. All of a sudden, Longoria was much more aggressive, swinging at more pitches both inside and outside of the zone. And especially in 2017, he seemed to be focusing intently on putting the ball in play, with a large spike in Contact% despite seeing the 2nd lowest Zone% in his career. Some people are able to cut strikeouts by controlling the strike zone better, but it looks like Longoria was cutting strikeouts by swinging more often and making poor contact on bad pitches. Consider his batted-ball distribution:

The first big red flag here is the red line along the bottom. Once again, starting in 2014, we start seeing a worrisome trend as he began hitting more and more infield flies. All his improvements in strikeout rate are erased here, as infield flies are essentially automatic outs and are just as bad. The other interesting tidbit in this graphic is the interplay between his GB% and FB% the past two years. Longoria had a mini-offensive resurgence in 2016, and it looks like that can be attributed to him lifting the ball more often. In 2017, he lost all of his FB% gains and then some, driving more balls into the ground than ever before.

Jeff also touched on the relevant Statcast data. Longoria’s exit velocity dropped significantly last year, as did his rate of barrels and xwOBA. There was nothing fluky going on for Longo in 2017 – he was swinging more often but making worse contact, and more of his batted balls were either going into the ground or popped up in the infield.

Is a turnaround completely out of the question? Of course not, nothing is out of the question. Perhaps a change of scenery will provide a spark for the 32-year-old. Perhaps he will be motivated to prove to the baseball world that the Giants made a good trade, and he will work harder than ever to make it back to All-Star levels. Even if he simply sustains his current production, he is still a 2-3 win player right now. But the Giants need more than that, and we’re already four years into a significant decline for Longoria. Both his bat and his glove are on the wrong side of the age curve, and it looks like the Giants just added another expensive, aging veteran to throw onto the pile.


Alex Cobb Will Be One of the Gems of This Free Agent Class

Of the pitchers hitting the free-agent market this winter, Alex Cobb is not likely to receive the most fanfare.

Aces Yu Darvish and Jake Arrieta will command contracts north of $100 million. Closers Wade Davis and Greg Holland will do their best to secure four-year deals with big price tags. The whole world is watching every development in the Shohei Ohtani saga. Hell, among midmarket starting pitchers, MLB Trade Rumors predicts Lance Lynn to receive a more lucrative contract than Alex Cobb.

Cobb, who broke in as a full-time starter with Tampa Bay in 2012, has historically shown great promise and good-but-not-great results. He averaged 2.5 fWAR from 2012-2014, lost the next two seasons to Tommy John surgery, then came back with a 2.4 fWAR season in 2017. Cobb has never started 30 games in a season, nor has he ever thrown 200 innings. These facts are concerning to some, but I would argue that he is one of the wisest investments one can make this offseason.

Alex Cobb has evolved as a pitcher through pitch selection. Cobb has a great curveball. You either already know that, or you’re about to find out. He also mixes in a four-seam fastball, a splitter, and a sinker. Right now, curveballs are all the rage in baseball, resulting in tremendous success for pitchers like Rich Hill, Trevor Bauer, and Lance McCullers. They throw their curveballs so often that we can consider the breaking ball, not the fastball, to be their primary pitch. Like Hill, Bauer, and McCullers, Cobb has a quality breaking ball, so it stands to reason he should throw it more often and perhaps eschew his mediocre offerings. With Brooks Baseball, we can track the usage rate on each of his pitches throughout the season.

Look at the first couple data points for the usage rates on his pitches, and then compare them to his points at the end of the season. It’s clear that Cobb began to realize he works best by using the fastball and the curveball exclusively, so he increased his usage rate on those pitches and gradually phased out the splitter and sinker.

The question for Cobb is whether this was a good idea. In Cobb’s career, he’s only posted a strikeout-to-walk percentage (K-BB%) above 15% twice, and only ever so slightly so. He’s not bad in that regard, but it’s not where he makes his bread and butter. Fortunately for Cobb, he is one of the better pitchers in the league at inducing ground balls, which we know is favorable contact. The more grounders Cobb induces, the better he gets, and his curveball is a ground-ball machine. Consider the correlation between the rate at which Cobb increased his curveball usage and his ground-ball rate (GB%) throughout the season:

That’s a pretty strong correlation. It seems that Cobb is ready to join the Hills, Bauers, and McCullerses of the world and ride a high breaking-ball-usage rate to breakout success. Of course, it’s never going to be that easy for Cobb or anybody, but let’s go through one of his starts and parse what we can from the good and bad.

On September 4, Cobb pitched against a red-hot Minnesota Twins lineup and had one of his better starts of the season. His first batter of the game was second-half monster and fly-ball connoisseur Brian Dozier, and he managed to get him out on the first pitch.

It’s been proven that batters from the “fly-ball revolution” can be neutralized if you throw them high fastballs. These hitters are swinging up to lift the ball, but it’s difficult to put much lift on a high pitch coming in fast.

We’re going to focus on the curveball throughout this piece, but here is a fun fact about his fastball. Cobb’s heater sits at 92 MPH and had a spin rate of 2101 RPM this season, which seems pretty pedestrian. However, among starting pitchers with at least 100 batted-ball events involving fastballs, Alex Cobb’s has the 31st lowest exit velocity (87.1 MPH). To put this in perspective, that’s a better mark than James Paxton, Chris Sale, Max Scherzer, Jon Gray, Justin Verlander, and Luis Severino.

Cobb was smart to bait Dozier here, and he reaped the benefits with a first-pitch out to begin the ballgame.

In the second inning, we see Cobb pitching out of the stretch and unleashing a curveball that Ehire Adrianza buries into the ground. This will be the common theme today.

I mentioned earlier that Cobb doesn’t have the K-BB% of Chris Sale or Corey Kluber, so every once in awhile he walks batters. The common thought is that Cobb, who throws so many breaking balls, might end up behind in the count thanks to misplaced curves. Then, to get back in the count, he throws his 93 MPH fastball in the zone, which gets crushed by every hitter expecting it.

This would be a bad habit for Cobb to fall into, but he certainly didn’t in 2017. Consider the list of pitchers who threw the most curveballs while behind in the count this season (via Baseball Savant):There’s Cobb, in fifth place, not far behind Rich Hill himself. All five of these guys have great curveballs, so it makes sense for them to Trust the Process™ and continue dropping the hammer rather than submitting to doom and throwing a predictable fastball in the zone.

After walking the leadoff batter to start the third inning, Cobb knew Joe Mauer could make him pay. So rather than giving Mauer the fastball he wanted, Cobb began the at-bat by dropping a curveball for a strike that even froze the great Mauer.

This changed the whole at-bat, because now Mauer didn’t know whether Cobb would be coming at him with the curve or the fastball. Cobb took advantage of his opportunity, used the fastball to get him in an ideal 1-2 count, and then he went back the curveball and got Mauer to ground into a double play.

Cobb is comfortable throwing the curveball both behind in the count and with runners on base, so he can reap the rewards and induce quite a few double plays. That is an asset. Additionally, Cobb is comfortable throwing his curve from both the stretch (as we saw against Adrianza and Mauer) and from his big windup, as you can see here.

Eddie Rosario is a good hitter who made great strides late in the season, but even he found himself to be another ground-ball victim of Cobb’s curveball.

By the fifth inning, Cobb was almost through his second time against the Twins’ batting order. At this point, they weren’t sure whether to expect the curveball or the fastball, so Cobb was often ahead in the count. Here, he has Eduardo Escobar in a 1-2 count and throws a high fastball that Escobar swings right through.

Everyone in the park was expecting Cobb to throw the curveball to finish Escobar off. From a look at Escobar’s swing, it’s safe to say he was expecting a curveball himself. Cobb’s fastball isn’t necessarily anything special, but the way he uses it to pitch off the curveball can be.

With two outs in the inning, Cobb faced his 18th batter (which would complete his second time through against the opposing batting order). He quickly got Ehire Adrianza into an 0-2 count and then unleashed his best curveball of the night, which Adrianza pounded into the ground for another easy out.

At this point, Cobb had gone through the opposing order twice, pitched five innings, and only given up one run. Teams around the league are beginning to realize that most of their starters simply shouldn’t go out for the third time through the order, even if they are rolling. The Houston Astros just rode using Lance McCullers, Brad Peacock, and Charlie Morton in tandems all the way to the World Series. Those three guys are valuable pieces, and if Cobb is utilized liked this, so is he.

Unfortunately for Cobb, his pitch count was at 85, so his manager decided to bring him out for another inning. The Twins got their third look at Cobb, and I don’t need to cite the statistics to you about what happens at this point. Hitters are smart, so they can pick up on the tendencies of a pitcher if they see him so many times. Alex Cobb, as great at he was through five innings and two times through the order, is no exception to this rule.

Here is Joe Mauer taking an 0-2 curveball from Cobb and driving it into the gap in center for a double.

The important question here is, “was that Cobb’s fault or just a good piece of hitting from Joe Mauer?” Of course, the answer in baseball is always going to be both, but you can see in the embedded GIF that Cobb doesn’t necessarily leave the pitch up. In fact, if you compare it to the curveball that Cobb threw earlier in the game to get Mauer to ground into a double play, it doesn’t look much different — maybe an inch or two higher, at worst. The bigger change is Mauer, who swings like a guy fighting to stay alive in the first GIF, then like he knew exactly what was coming and how to handle it in the second.

This is the “third time through the order” effect in a microcosm. Pitches that fool batters earlier in the game become cookies, so the key is to relieve your pitcher while his pitches still fool the batters. Cobb should not be penalized by us for giving up a double to Mauer there; in 2018, analytical teams will be bringing in a new pitcher in these situations.

In this sense, Cobb is the first free-agent test case for the newest pitching trend in the industry — the tandem starter — one who pitches twice through the order, hopefully gets 15-18 outs, and then gives way to someone else. The Mets, who hired progressive Indians pitching coach Mickey Callaway to be their new manager, have made it clear that all starters not named deGrom or Syndergaard will be shielded from facing lineups more than twice in a game. Baseball has never experienced a shortage of five-inning pitchers in its history, but these changes in pitcher usage are leading to new premiums for these specialists.

It’s as simple as this: every team wants to stock their pitching staff with Alex Cobbs. To be clear, every team wants a Justin Verlander, but there is only one Justin Verlander; even horses Chris Sale and Corey Kluber showed significant wear and tear in October. To combat this dilemma, the Houston Astros deployed Lance McCullers, Brad Peacock, and Charlie Morton in five-inning tandems and rode them all the way to the last out of Game 7.

I expect Alex Cobb will fit into this role quite nicely for whichever team he signs with.


Merrill Kelly: A Mid-Rotation Starter in Korea

How many teams are looking for a cheap starting pitcher to be a veteran presence for a young rotation? Looking for an upgrade over what they currently have for starting pitching? Or just need a warm body to fill the hole left by Joe Ross with someone not named Edwin Jackson? As far as I can tell, 10 teams are looking for a 3/4 starter such as Merrill Kelly, especially considering his stats that he has accumulated in this season (maybe he’ll get one more start to add to his excellent season so far) have been particularly impressive. All this when the Rays thought that Merrill Kelly was just a “AAA starter” who could be a bullpen guy in the big leagues.

Merrill Kelly in the minor leagues was a solid minor leaguer who would become a swingman with the Durham Bulls. In his age-25 season, he went 9-4 in 114 IP with a 2.76 ERA, a 3.74 FIP, and a 3.57 xFIP. Which looked good with his 8.53 K/9 and 2.92 BB/9, a .298 BABIP, and a 47.9% ground-ball rate as well. Perhaps he could a solid swingman/fifth starter in the big leagues. The Rays apparently thought otherwise and said either he’d be a bullpen pitcher for the MLB team or a starter in AAA. Merrill Kelly thought otherwise and went to South Korea to play for the SK Wyverns.

Merrill Kelly in South Korea was all right in his first season, with an 11-10 record in 30 games (29 starts), 181 IP, and an ERA of 4.13. With peripheral rates that weren’t as good (6.91 K/9 and 2.69 BB/9). His next season was similar, with a 9-8 record in 31 games, but a great 200 1/3 IP with similar rate stats: 3.68 ERA, 6.83 K/9, and 2.70 BB/9. This year has been very different for him, with a 15-7 record in 29 games and 185 IP with a 3.65 ERA; his rate stats are much more improved, at 8.90 K/9 and 2.14 BB/9.

What is he doing differently to get these improved stats? Why is his ERA as high as it is, despite getting more strikeouts and walking fewer batters? He is allowing more pesky little hits: that is, his defense is not getting as many outs made as it should (1.08 hits per inning this year, vs 1.03 hits per inning in 2015-2016 combined). He has also allowed one more homer and two more doubles than last year, in 15 1/3 fewer IP.

His repertoire:

-4 Seam Fastball – 92-94 MPH (back in 2015, he was throwing 88-91 MPH)

-2 Seam Fastball – couple of miles slower and has slight sink, and runs in an opposite direction. He mixes this pitch well with his fastball

-Cutter – He started to throw this pitch more once he got to Korea and has mixed it well with his other fastballs and change

-Slider – Has a good slider that can break sharply when he’s pitching well. About 83-87 MPH

-Curveball – Decent enough curve but probably not his best pitch. Up 78-80 MPH

-Circle Changeup – Good sinking and running movement. He throws it about 85 MPH. One of his top pitches

What has he improved? Velocity on his pitches, sharper movement to his fastballs and changeup, getting better with the cutter, and improving his control. (This quoted from this article on Reddit: Merrill Kelly scouting report and info, which I think explains his improvements, but I disagree with his assessment of Merrill Kelly’s talent.) Given the talent level of the average hitter in the KBO is around AAA level, he should be able to perform as around a low-3/high-4 starter, as I’d say he is better than the average starter. A funny thing of note is that the Rays have another version of Merrill Kelly named Ryan Yarbrough, who has pitched better than Kelly did at a similar age; hopefully they’ll give him a chance to prove the Rays wrong for letting Merrill Kelly go.

Since he is on the right side of 30 and will pitch the 2018 season at age 29, I’d offer him a three-year deal worth $6 million per year with incentives that could boost the value of the deal to around $24 million over three years, with an option for a fourth season at $7 million (buyout of $2 million) with incentives to boost the option value to $10 million. This is due to his risk, and likely lower than what Phil Hughes was offered after the 2013 season from the Twins.

Who are the 10 teams that could use Merrill Kelly as a starting pitcher? The answers might be more surprising at first glance than other answers. The best choice would be the Miami Marlins for the same reasons listed, but it could become a wild-card contender taking a chance for Kelly to make more money in a playoff cut. The second-best choice is one that is pretty questionable, depending on whether the Nationals are willing to take a risk on a player from the KBO and whether they want someone better than him. But he’d be great for them in place of Joe Ross, and would be an upgrade over their current options; plus he would be cheap enough to fit in their payroll. One issue is that the Nationals have a hitter-friendly park, but not having to face the Nationals would mitigate some of those concerns. The San Diego Padres would be the third-best choice due to the non-DH league, an extremely pitcher-friendly park according to MLB park factors, and multiple available rotation spots, but they are in a tough NL West and aren’t likely to be a playoff team.

The next one is questionable but they would certainly be able to make room for him — the Oakland A’s have always been unconventional, and the park is usually known for being pitcher-friendly. The Twins would be similar to the A’s in those respects and are in fact a playoff threat (I didn’t expect to be saying this about the Twins this year at all). The Royals are practically in a tie with the Twins and A’s due to a pitcher-friendly park, although their team is going to be worse due to many key players leaving (Cain, Hosmer, and Moustakas).

Despite the Rangers having a definite hole in the rotation (who would let Nick Martinez or A.J. Griffin start in an extreme hitter-friendly park?), they are the seventh-best option due to that park, the DH league, and just not having a great team in general. The White Sox are an even more extreme version of the Rangers, and are extremely bad as well; I doubt he’d want to play for such a poor team. Same with the Reds, except there is no DH, but the Reds might want to give younger options a try first. The Orioles have almost all the bad factors: A league with a DH, a hitter-friendly park, a tough division, a bad defensive team, and generally bad development staff that has done more harm than good for its pitchers.

I would love to see one of the top six teams sign Kelly to a contract, since those would be best for him getting another contract after the first one expires. Can’t wait for him to get his shot in the big leagues, to prove his previous doubters wrong, and to have a long and successful career in the MLB.

All stats are owned by their respective owners (ESPN, FanGraphs, KBO, Reddit), I own none of the stats used. All stats are as of 9-23-2017.


Kiermaier Takes Guaranteed Cash, Rays Upgrade Asset

Center fielder/sabermetric superstar Kevin Kiermaier signed an extension with the Tampa Bay Rays for 6/$53.5M this week. Dave Cameron of FanGraphs notes that he will receive roughly $30M for three arbitration seasons and $12M per year for three free-agency seasons. There will also likely be a $12M team option. Cameron’s article, while rightfully criticizing Major League Baseball’s flawed arbitration system, will run counter to my argument. Kiermaier is an excellent player, no doubt – a defensive whiz, a great base runner, and a league-average bat to boot. One thing that is not on his side is age. Kiermaier will be 27 this season, would have been 30 in free agency, and will be 33 or 34 when his contract is over. Much of Kiermaier’s value is derived from his defensive prowess; he has recorded a 44 UZR for his work in center field in his career. While this is impressive, the precedent for Kiermaier to continue this excellence through his free-agent years is unlikely. Let’s consider the center fielders of the UZR era who have signed significant free-agent contracts.

Major Free Agent Center Fielders’ UZR

Player FA Age Contract CF UZR (Pre-Contract) CF UZR (Post-Contract)
Carlos Beltran 28 7/119M 16.1 15.1
Juan Pierre 29 5/44M 32.6 -0.8
Gary Matthews Jr. 32 5/50M 12.4 -24.4
Torii Hunter 32 5/90M 11.9 -17.7
Aaron Rowand 30 5/60M 46.2 7
Melvin Upton Jr. 28 5/75.25M 18.6 1.6
Angel Pagan 31 4/40M -1.5 -25.6
Michael Bourn 30 4/48M 51.6 -14.2
Jacoby Ellsbury 30 7/153M 28.9 -2

*data via FanGraphs

Here we see a list of center fielders with (mostly) fantastic defensive records before signing a free-agent contract around the age of 30. With the exception of Carlos Beltran, the youngest player on this list, every single one of these players’ defensive values in center cratered. All of them were or will be rendered unplayable in center before the expiration of their contracts. Kevin Kiermaier is a fantastic center fielder, but even he is no immortal among these men. With the stench of the Jacoby Ellsbury deal still fresh in the air, it is likely that most executives around the game will prefer developing defense rather than buying it.

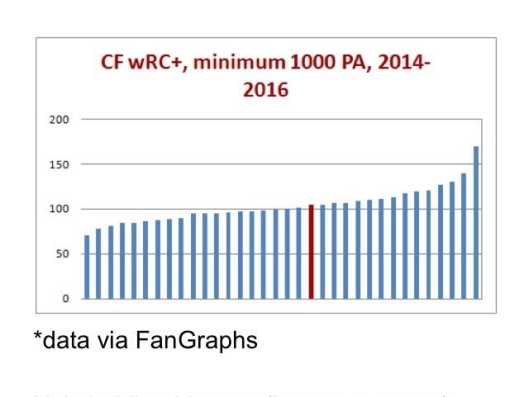
The Rays get to pay Kiermaier $24-36M for 3-4 free-agent seasons in exchange for the guaranteed money during his arbitration years, but if Kiermaier the hypothetical free agent isn’t going to be paid for his defense, is his bat really going to be worth 3/$24M or 4/$36M? Looking at Kiermaier’s place among center fielders with at least 1000 plate appearances in the previous three seasons, his wRC+ made him this red mark on the graph.

wRC+ chart

He’s holding his own (league average), and this is around where he has been for his whole career, but this is also supposed to be his prime. If this is the offensive peak (plateau?) of Kevin Kiermaier, it’s hard to imagine him creating $24-36M worth of value if the plateau crumbles around the age-30 mark.

While Kevin Kiermaier is a bona fide stud, it’s likely he will only be one until he reaches what would have been his free-agent years. By signing this extension, I believe Kiermaier increased his career earnings, while taking that money guaranteed. However, don’t presume that Tampa was reckless about the $24-36M they will allocate to Kiermaier over those last three or four years; precedents can be broken, and he is an awesome player. It’s also important to consider the new asset that Tampa upgraded to, a nice Adam Eaton-esque carrot to dangle in front of interested teams – seven years of control of Kevin Kiermaier.


Longoria Losing Power, Patience

For the first six years of his career, Evan Longoria was the best position player in baseball based on WAR (as FanGraphs calculates it). Despite losing over a season’s worth of games to various injuries during that time, his combination of tremendous hitting and elite defense at the hot corner made him a superstar when healthy.

Then 2014 happened. Injuries weren’t the issue, as Longoria played all 162 games for the first time, but his production cratered. He batted .253/.320/.404—well below his career averages of .275/.357/.512 coming into the season. He’d been so good up to that point, though, and he was only 28, so his off year appeared to be nothing more than a fluke. Surely Tampa Bay’s $100-million third baseman would bounce back.

He didn’t. His numbers improved slightly, to .270/.328/.435, but his 2015 was essentially the same as his 2014. Once again he was healthy, appearing in all but two games, making his struggles even more mystifying. That made two down years in a row for Longoria, in what were supposed to be his prime years.

Unless there’s a career-altering injury involved, great athletes typically don’t fall off a cliff in their late 20s. Oftentimes, they get better. They’re still young enough to be at their physical peaks, but also experienced enough to have acclimated to major-league competition. These are supposed to be an athlete’s greatest seasons.

For Longoria, they have been his worst.

Over the last couple years, Longoria has slipped from a great player to a merely good one, declining in all facets of the game. It’s been five years since he won his last Gold Glove, with defensive metrics suggesting he’s now closer to an average fielder than the vacuum cleaner he was previously. His baserunning has also fallen off considerably. Once an asset with his legs, he’s managed just 14 steals and provided negative value on the basepaths over the past five years.

Defense and speed peak early, however, so it’s not surprising that Longoria lost some of both as he approached 30. What’s concerning is how he’s become a league-average hitter after previously producing like David Ortiz.

A major red flag is Longoria’s plummeting walk rate, which has declined every year since 2011. Once a very patient hitter, he’s now drawing free passes at a league-average rate. Longoria’s chasing, and hitting, more pitches outside the zone than ever before, which explains both his eroding walk rates and hard-hit frequencies. When batters expand the strike zone, their swings become longer and generate weaker contact. After swinging at just a quarter of pitches outside the strike zone in 2013–tied for 20th out of 140 qualified batters–he’s chased over 31 percent of non-strikes each of the last two years, falling back to the pack in this department.

It’s no secret that older players become more aggressive to compensate for diminished bat speed, as they have to guess more often and start their swing earlier to catch up with fastballs. It could also be that Longoria is responding to an increase in first-pitch strikes. Whereas his first-pitch-strike percentage was below the league average every year from 2009-2013, he’s seen more first-pitch strikes than average over the past two seasons combined. When batters fall behind early, they can’t afford to be patient and are at the pitcher’s mercy. In 2015 the league hit just .225/.265/.344 after going down 0-1. Longoria isn’t much better, batting .234/.277/.388 for his career after first-pitch strikes. Since he’s seeing more of those, it follows that his numbers have nosedived. As for why Longoria’s seeing more first-pitch strikes, the larger strike zone is likely to blame, but pitchers also appear to be challenging him more often.

What’s really troubling, though, is Longoria’s evaporating power. After averaging 33 home runs per 162 games with a .237 ISO through his first six seasons, he’s averaged just 22 long balls with a .158 ISO over the past two. His doubles were down too, from 41 per 162 games to 31, so it’s not like he was just getting unlucky with his HR/FB rates (though he did post the lowest one of his career–10.8 percent–in both 2014 and 2015). He’s not trading contact for power, either, as his strikeout rates and contact rates have held steady.

The reason for Longoria’s diminished power is simple and one I alluded to earlier; he’s not hitting the ball as hard as he used to. After reaching a high of 41.5 percent in 2013, his hard-hit rate crashed to 32.1 percent in 2014 and 30.6 percent last year. Meanwhile, his soft-contact rate nearly doubled from 2013 to 2015. This data, along with his rising infield-fly rates (he popped up as often as he homered last year) and shrinking fly-ball distances, suggests he’s not squaring up the ball as well as he used to. That’s a side effect of hacking, to be sure, but also reflects his waning bat speed and exit velocity.

Recent studies have shown that position players are peaking earlier than they used to, closer to age 26, and it appears that’s what happened with Longoria. His seemingly premature decline has likely been accelerated by injuries suffered early in his career as well as the rigors of playing a demanding defensive position. On that note,  his career seems to be following the same path as David Wright’s. Both peaked early and were at their best in their mid-20s, looking like future Hall of Famers. Then their performance started suffering in their late 20s, because of injuries with Wright and the reasons outlined above with Longoria (both were hurt by their home parks as well). Wright has yet to recapture the consistent greatness he exhibited through his first five seasons and, should Longoria continue on his current trajectory, neither will he.


A Quick and Dirty Attempt to Find Justin Upton’s Trade Value

Players like Justin Upton aren’t usually available at the trade deadline. Upton ranks 35th in wOBA (.353) and 47th in WAR (8.9) between 2013 to the present.  Also of note, Upton is in his walk year.

So, how many players like Justin Upton have been traded in the past 10 years? I did a quick scan of deals made in June and July since 2005 and I found four similar players who were traded in their walk years.

1. Hunter Pence PHI->SF, 2012 (68th wOBA (.347) and 68th WAR (8.7), 2010-2012)

2. Carlos Beltran NYM->SF, 2011 (19th wOBA (.379) and 74th WAR (8.1), 2009-2011)

3. Matt Holiday OAK->STL, 2009 (4th wOBA (.410) and 6th WAR (18.2), 2007-2009)

4. Mark Teixiera ATL -> LAA (15th wOBA (.396), 17th WAR (14.8), 2006-2008)

The Mets received Zack Wheeler in return for Beltran and the Athletics received Brett Wallace in return for Holliday. Baseball America ranked Wheeler the 55th best prospect pre-2011 and Wallace was ranked 40th pre-2009. In the following years, pre-2012 and pre-2010, respectively, Wheeler was ranked 35th and Wallace was ranked 27th.

The Mets and Athletics did well in each trade. They received top prospects and non-deteriorating prospects (they were not losing value as prospects during the year they were traded for). This is evidenced by the ranking of Wheeler and Wallace in the season following the trade.

The Pence and Teixiera trades did not net the Phillies or Braves prospects. Each team received a major league asset, using “asset” in the loosest of ways.

The Phillies received Nate Schierholtz, who had totaled .9 WAR up to that point in 2012. They also received Seth Rosin, an A Ball pitcher, and Tommy Joseph, a AA catcher. Essentially, they received a replacement level player and organizational depth. 

The Braves received Casey Kotchman. Kotchman had totaled 2.1 WAR in 2008 with the Angels before the trade. He managed 3.7 WAR the year before. The Braves could not expect Kotchman to live up to his past billing (he was Baseball America’s 6th ranked prospect pre-2005), however, from the most optimistic perspective, they may have expected him to be worth 2 WAR per year over the remaining four years of team control. At least this is my best attempt to get in the head of the Braves’ front office seven years after the fact.

Now, I’ll attempt to determine Justin Upton’s trade value based upon these past trades.

Kevin Creagh and Steve DiMiceli published a study on Point of Pittsburgh that analyzed the value and future performance of prospects based on their ranking in the Baseball America’s Top 100 (the ranking was determined by the final appearance of the prospect in the rankings).  The article has a lot of information you should read regarding the dollar value of prospects and their potential to bust, but for purposes of this article, I am concerned with a prospect’s projected WAR over the six years of team control.

Hitters that rank between #26-50, which is Brett Wallace, project to have an average of 6.8 WAR. Pitchers ranked between #51-75 project to have 3.8 WAR. However, based on Wheeler’s fast rise up Baseball America’s list, I’ll factor in that pitchers ranked between #26-50 project to have 6.3 WAR. The average of the two is 5 WAR, which is the value I’ll place on Wheeler at the time the Mets traded for him.

Justin Upton is not Matt Holliday, circa 2009, and he is not quite Carlos Beltran, circa 2011, although he is much less of an injury risk than 2011 Beltran (who would go on to spend time on the DL for the Giants in 2011). Therefore, I project that the Padres should receive between 3.8-5.0 WAR in return for Upton. The return should scale up towards the higher side of that projection based upon an active and interested market for Upton.

Below is a list of potential Upton suitors and their prospects that appeared in Baseball America’s Top-100 rankings before the season began. The rank of the prospect is in parenthesis, followed by their Creagh and DiMiceli projected WAR. The prospects in bold represent the most likely return for Upton, however I included some prospects that are possibilities, but project to have more WAR value than should be expected in return for Upton.

Mets – Brandon Nimmo (45, 6.3), Dilson Herrera (46, 6.3), Amed Rosario (98, 4.1). I excluded Kevin Plawecki (63) and Michael Conforto (80) due to their major league role and rise to prominence, respectively. 

Pirates – Jameson Taillon (29, 6.3); Austin Meadows (41, 6.8); Josh Bell (64, 5); Reese McGuire (97, 4.1)

Cubs – C. J. Edwards (38, 6.3); Billy McKinney (83, 4.1)

Giants – Andrew Susac (88, 4.1)

Orioles – Dylan Bundy (48, 6.3); Hunter Harvey (68, 3.4)

Rays – Daniel Robertson (66, 5); Willy Adames (84, 4.1)

Royals – Raul Mondesi (28, 6.8), Brandon Finnegan (55, 3.4), Kyle Zimmer (75, 3.4), Sean Manaea (81, 3.5)

Twins – Jose Berrios (36, 6.3); Nick Gordon (61, 5); Alex Meyer (62, 3.4)

Astros – Mark Appel (31, 6.3)

A.J. Preller should feel (somewhat) vindicated regarding the Justin Upton portion of his winter experiment if he can get a player he likes that resembles the players on this list. However, it remains to be seen if he will chase after something safer, like the Braves in 2008, or squander an asset like the Phillies in 2012. In that case, he’s probably better off going all-in on the Padres he built for 2015.


In Which the Value of Kevin Kiermaier is Probably Grossly Overstated

Jose Abreu has seemed a virtual lock for the AL Rookie of the Year Award ever since Masahiro Tanaka went down with what could be a season-ending elbow injury. Abreu has done nothing but hit the hell out of the ball since storming into the Majors after fine-tuning his craft in Cuba. Rookies like Brock Holt and George Springer have had nice seasons of their own, to be sure, but they’re certainly no challengers to the might of Abreu.

Then, of course, there’s the best rookie that mostly nobody’s heard of. Let’s say hello to Mr. Kevin Kiermaier. A 31st round pick in 2010, Kiermaier fought his way through the minors and finally, after a single game appearance last year, was called up for good on May 17th. He’s since appeared in every game since May 31st.  In 57 games (198 plate appearances), he’s hit .311/.362/.544. More importantly, he’s produced a .391 wOBA and 157 wRC+. Those are certainly pretty numbers. But can he keep it up? Kiermaier hit well at almost every level in the minors, but was always known for his superb glove work. Let’s look at his and Abreu’s numbers together, shall we? All stats herein are as they were prior to the inception of action on Monday the 29th.

Player Games PA wOBA wRC+ HR K% UZR DRS fWAR
Abreu 91 393 .406 159 30 23.9% 1.1 -5 3.4
Keirmaier 57 198 .391 157 8 18.7% 10.5 8 3.1

Abreu is numerically the greater offensive producer, if only by a slim margin. He’s only out-produced Kiermaier relative to the league (wRC+) by two points, but his wOBA is indicative of the fact that he’s driving the bar a lot further (.619 slugging percentage versus Kiermaier’s .544). Yet while chicks most certainly dig the long ball, it isn’t everything.

Kiermaier’s .362 OBP is a fantastic mark. It’s about twenty points higher than Abreu’s, and it’s incredibly beneficial for his spot in the lineup. For all his famous lineup tinkering, Joe Maddon has been primarily using Kiermaier out of the 9 spot of late. He even went as far as batting the pitcher (Alex Cobb) eighth on July 23rd in an inter-league game against the Cardinals so that Kiermaier could bat ninth. Putting him there allows him to serve as what basically amounts to a second leadoff hitter when the lineup turns over, and there’s one more runner on base for the big boppers in the heart of the order.

Kiermaier also is much more of a two-way player. UZR and DRS are both very pleased with his defensive skill set. That’s not a surprise, as many scouting reports on Kiermaier always gave glowing reviews of his instincts and range in the field. It’s that defense that has allowed him to be right on Abreu’s tail in total value, in far fewer games. While UZR says that Abreu isn’t a total loss at first base, DRS says he leaves much to be desired. Naturally, first basemen traditionally aren’t employed for their gloves, but nobody complains when someone like Carlos Santana comes along and dazzles on both sides of the ball.

Now, the hard part. We want to extrapolate Kiermaier’s value over the same time span that Abreu’s accrued his, but how? It would be easy to simple do it over the same number of games played. However, “games played” doesn’t account for late-inning substitutions, or early exits. A better (but still not perfect) way of looking at it would be to extrapolate it over innings played. This is still not perfect, as a batter can hit in the top of an inning and then be replaced in the field in the bottom, and vice versa. However, I’m not a good enough statistician to develop my own metric for this (check back with me in a few months) and I can’t find anything out there to show just how much time a player has seen.

I used Baseball-Reference’s game logs for this, as they have a count of how many innings the player saw. Here’s how these numbers work out.

Player Innings Played PA fWAR fWAR/I
Abreu 812 393 3.4 ~ .00418
Kiermaier 464 198 3.1 ~ .00668

This is far from an exact science. Abreu and Kiermaier didn’t produce exactly that many wins every inning they plated, but it’s how the numbers work out. Now, if Kiermaier’s fWAR/I (fWAR per innings played) is multiplied by Abreu’s total innings played, the result is an fWAR total of 5.425. So far this season, Mike Trout leads all of baseball with 5.7 fWAR. Troy Tulowitzki is in second place with 5.1. That’s assuming, of course, that Kiermaier maintains his current level of play. And as I said before, “But can he keep it up?” The answer to that is “I haven’t a clue.” Here’s why.

BABIP GB% BA vs. RHP BA vs. LHP
.353 50.7% .336 .225

There are two glaring realities. One is that Kiermaier hits a lot of ground balls. His BABIP would seem to indicate that’s he’s getting lucky, and his grounders are finding holes in the infield. For what it’s worth, here’s the league leaders in ground ball rate out of everyone who’s qualified for the batting title. It’s a mixed bag for sure. There are some good hitters around Kiermaier’s range, like Yasiel Puig, Alexei Ramirez and Melky Cabrera. Derek Jeter’s made a heck of a career out of a high ground ball rate and good BABIP. So while that isn’t an immediate cause for concern, it’s something worth watching to be sure. For reference, here’s his Brooks Baseball spray chart on the year.

The other is that southpaws have completely owned him. While right-handers are more common (and Kiermaier certainly has no problem with them), in the age of specialized bullpens it’s one awful quality to have. Managers (and the think-tanks in front offices) are surely catching on to this. Eventually, the scouting report will read to get a lefty reliever to face him in high-leverage situations, if they can. This also, of course, could be a result of small samples sizes. Kiermaier only has 43 plate appearances against lefties, and 155 against right-handers. Another thing to keep an eye on going forward.

However, what Kiermaier is doing is not wholly unsustainable. Players have made livings on putting ground balls in the right spots, and good players at that. However, the projections for the rest of the season aren’t too pretty. ZiPS predicts that he’ll produce a .259/.312/.385 line for the rest of the season. Steamer has him at .257/.311/.382. The projection systems are generally not too far off from reality, but it’s fun to think about what could be. Will Kiermaier end up being a 5-win player? The odds aren’t good. It’s certainly possible, though, and if it does happen prepare yourselves for a wonderful offseason debate on whom the rightful winner of the Rookie of the Year Award really was. In the meantime, let’s marvel at how darn good this former 31st round pick has been.

Nicolas Stellini is a student, college baseball announcer, and amateur baseball writer. Check him out over at @StelliniTweets. 


The Impact of Defensive Prowess on a Pitcher’s Earned Runs Average

EXECUTIVE SUMMARY

  • This study attempts to determine how much the fielders’ prowess, measured by the metric UZR (Ultimate Zone Range), affects a pitcher’s Earned Runs Average.
  • The data used for the regression (collected from FanGraphs.com) includes collective ERA, BABIP, HR/9, BB/9, K/9 and UZR for every Major League Baseball team for the past three years.
  • ERA (Earned Runs Average) is the amount of earned runs a pitcher allows per nine innings pitched. BABIP (Batting Average per Balls in Play) is the batting average against any given pitcher, but only including the at bats where the hitter puts the ball in play. HR/9 is home runs allowed per nine innings pitched. BB/9 is walks allowed per nine innings pitched. K/9 is batter struck out per nine innings pitched. UZR (Ultimate Zone Range) is a widely used metric to evaluate defense. It summarizes how many runs any given fielder saved or gave up during a season compared to the league average in that position.
  • The model passed the F-test, the adjusted “R” squared came out at 91.2 percent and every one of the independent variables passed their respective t-test.
  • The model tested negative for both Multicollinearity (using Variance Inflation Factors) and Heteroskedasticity (using the second version of the White’s test).
  • The regression equation looks like this: ERA = -2.55 – 0.187 K/9 + 0.413 BB/9 +16.9 BABIP + 1.72 HR/9 – 0.00157 UZR. Even though the independent variable UZR has a low coefficient, it definitely affects a pitcher’s ERA, and in the way it was suspected. As the UZR goes up the ERA goes down.

INTRODUCTION

Since Bill James started to write about baseball in the late 1970’s and started to defy the traditional stats used to evaluate players, hundreds of baseball fans have tried to follow his footsteps creating new ways to evaluate players and defy the existing ones. One of the stats that has been brought to light lately is Earned Runs Average (ERA).

According to several baseball analysts ERA is not an efficient way to evaluate how good or bad a pitcher performs. The rationale behind this thinking is pretty simple; ERA is the amount of earned runs that any given pitcher allows per nine innings pitched, but the pitcher is not always 100 percent responsible for every earned run allowed. Sometimes, a fielder’s lack of defensive prowess will allow hitters to reach base safely (I am not talking about errors), and when it happens, rather often, those hits will translate into earned runs, thus affecting the pitcher’s ERA.

One of the metrics that has been used to determine any given fielder’s prowess is UZR (Ultimate Zone Range). UZR compiles data on the outfielders arms, fielder range and errors and summarizes the amount of runs those fielders saved or gave up during a season compared to the league average in that position. Using that metric along with other metrics that affect the ERA, we can answer the question “How much does defensive prowess impacts a pitcher’s ERA?”

If in fact defensive prowess affects ERA, we could also determine how much it affects it. With that kind of information, cost-effective teams (Tampa Bay Rays and Oakland Athletics) can help improve their pitching staff without investing heavily on new pitchers.

DATA

The unit of observation for this study is one Major League Baseball team. And the number of observations is 90. Currently, there are 30 Major League Baseball teams, so data was collected for the past three Major League Baseball seasons. So the time period covered goes from 2010 to 2012, including both seasons.

The dependent variable used in this project was Earned Runs Average, and the independent variables are as follow:

  • BABIP: Batting average per balls in play
  • HR/9: Homeruns allowed per nine innings pitched
  • BB/9: Walks allowed per nine innings pitched
  • K/9: Hitters struck out per nine innings pitched
  • UZR: Runs saved or given up by any given fielder during a season

All the data for this study is cross-sectional because all the observations have been collected at the same point of time.

All the data for this study was collected from the baseball website FanGraphs.com. FanGraphs is a widely known source of baseball stats and news, but the data they publish on their website is collected by another company called Baseball Info Solutions.

REGRESSION ESTIMATIONS

            Regression Analysis: ERA versus BABIP, HR/9, BB/9, K/9 and UZR

The regression equation is

ERA = – 2.55 – 0.187 K/9 + 0.413 BB/9 + 16.9 BABIP + 1.72 HR/9 – 0.00157 UZR


Predictor       Coef         SE Coef              T           P             VIF

Constant      -2.5474     0.5594        -4.55    0.000

K/9              -0.18718    0.02428     -7.71     0.000    1.099

BB/9            0.41261     0.04671        8.83     0.000    1.052

BABIP          16.914        1.876             9.02     0.000     1.741

HR/9            1.7222       0.1105          15.58    0.000    1.180

UZR        -0.0015743  0.0006219  -2.53  0.013       1.669


S = 0.133650   R-Sq = 91.7%   R-Sq(adj) = 91.2%


Analysis of Variance


Source                  DF        SS            MS              F             P

Regression          5     16.5663   3.3133   185.49   0.000

Residual Error  84   1.5004     0.0179

Total                     89   18.0668

The first step used to evaluate the model was the F-test, and since the model has a p-value less than 0.05, it is safe to say that the model passed the F-test. The adjusted “R” squared for the model was 91.2 percent, which means that 91.2 percent of the variation in ERA is explained by at least one of the independent variables used in this model. The method used to evaluate the relevance of the independent variables was the t-test, and each one of them, as mentioned earlier, had a p-value below 0.05, so in conclusion, they all passed the t-test. The p-value for K/9, BB/9, BABIP and HR/9 was 0.000 for each one of them, and the p-value for UZR was 0.013.

MODEL ESTIMATION SEQUENCE

  1. Correct functional form: To check for correct functional form, each one of the independent variables was plotted against the dependent variable. The scatter plots that resulted from this check show a linear relationship between each one of the independent variables and the dependent variable.
  2. Test for Heteroskedasticity: The data for this study is cross-sectional, so it was necessary to test for Heteroskedasticity, and such test was conducted by the second version of White’s test. To do so, the residuals for the original regression were stored. Those squared residuals were regressed against the Independent variables and the independent variables squared. After running the regression, an the F-test was applied to it and since the p-value was over 0.05, it can be concluded that the regression fails the F-test, therefore Heteroskedasticity does not exist in the initial model.
  3. Multicollinearity: This model also tested for Multicollinearity and it is done by using the correlation matrix and the Variance Inflation Factors, observed in the initial regression.
    1. Since none of the VIF’s is larger than 10, it can be concluded that Multicollinearity does not exist and the p-values from the t-tests can be trusted.
    2. A correlation matrix was calculated using all the independent variables but since every one of them passed the t-test, none will be dropped from the model.
  • K/9: p-value (0.000), VIF (1.099), rho (0.252)
  • BB/9: p-value (0.000), VIF (1.052), rho (0.195)
  • BABIP: p-value (0.000), VIF (1.741), rho(0.604)
  • UZR: p-value (0.013), VIF (1.669), rho (0.604)
  1. Drop any irrelevant variable from the model: Since all the independent variables in this model are relevant, none of them will be dropped from the model.

FINAL MODEL

The final model is exactly the same as the initial model because the it passed the F-test, all of the independent variables passed their t-tests and neither Heteroskedasticity or Multicollinearity are present in the model, so it was not necessary to run another regression or drop any variable.

COEFFICIENT INTERPRETATION

  • K/9: When the team strikes out one extra batter per nine innings, the team’s ERA should go down by 0.187 runs per nine innings holding everything else constant.
  • BB/9: When the team walks one extra batter per nine innings, the team’s ERA should go up by 0.413 runs per nine innings holding everything else constant.
  • BABIP: If every time a batter puts the ball in play he records a hit, the ERA will go up by 16.9 runs per nine innings. This variable is hard to explain since it will never go up by 1, it will go up or down depending on how many hits the team allows in any given number of at-bats where the batter puts the ball in play. For example, if a team averages eight hits every 27 outs, the BABIP will be 0.296 throughout the entire season. Taking into account that every batter put the ball in play (no strikeouts). The expected increase in ERA given a 0.296 BABIP during a season, and holding everything else constant, would be 5.00.
  • HR/9: When the team allows one more homerun per nine innings, ERA should go up by 1.72 runs per nine innings holding everything else constant.
  • UZR: When the team saves one extra run defensively, ERA should go down by 0.00157 runs per nine innings holding everything else constant.

SUMMARY

The null hypothesis for this project stated that defensive prowess didn’t affect ERA, but the results showed otherwise, so it is safe to reject the null hypothesis. Defensive prowess appears to affect ERA although in a small scale. This might not seem like much, but cost-effective teams like the Rays and Athletics can acquire premium defensive players at a much cheaper cost than a premium pitcher, and although they won’t be “game changers,” they will definitely improve the team’s ERA.

Baseball is a game of numbers, and these numbers don’t lie. A good defender will help his team save runs; a lot of good defenders will help their team save multitude of runs. Is this enough to get to the postseason or win a World Series? Absolutely not, but it has been proven already that finding edges in the game, as little as they might be, will help a team in the long run. The findings in this study are a concise proof that taking advantage of defense is an edge that can be exploited for the betterment of the organization.